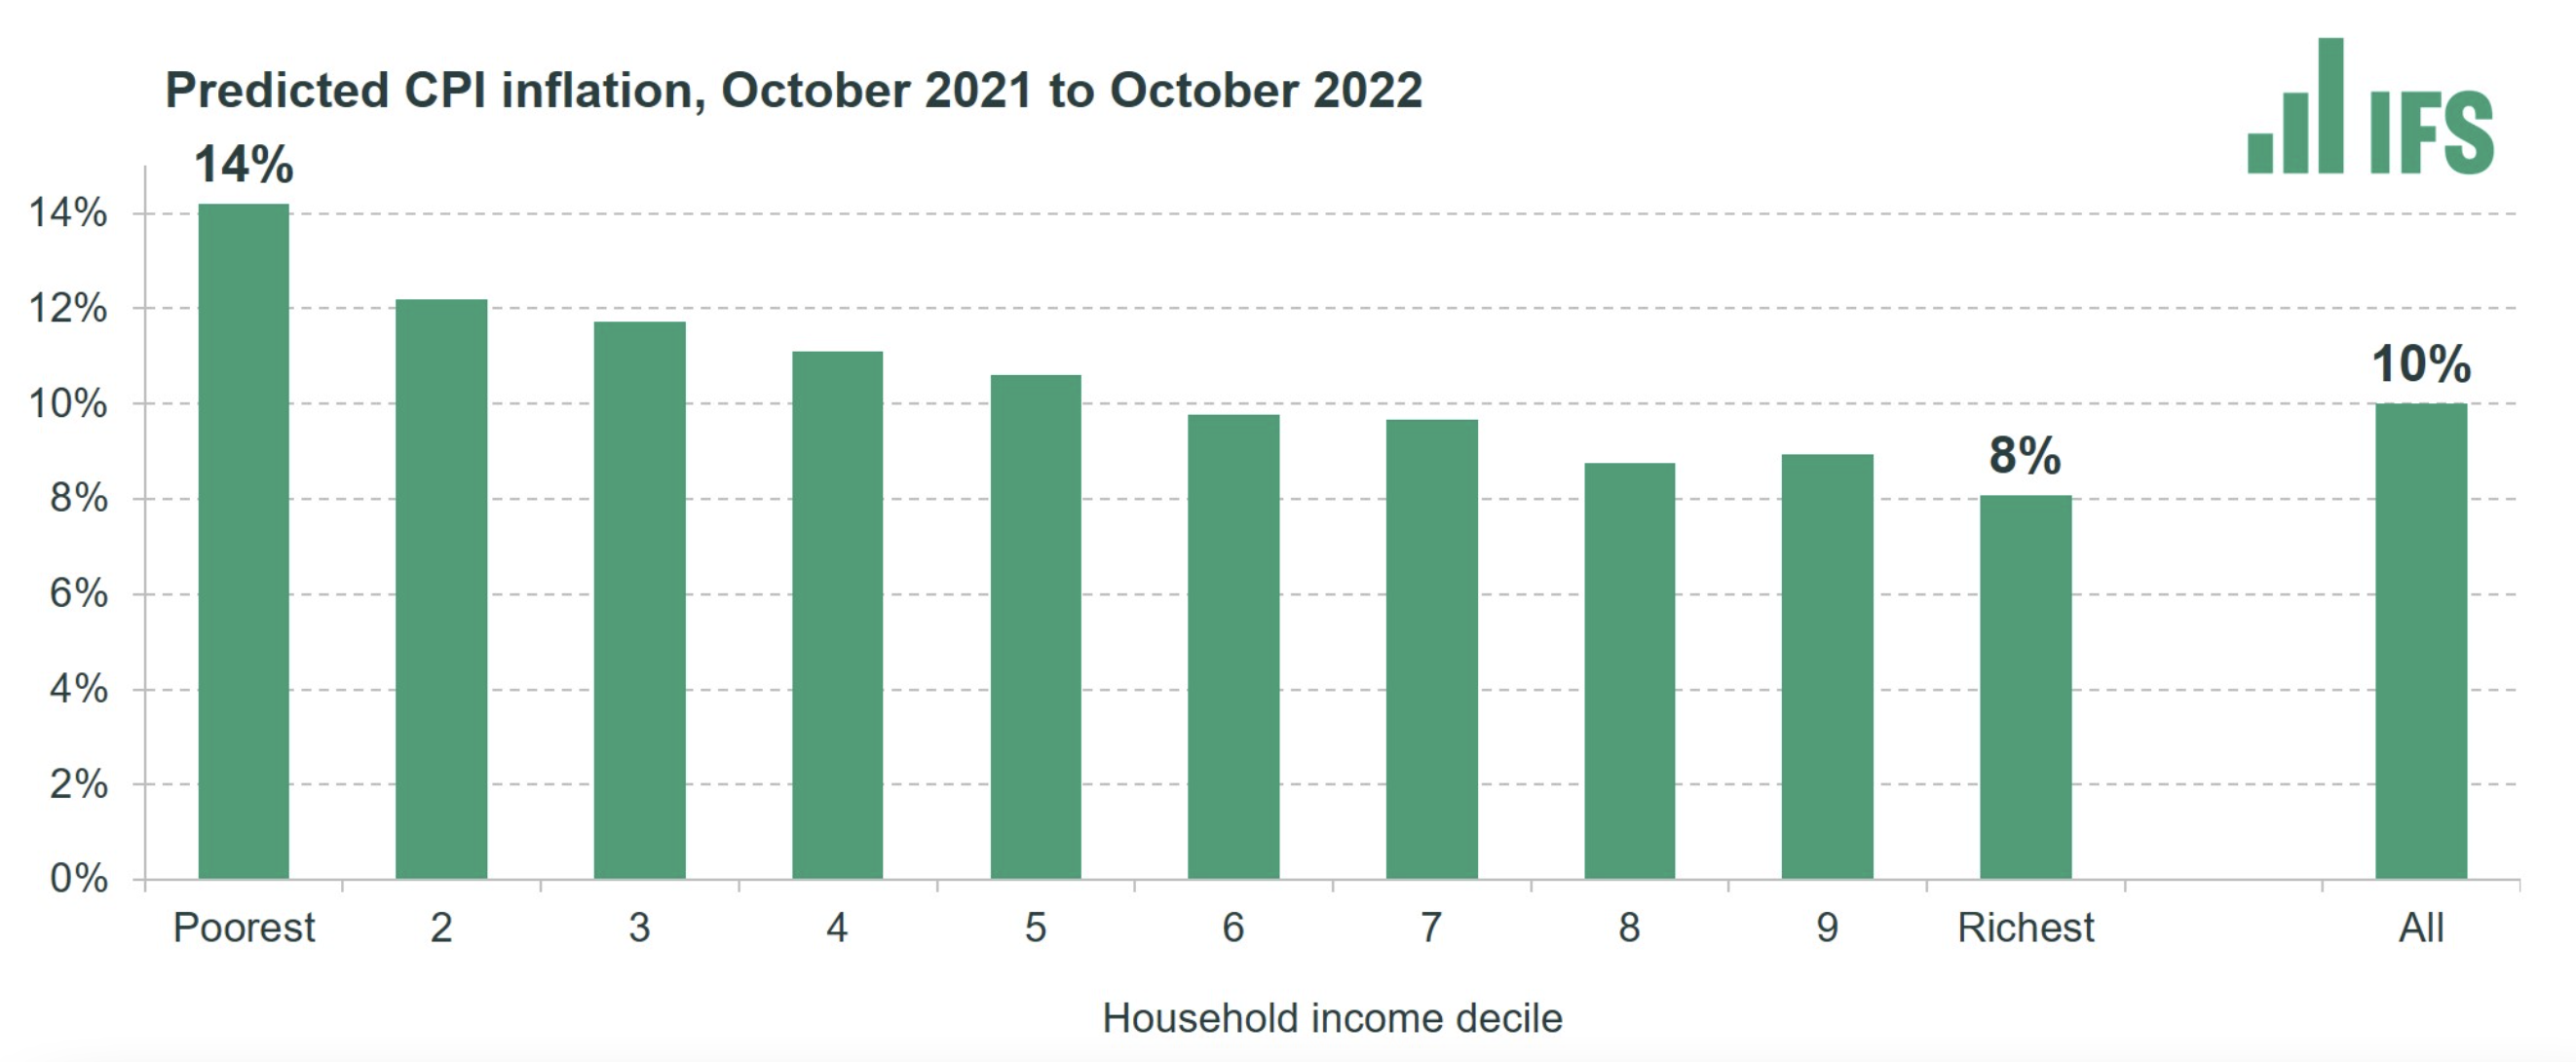
Nice page from IFS on how income inequality, living standards and poverty are evolving.
This one, in particular, is interesting – “Another way to see how income inequality has changed over time is the following chart – known as a ‘growth incidence curve’. This shows the average annual percentage growth in incomes at each percentile of the income distribution, for selected time periods.“
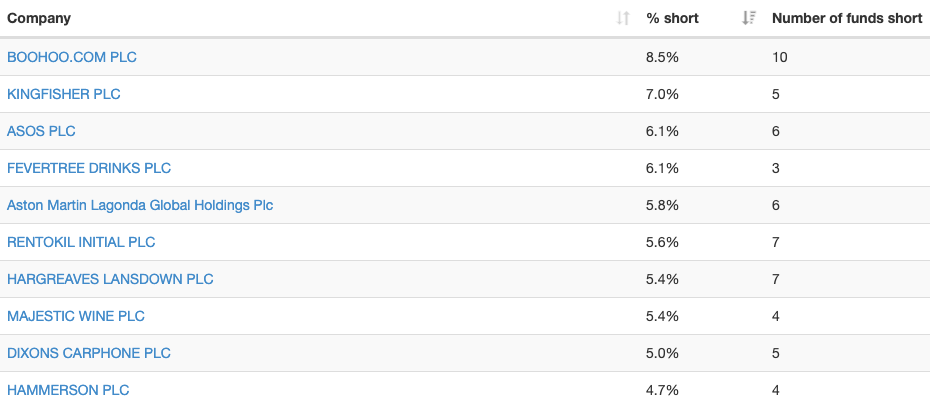
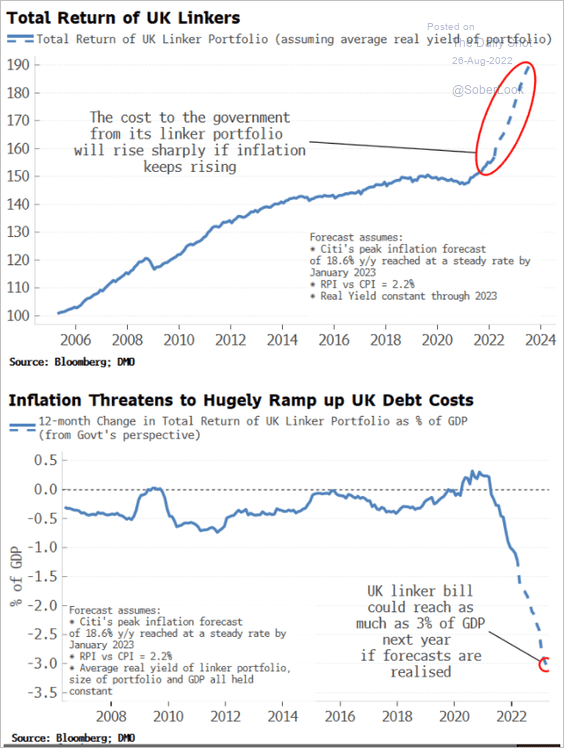
The UK is the only major region where the number of liquid companies (defined as having more than $1m of average daily traded value over six months) is down since 2003.
The full transcript of the testimony given by Lee Cain and, especially, Dominic Cummings for the inquiry into the government’s handling of the Covid emergency makes for long but utterly fascinating reading.
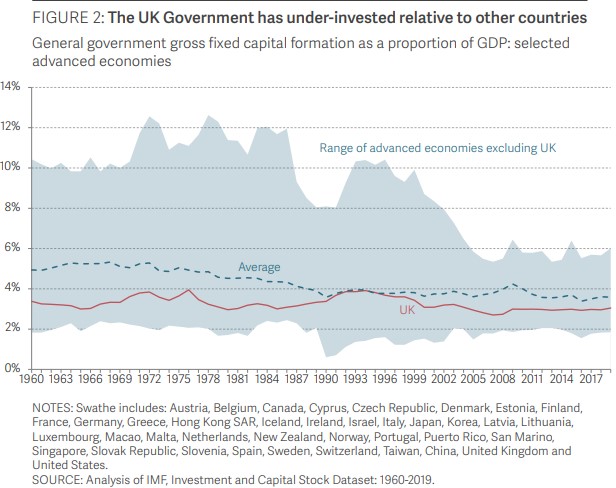
“Cancelling HS2, and rolling back on net zero, are two vivid examples of a long-term UK problem that has become acute since 2010. The government does not invest enough, and partly as a result the private sector does not invest enough. As this excellent report from the Resolution Foundation’s Felicia Odamtten & James Smith shows, public and private sector investment are complements; the former encourages the latter. This chart from the report shows that UK public investment is consistently below the international average, and that average includes many countries that have underinvested over the last two decades like Germany and the US.“
High-Speed 2 (HS2), the flagship rail line, as the blog points out, is not about faster transit time between the North and London, but rather helping create more capacity around major northern cities to improve their development. As the chart in the blog shows, outside of London, major UK cities are woefully behind other comparable cities in Europe in terms of productivity. This is something we covered before.
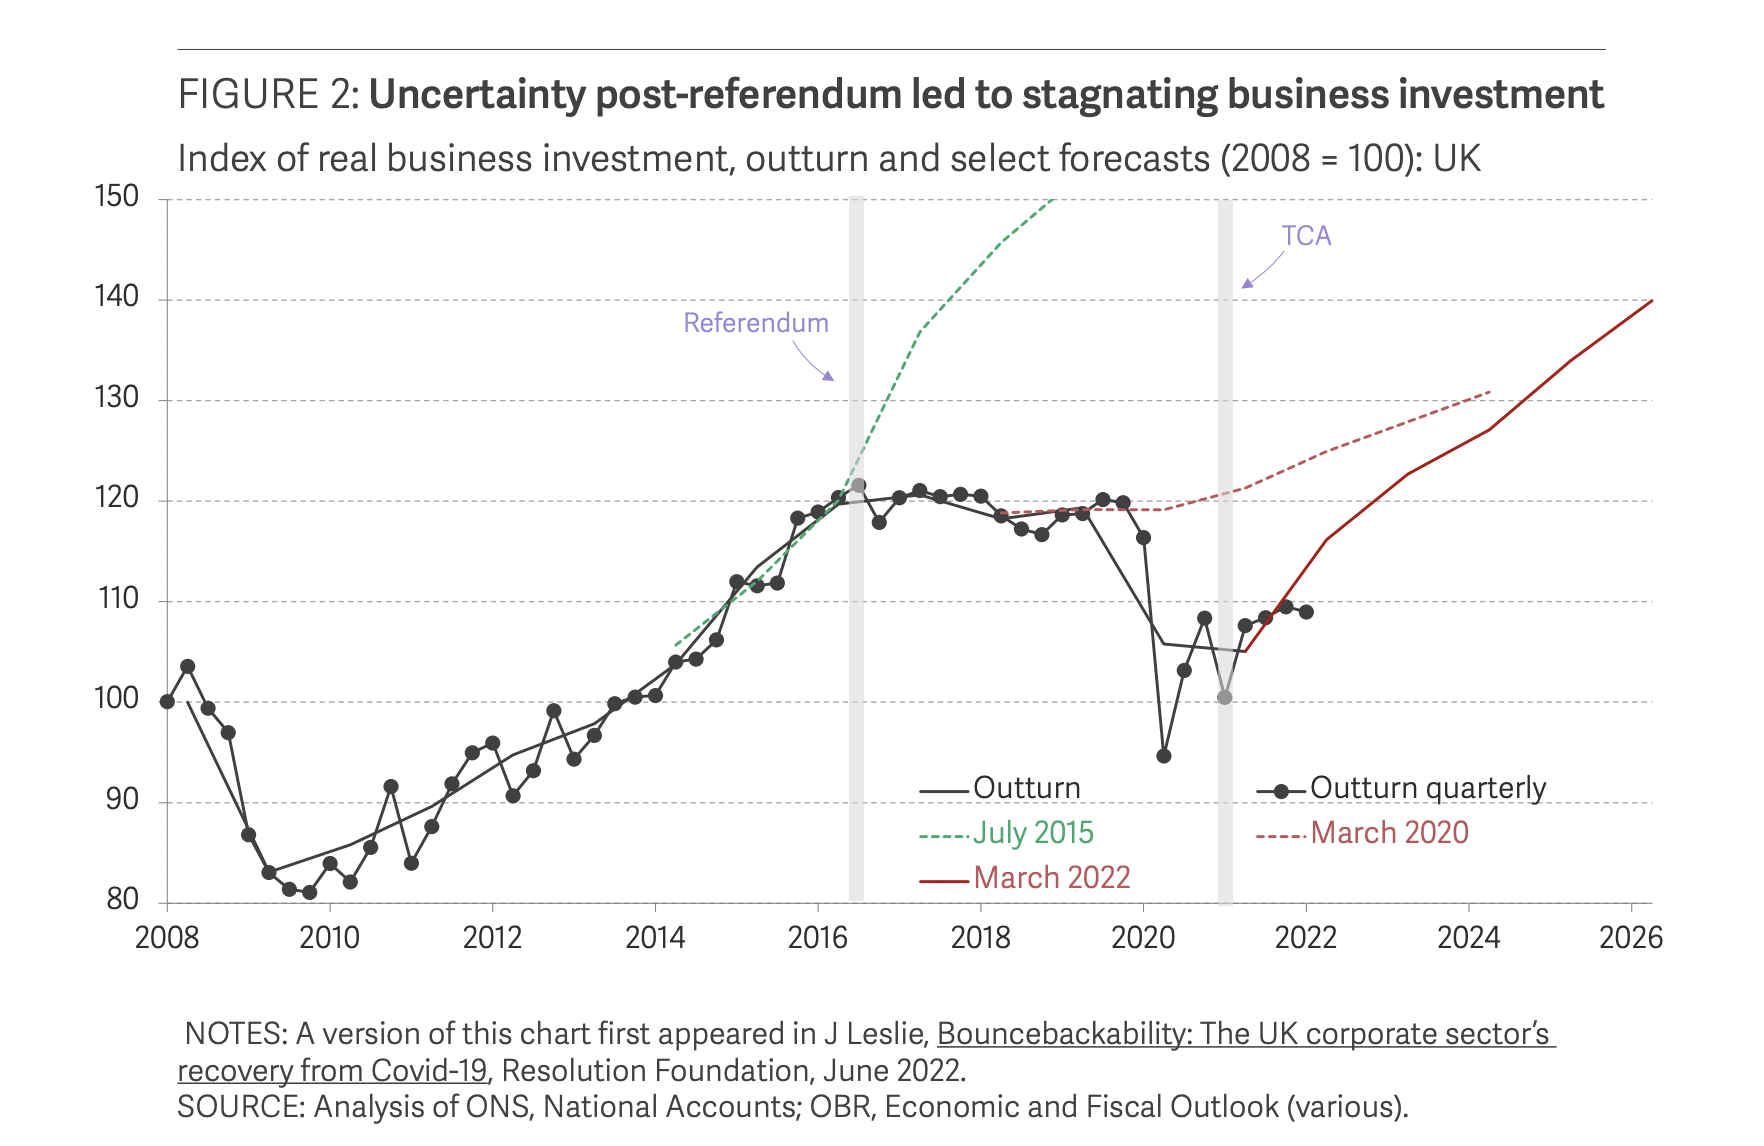
On the 23rd of June 2016 the UK decided to, by a slim majority (51.9%), to leave the EU.
Some six years later this comprehensive report looks back to analyse the impact.
The hit to business investment, as seen in this chart, is clear – “UK business investment fell by 0.1 per cent a quarter on average in the three years post-referendum, compared to growth of 1.7 per cent a quarter on average growth in the previous three years, and ongoing growth in other G7 countries.“
However, the universally held belief that trade with the EU would suffer, didn’t materialise. “The UK has now been trading under the terms of the TCA [Trade and Cooperation Agreement] for 18 months, and, although UK imports to the EU have fallen relative to the rest of the world, the share of goods exports to the EU remains at its pre-Brexit levels.“
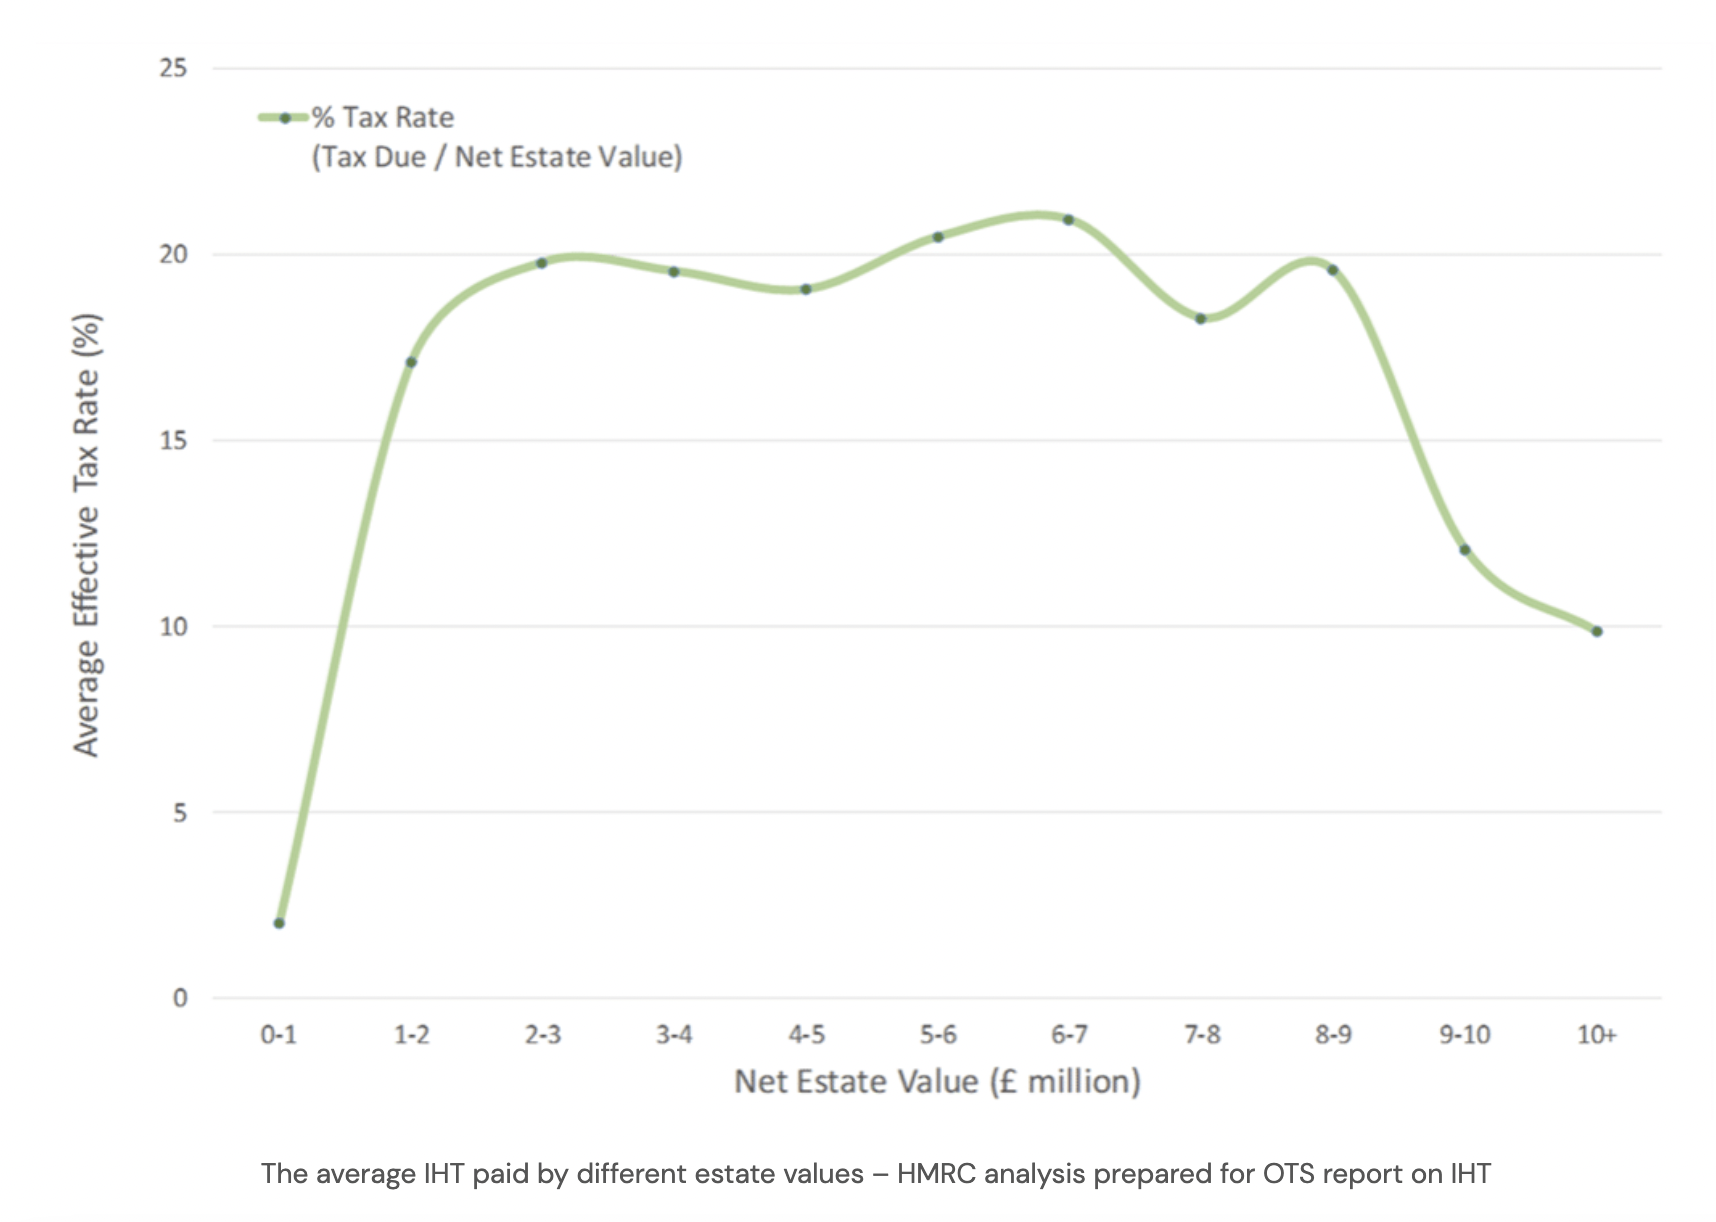
The effective rate looks very different to other countries and raises less than it should.
In addition, take this chart from HMRC’s (UK tax authority) analysis of 2016/17.
It shows estate values on the x-axis and the effective tax rate on the y-axis.
Notice the huge drop off for large estates (£9m+).
It turns out the IHT is only progressive for mid/upper-mid classes.
There are plenty of reasons why this is (listed in the article).
IHT is “a tax with a terrible combination of a high rate (which makes it unpopular and drives avoidance) and poorly targeted/overly-generous exemptions (which then enable avoidance).“