“Czech Republic has one of if not the best reputation in policy-making credibility. When they signal a cutting cycle is to begin, its worth taking note.“
Interesting interview throughout on all things EM and Macro.
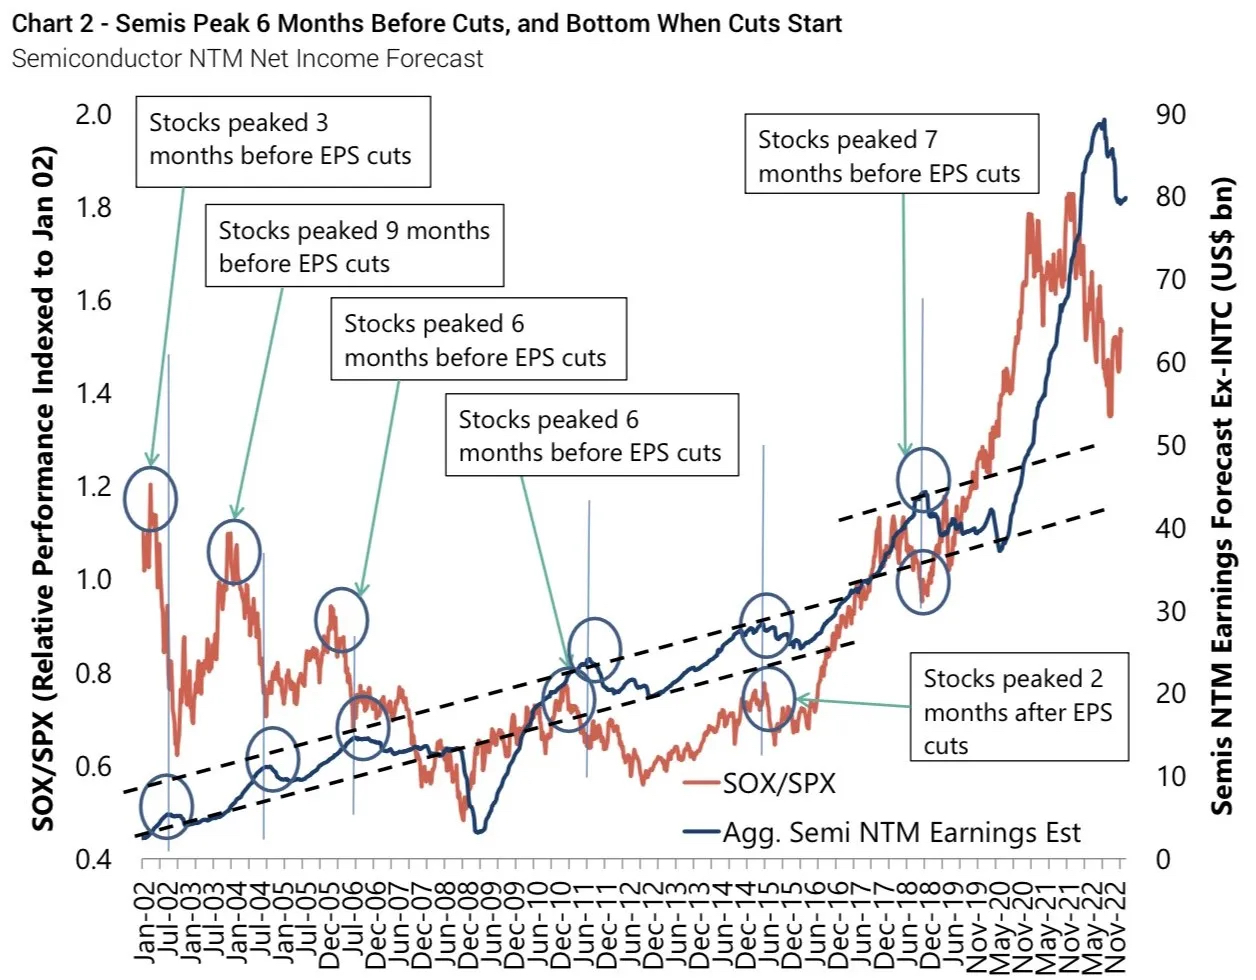
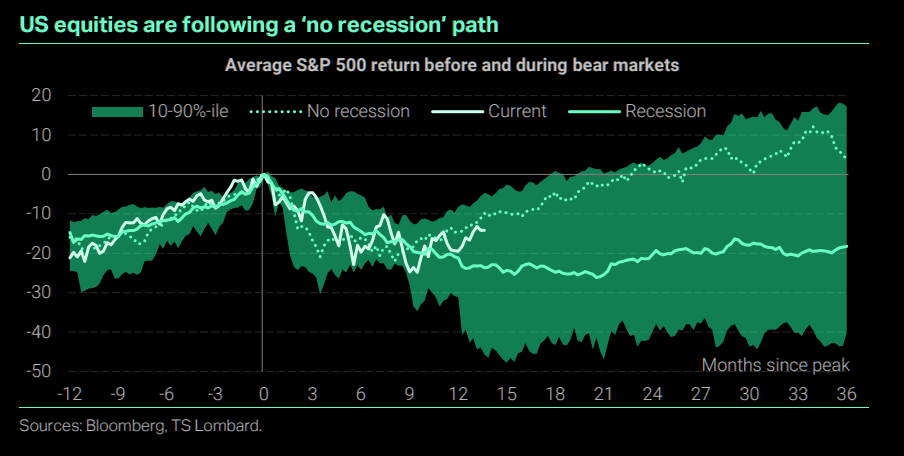
“The most intriguing aspect of Wall Street’s behavior is that if we examine every period of industry decline over the past several decades, we see that stock prices reach their lowest point when the industry only starts to experience a fall in earnings, well before the trough of earnings. The stocks were already recovering and surging by the time layoffs and consolidation occurred.“
Semiconductor index (SOX) is up strongly since October lows and earnings cuts have only just started i.e. a typical pattern with the expected bottom of the cycle is Q2 2023.
Yet, as argued here, this cycle appears different – (1) days of inventory at record high which will take, despite a desire for supply chain resilience, more than two quarters to clear (2) there is an oversupply of certain process tech (3) channel stuffing has been a big feature.
A harsh, almost damning, write-up of Intel, pre-dating the dividend cut.
“In reality, Intel is not the giant of the industry. Intel’s total share of industry capacity is around 10%, they are not a giant who has stumbled, they are a niche player and have been for years.“
Charting the backlash against ESG across US states.
“As of January 2023, almost 50% of US states either have some type of anti-ESG restriction in place or have placed blacklisting ESG action high on their legislative agenda.“
“Analysis of these developments (111 in total as of 10 January 2023) reveals how at the state level, anti-ESG developments have rapidly outpaced those in support of ESG measures over the past three years.”
The chart on page 66 of the deck suggests that this backlash, at least as it materialized in ESG ETF flows, is mostly an American and Japanese phenomenon.
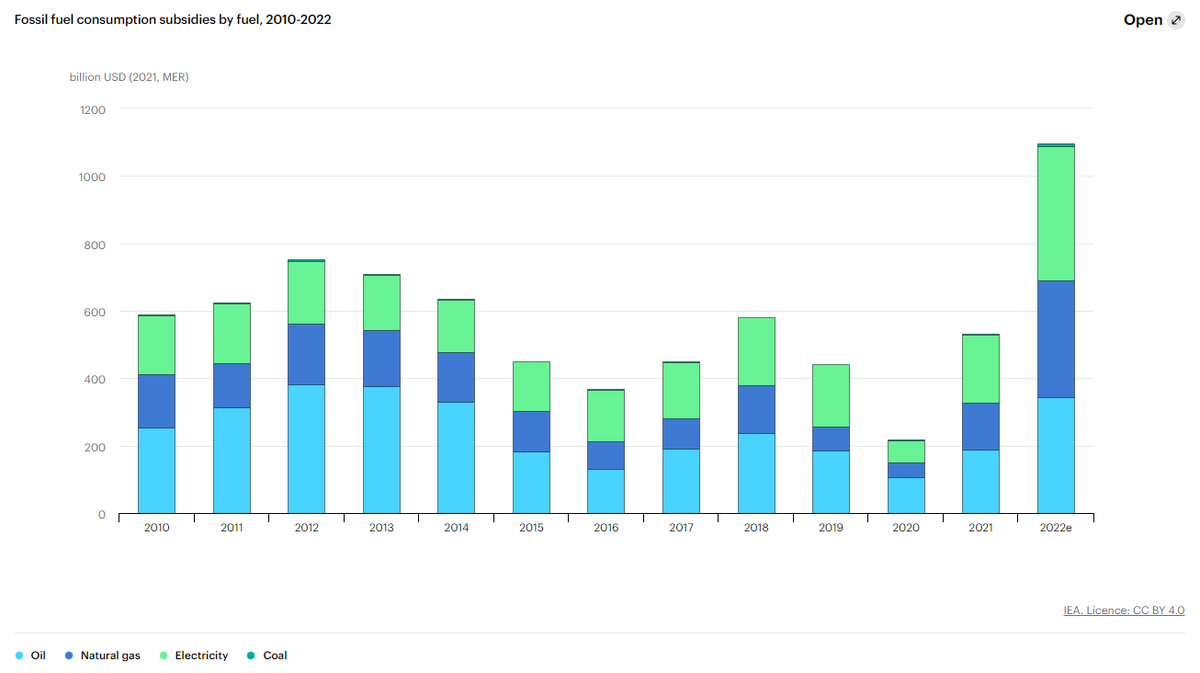
Original source here; chart from this excellent climate slide deck.
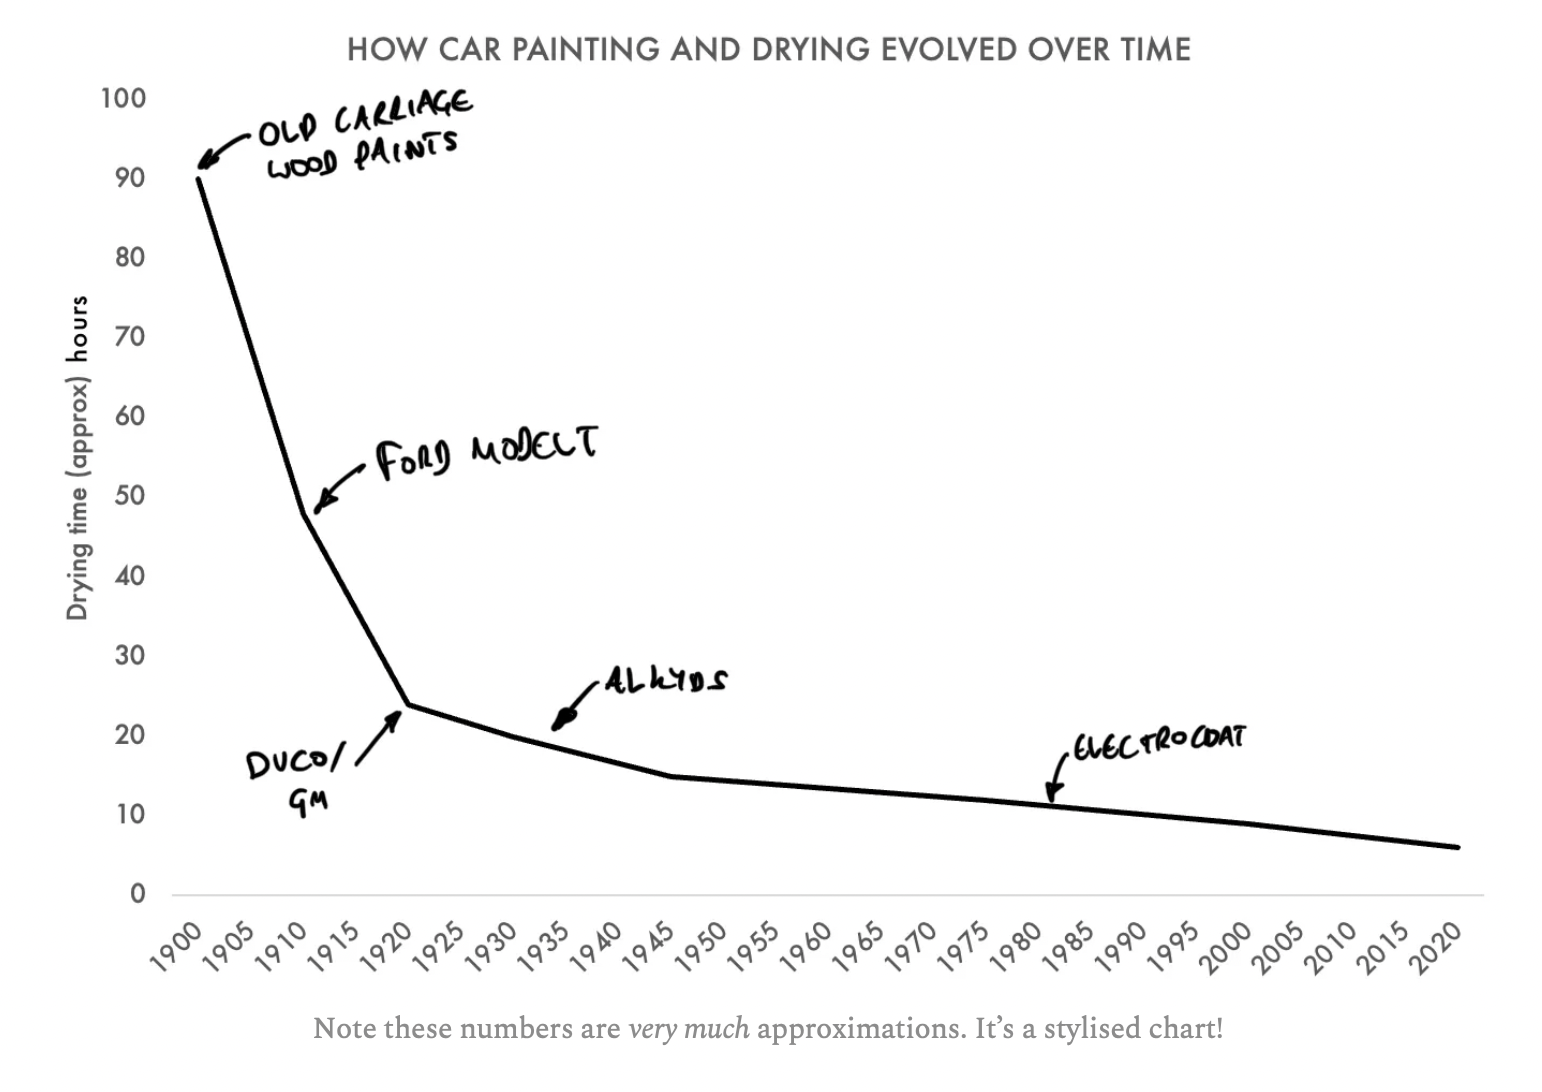
“Each coat of paint on the Model Ts had to be brushed or dipped on and allowed to dry before the next layer went on. While the duration of assembly was initially measured in hours, the duration of painting was measured in days or even weeks.“
So starts this sojourn into the world of car paint and how the “single biggest hindrance to mass production” for Ford was solved.
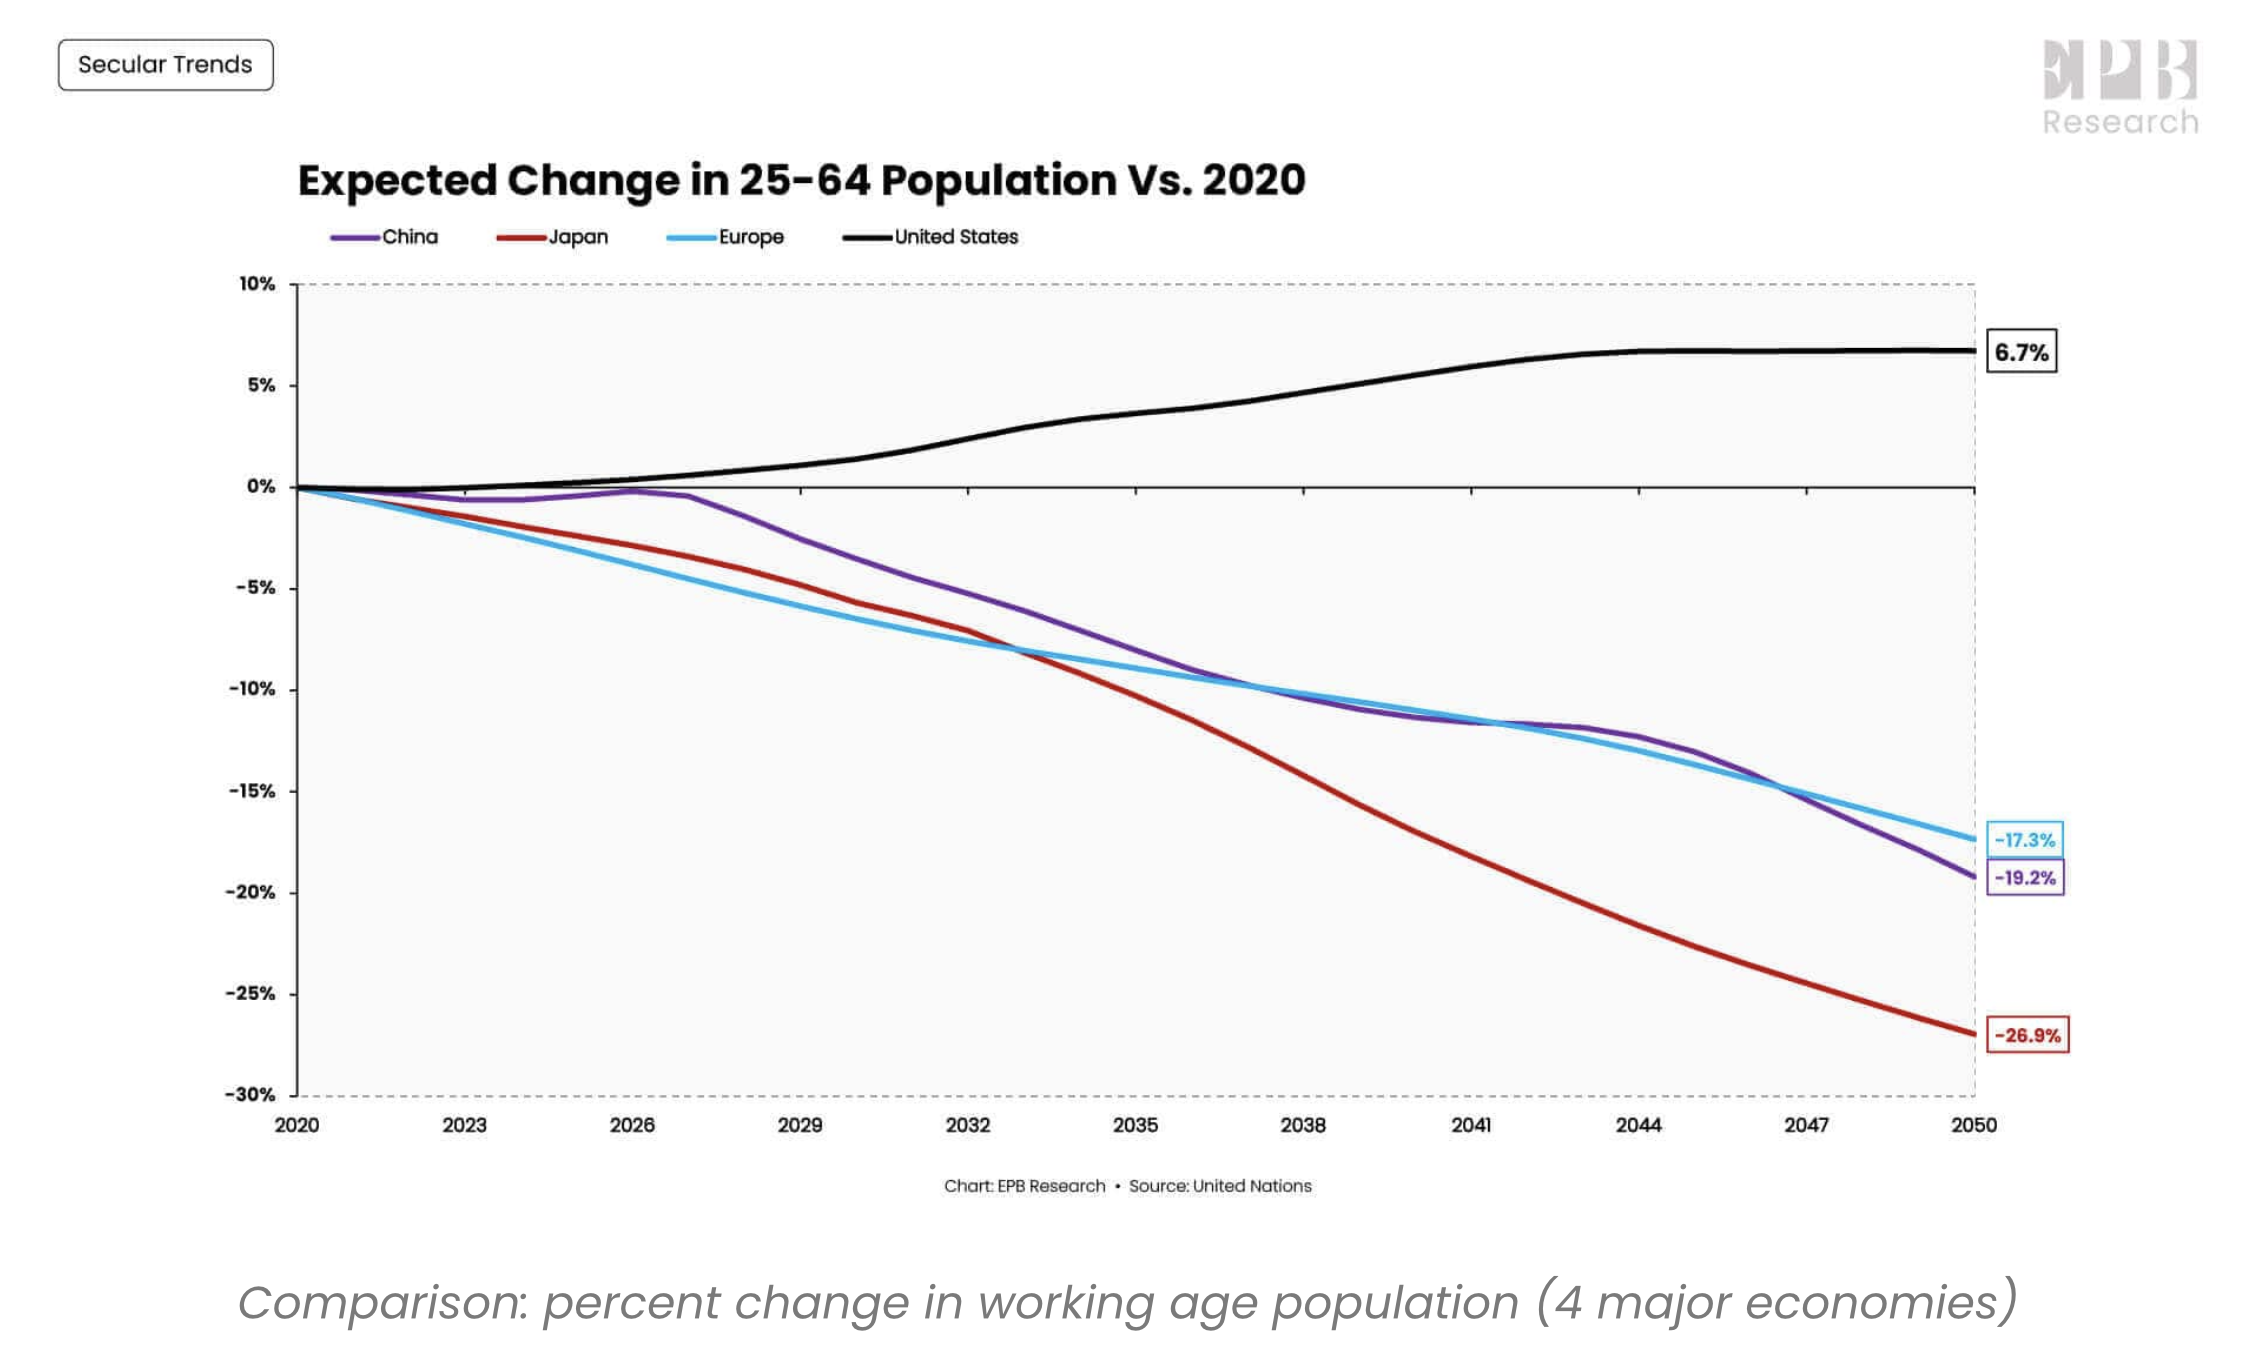
Four regions, the US, Europe, Japan, and China, make up 70% of the world’s consumption.
In 2020 this group was home to 1.47 billion people aged 25-64, the prime demographic. By 2050 there will be 1.2 billion. “That’s an 18% decline in the working age population for the four largest economic regions.“
The US, as seen in this chart, fares best as it sees this cohort grow. However, at slower rates than before and facing a decline as a proportion of the overall population.