Borrowing by private equity firms at the fund level.
Ted Seides argues it is an end-of-cycle phenomenon.
“NAV loans strike me as a canary in the coal mine signaling the end of the private equity boom. According to Preqin, 645 firms have not raised a new vehicle since 2015. With interest rates higher and the fundraising environment tighter, credit is scarce. NAV loans feel like the “extend and pretend” activity we saw after the GFC. For every Vista NAV loan, there are probably ten used to cure the woes of a GP.”
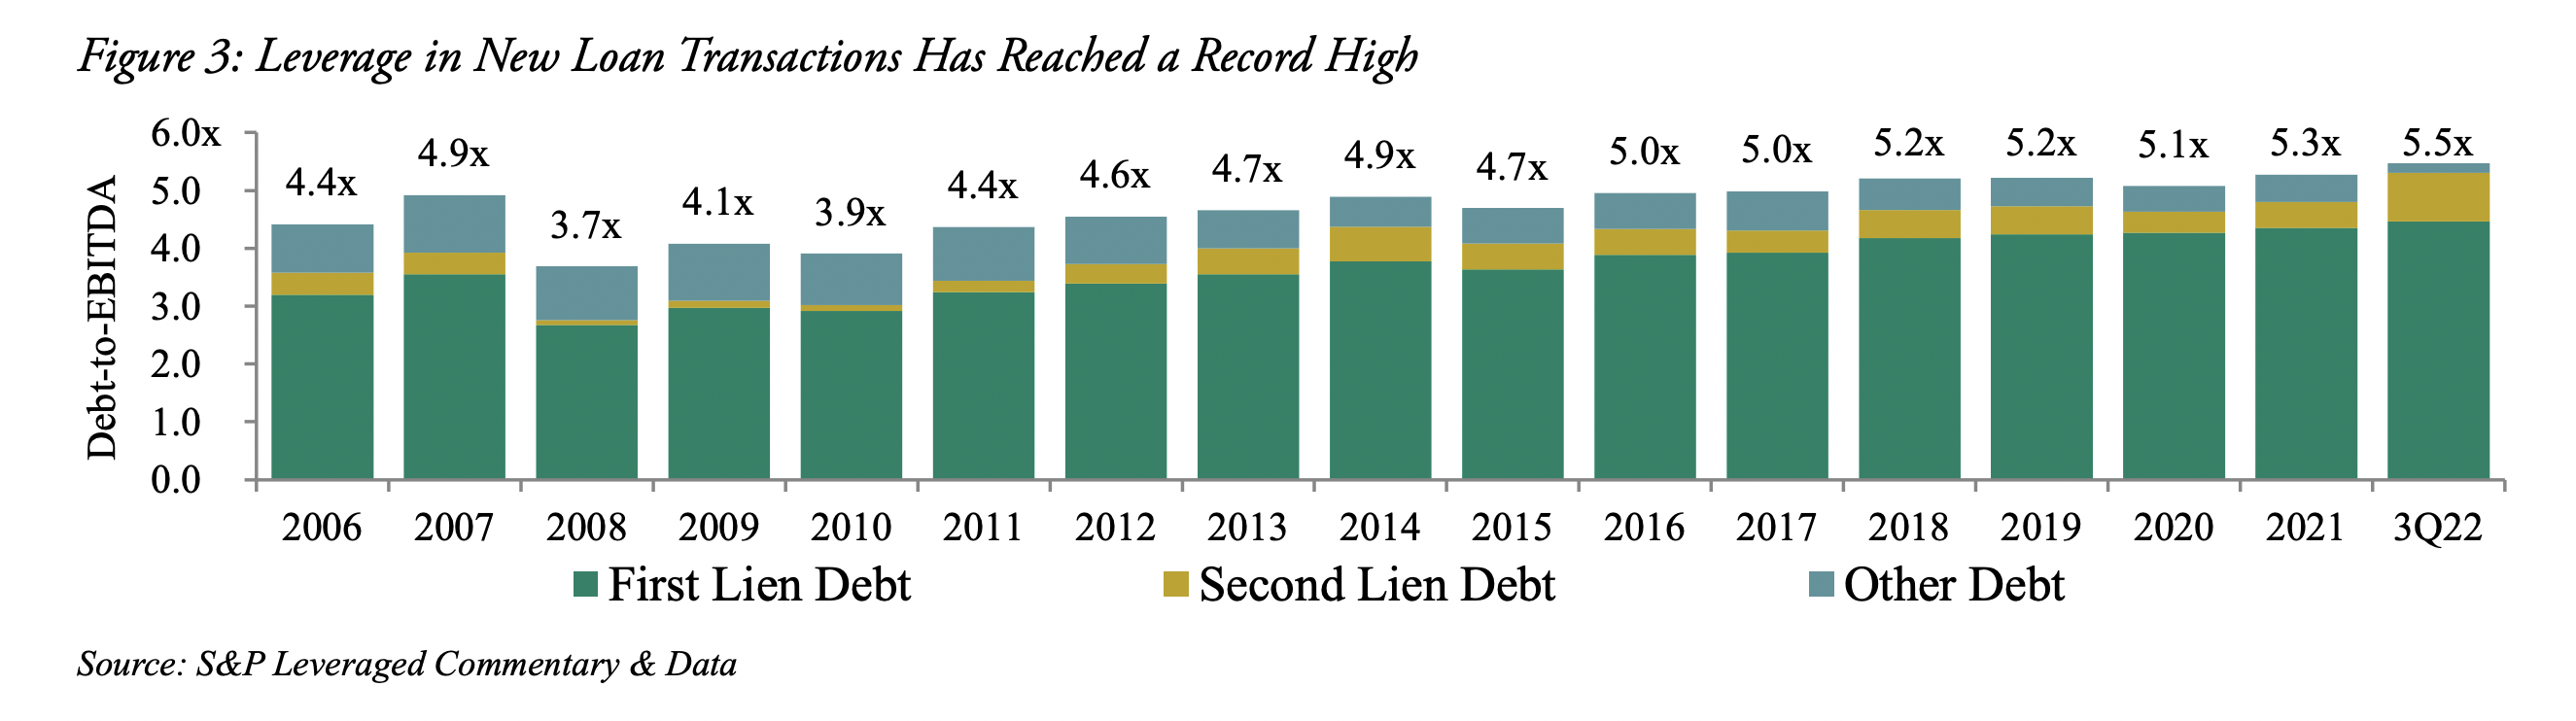
“This risk is particularly noteworthy given that many companies with loans outstanding are carrying significant debt loads.The average debt-to-EBITDA ratio in new U.S. loan transactions hit a record-high 5.5x in 1Q2022, above the 4.9x recorded just before the Global Financial Crisis.“
“Importantly, companies involved in these transactions were often more highly levered than they appeared on paper, as many used aggressive EBITDA adjustments (e.g., for synergies, cost cuts, etc.) when making these leverage calculations.”
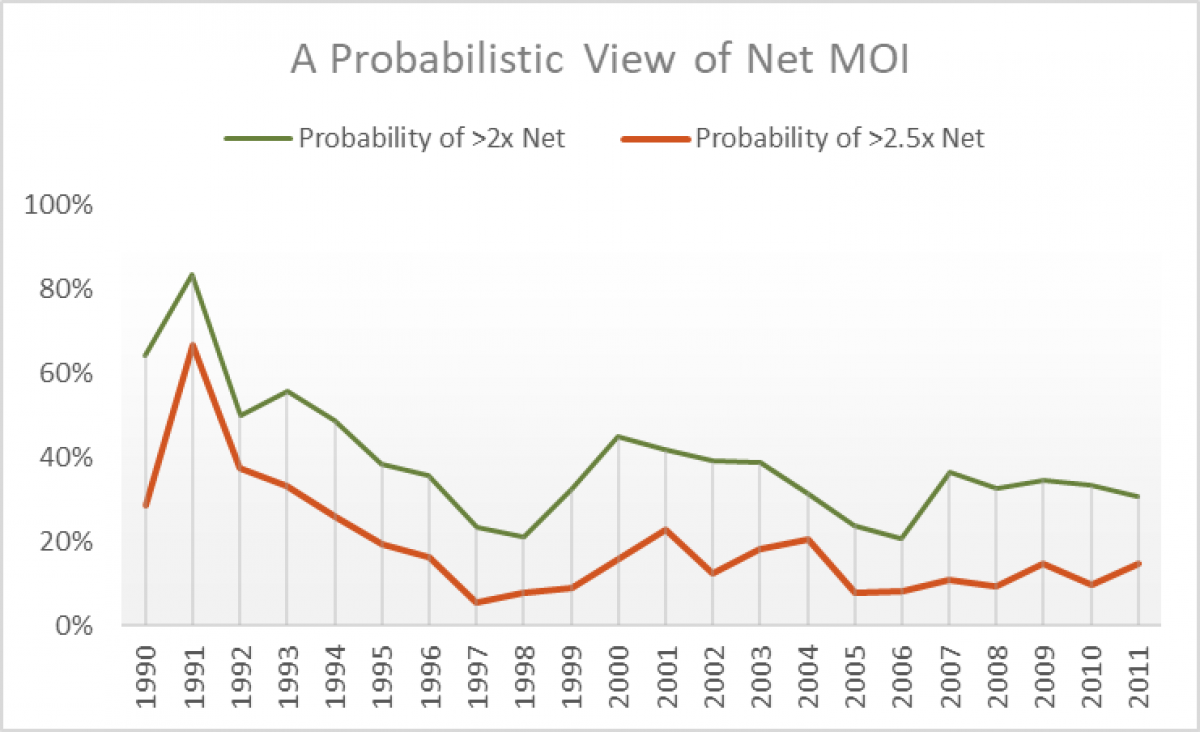
The probability that a mature private equity fund will deliver 2x on investment fell in the 1990s and has since held steady at 30-35%.
In other words the probability of NOT achieving 2x is 65-70%.
For >2.5x the probability of NOT achieving is nearly 90%.
The data uses North America and EU strategies, >$100m, across buyout, growth and turnaround. 2011 vintage year is used to eliminate non-mature funds. This filter led to 1,200 funds.
“Splitting a good black jack hand” is a great way to describe how Michael Dell pulled off perhaps the most daring deal of the last decade.
“Before the LBO, he owned 15.6% of his company, shares worth less than $4 billion. Thanks to the miracles of his financial engineering, he will own 52% of Dell and a 42% stake in VMware. The total value of his Dell holdings is $40 billion.“
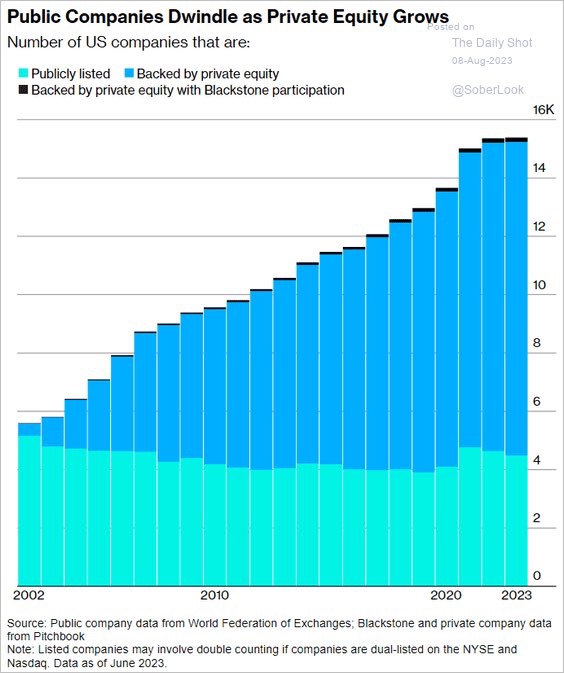
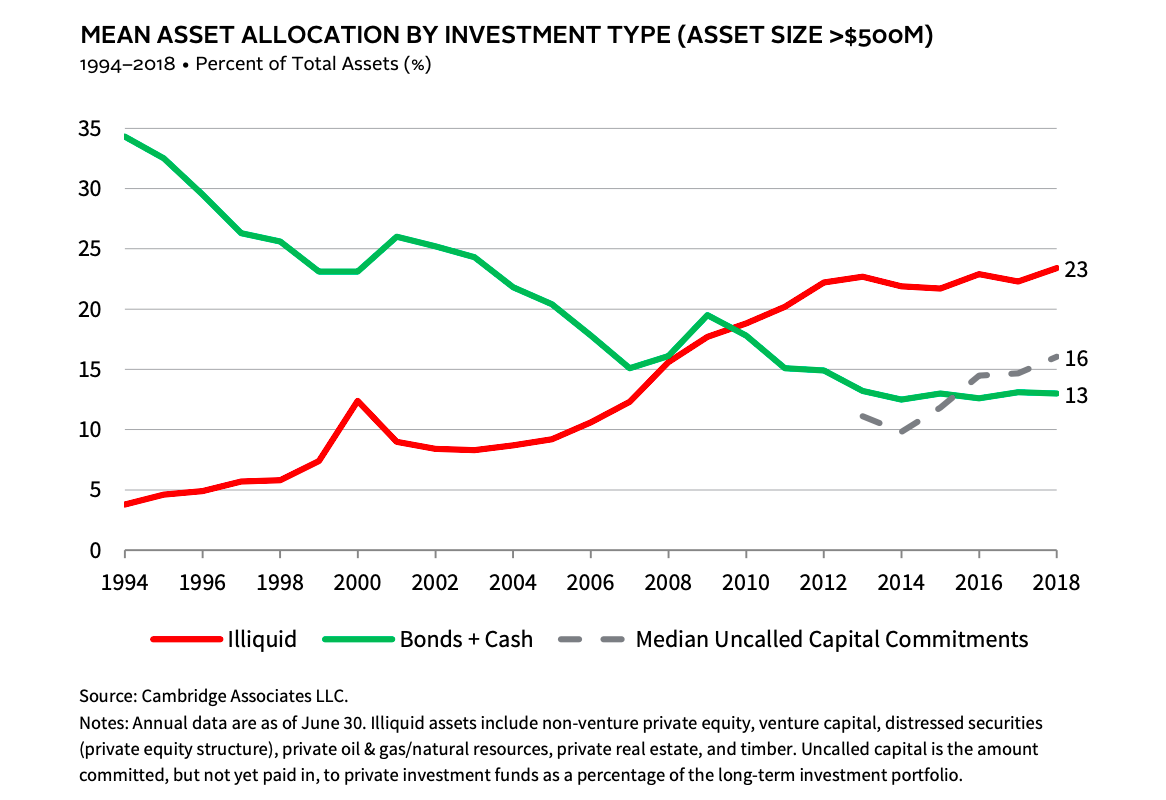
“Over the past quarter century there has been a marked shift in U.S. equities from public markets to private markets controlled by buyout and venture capital firms. This change has had reverberations for asset managers, investors, executives, and policy makers.“


