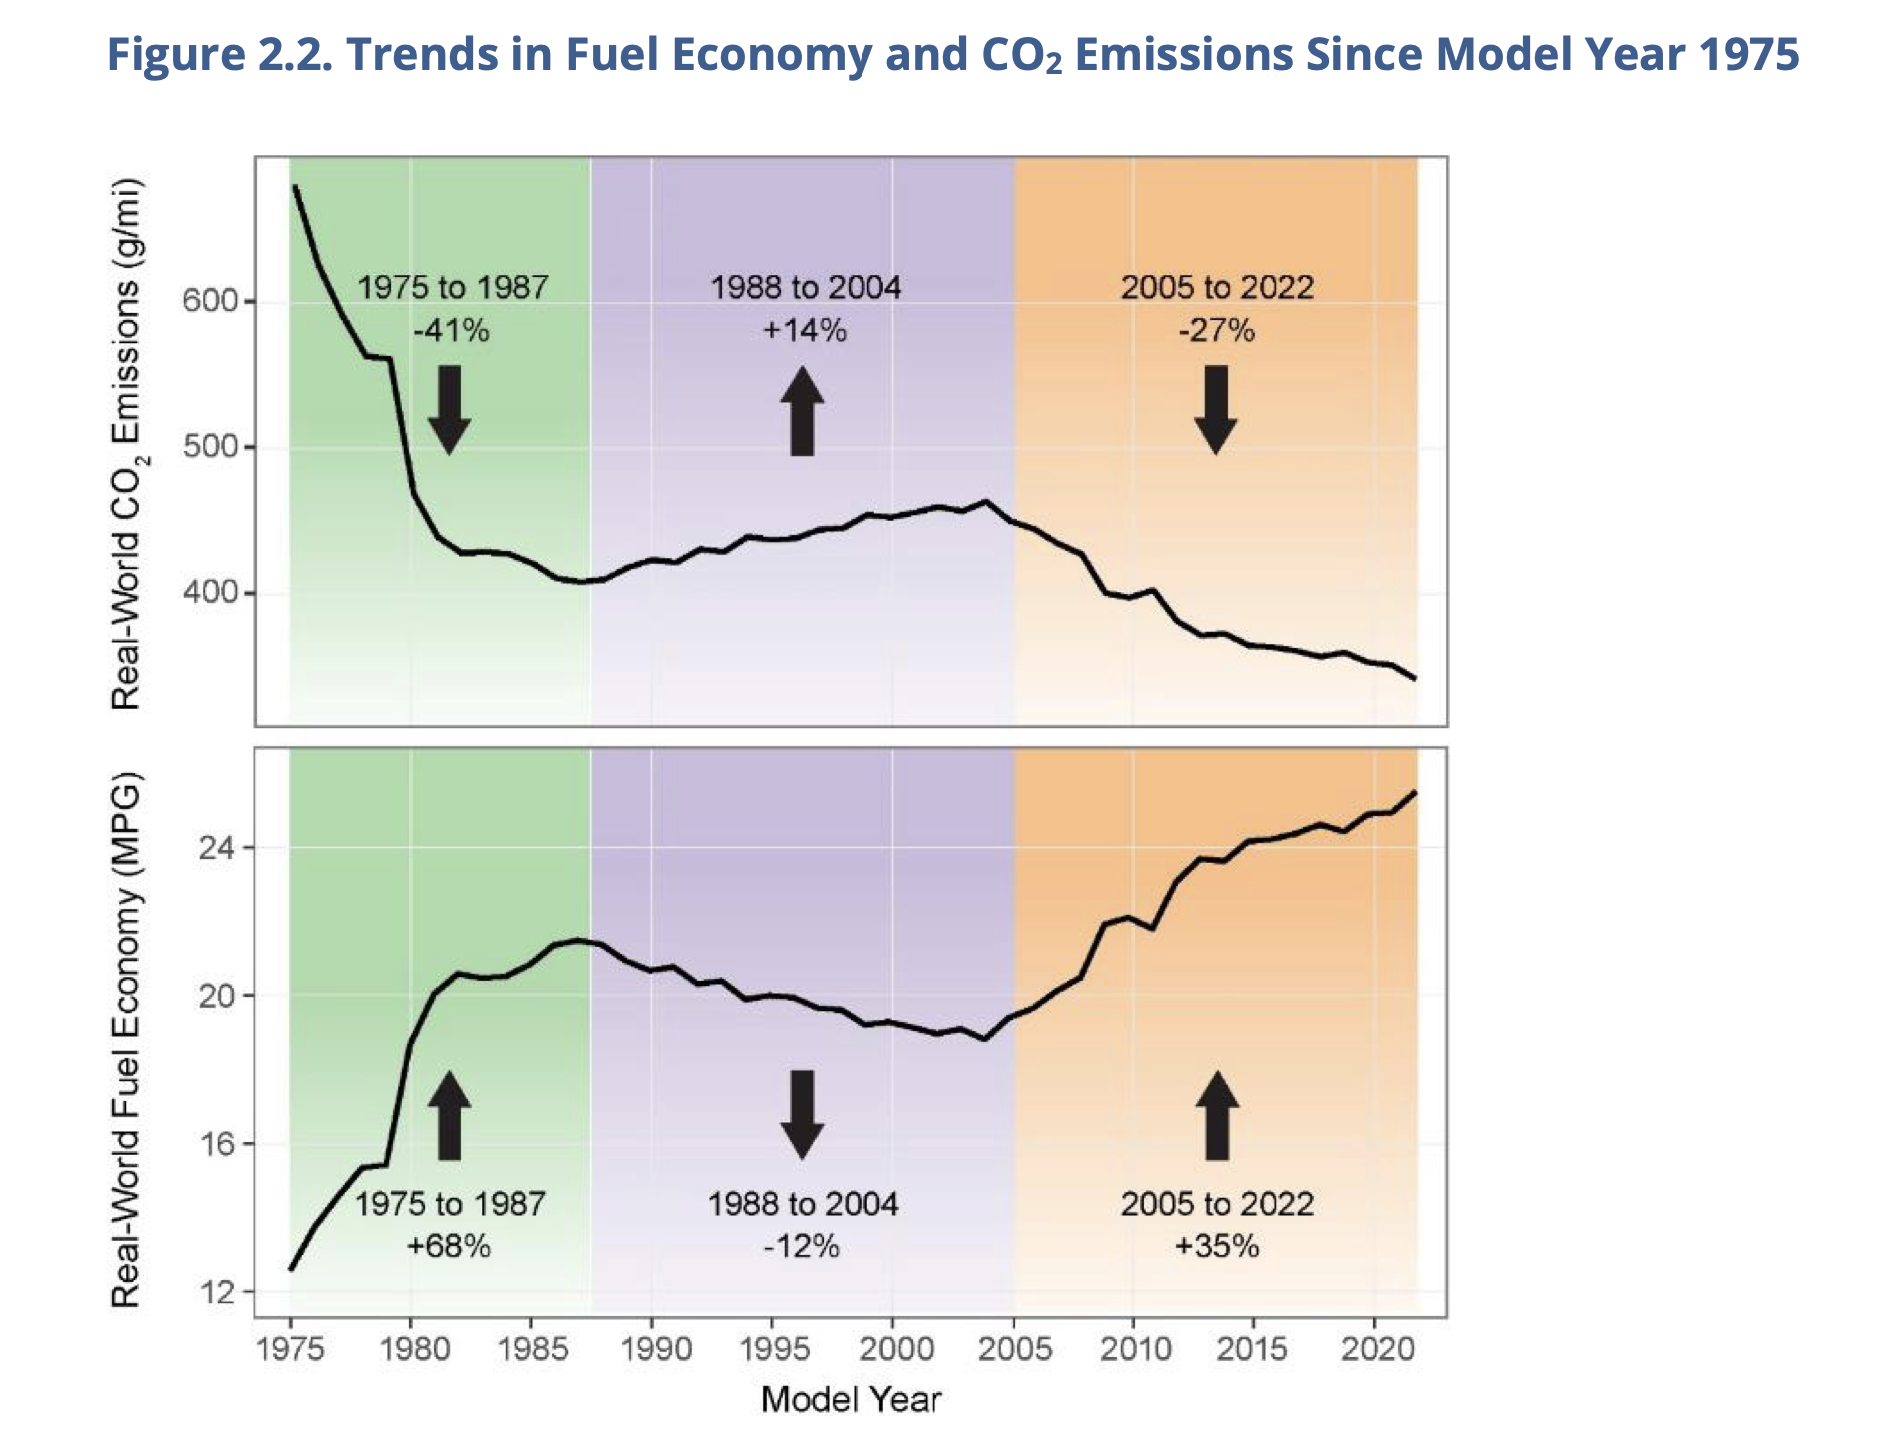
“In model year 2022, the average estimated real-world CO2 emission rate for all new vehicles fell by 10 g/mi to 337 g/mi, the lowest ever measured. Real-world fuel economy increased by 0.6 mpg, to a record high 26.0 mpg.1 This is the largest single year improvement in CO2 emission rates and fuel economy in nine years.“
2023 model year is already showing improvement on this.
The long-term trend is encouraging (see chart) all while horsepower is up 88% since 1975 (see page 27).
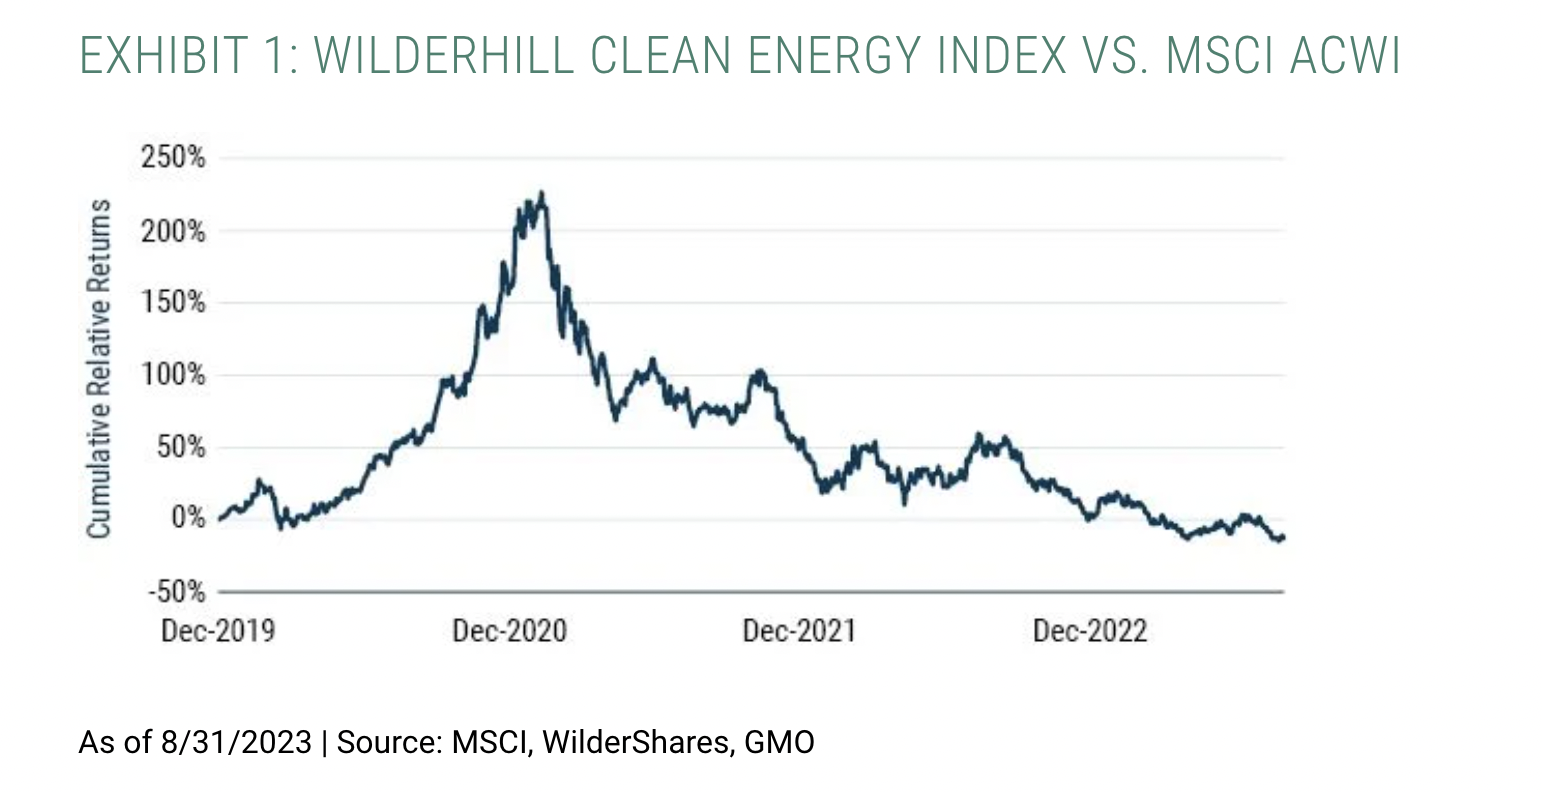
As GMO points out – clean energy has gone through a classic hype cycle.
All the relative outperformance blow out has come off.
Yet, change could be afoot – especially as firms focus on profitability – as described in this excellent analysis from AlphaSense (need to sign up).
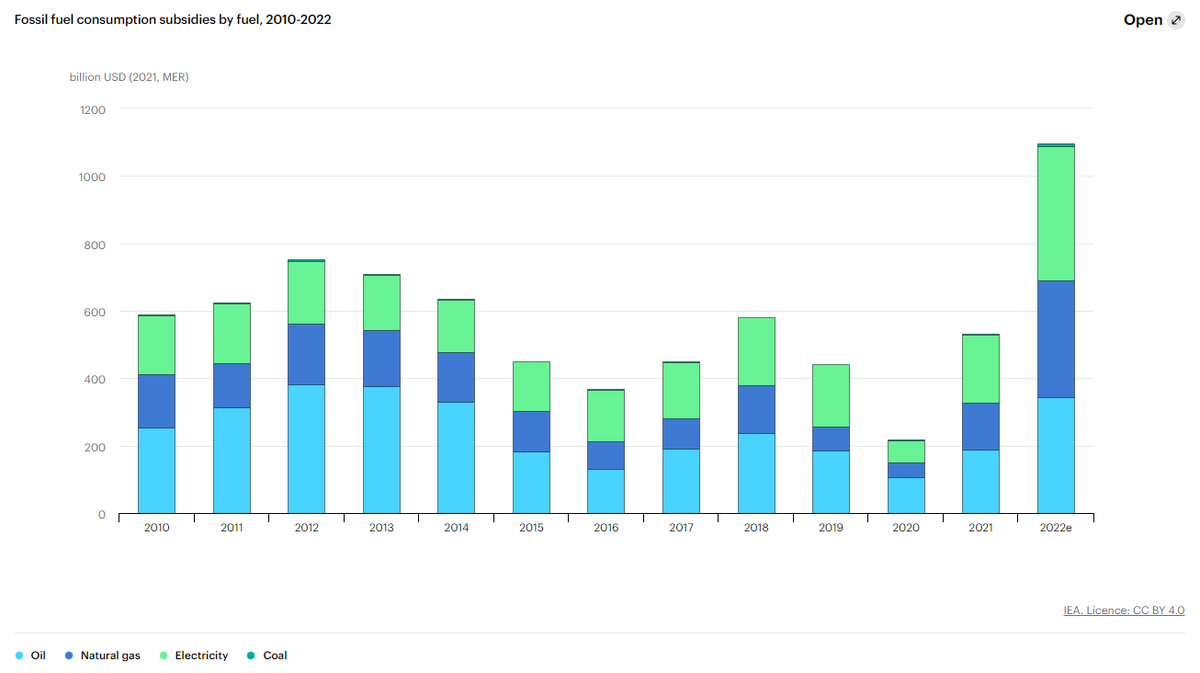
Government policy is helping – here is what GE said about the big incentives offered by the Inflation Reduction Act (IRA).
“I know the IRA has created an eight year incentive, an incentive through 2030. That was enough of a long-term incentive for a few of the manufacturers that I know of that were making big decisions on supply chain changes, onshoring things, changing from China sources. In the absence of IRA incentives they would not happen. They would be small changes.“
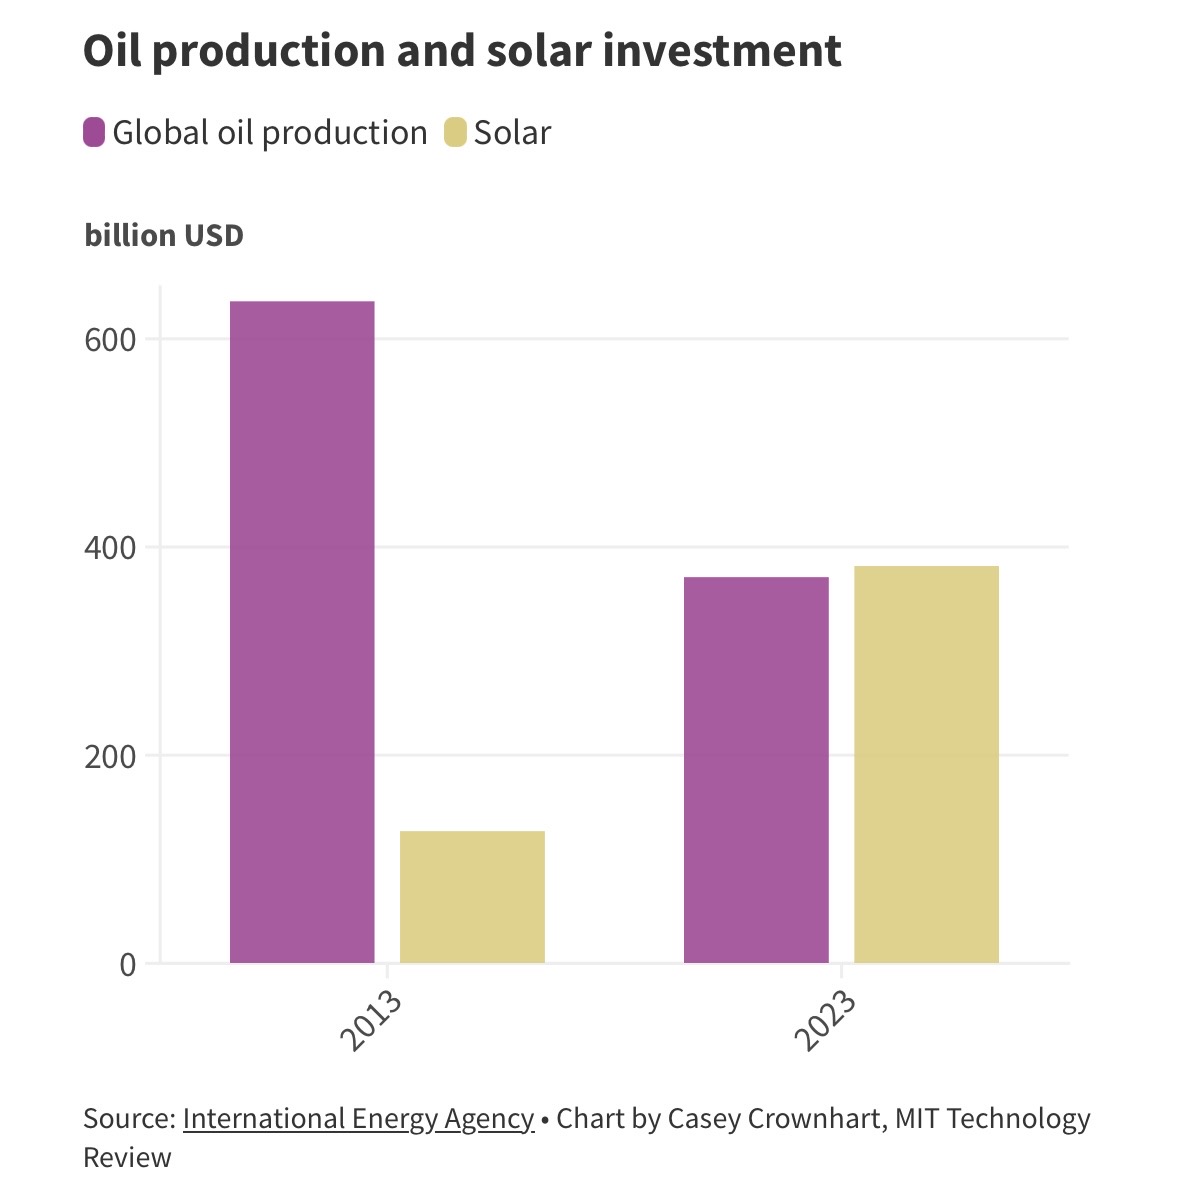
“In 2023, for the first time, investment in solar energy is expected to beat out investment in oil production. It’s a stark difference from what the picture looked like a decade ago, when oil spending outpaced solar spending by nearly six to one.”
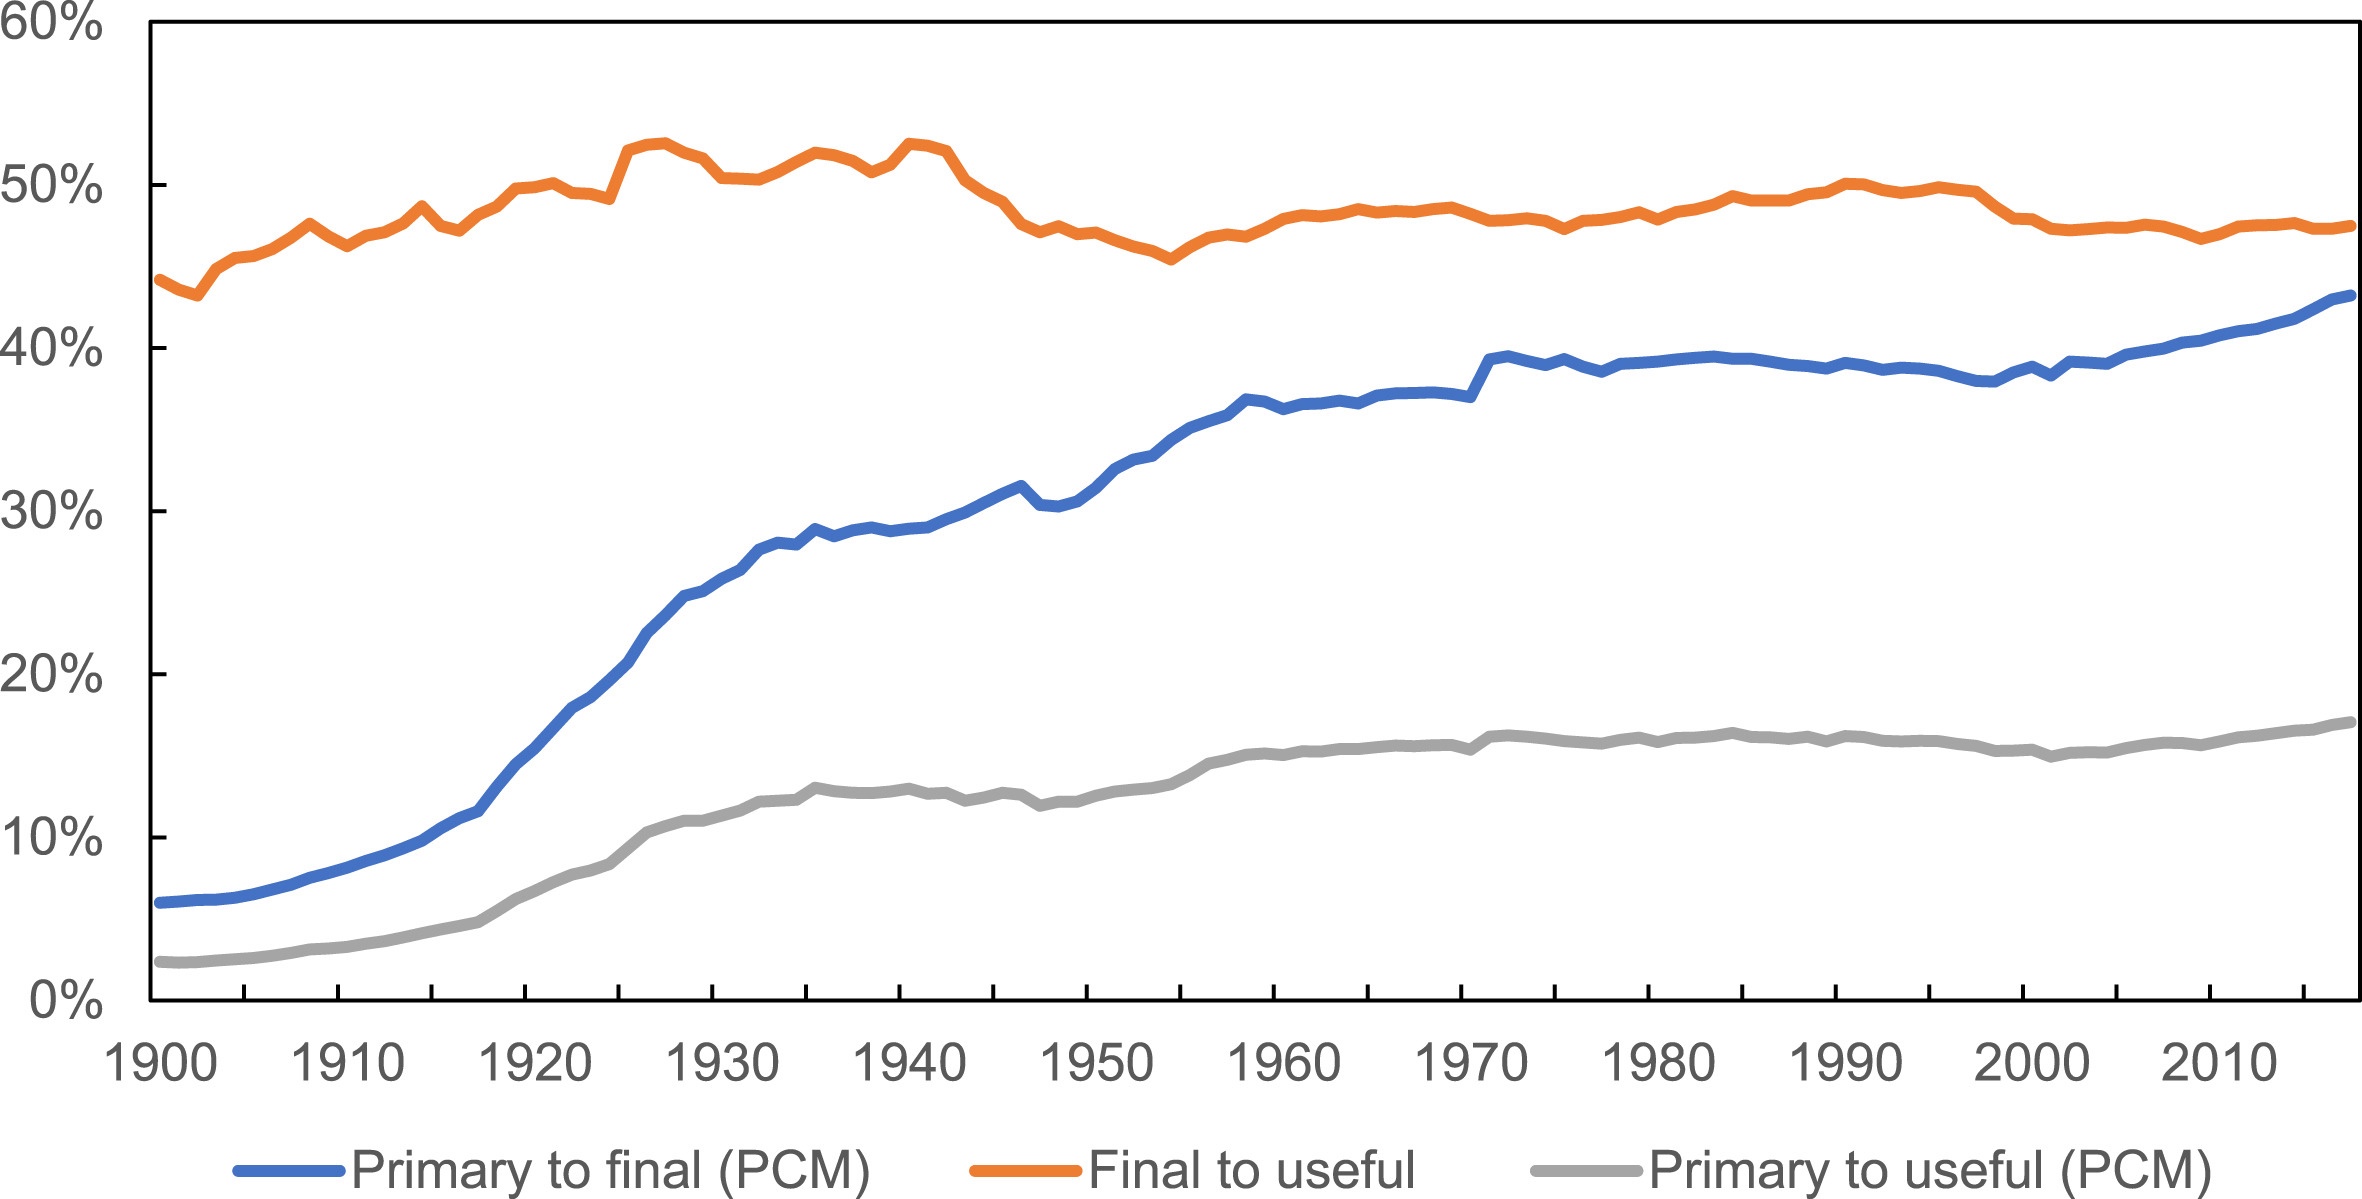
“The most striking finding is that world electricity energy efficiency (measured as overall primary-to-useful exergy efficiency) has stalled, rising dramatically from 2% in 1900 to 15% in 1960, and remaining nearly stable for the last 50 years, only reaching 17% by 2017.”
Why? Power generation got very efficient from 1900 to 1960 but we started to use the electricity in uses that aren’t efficient (mainly switching use to heat and cool buildings).
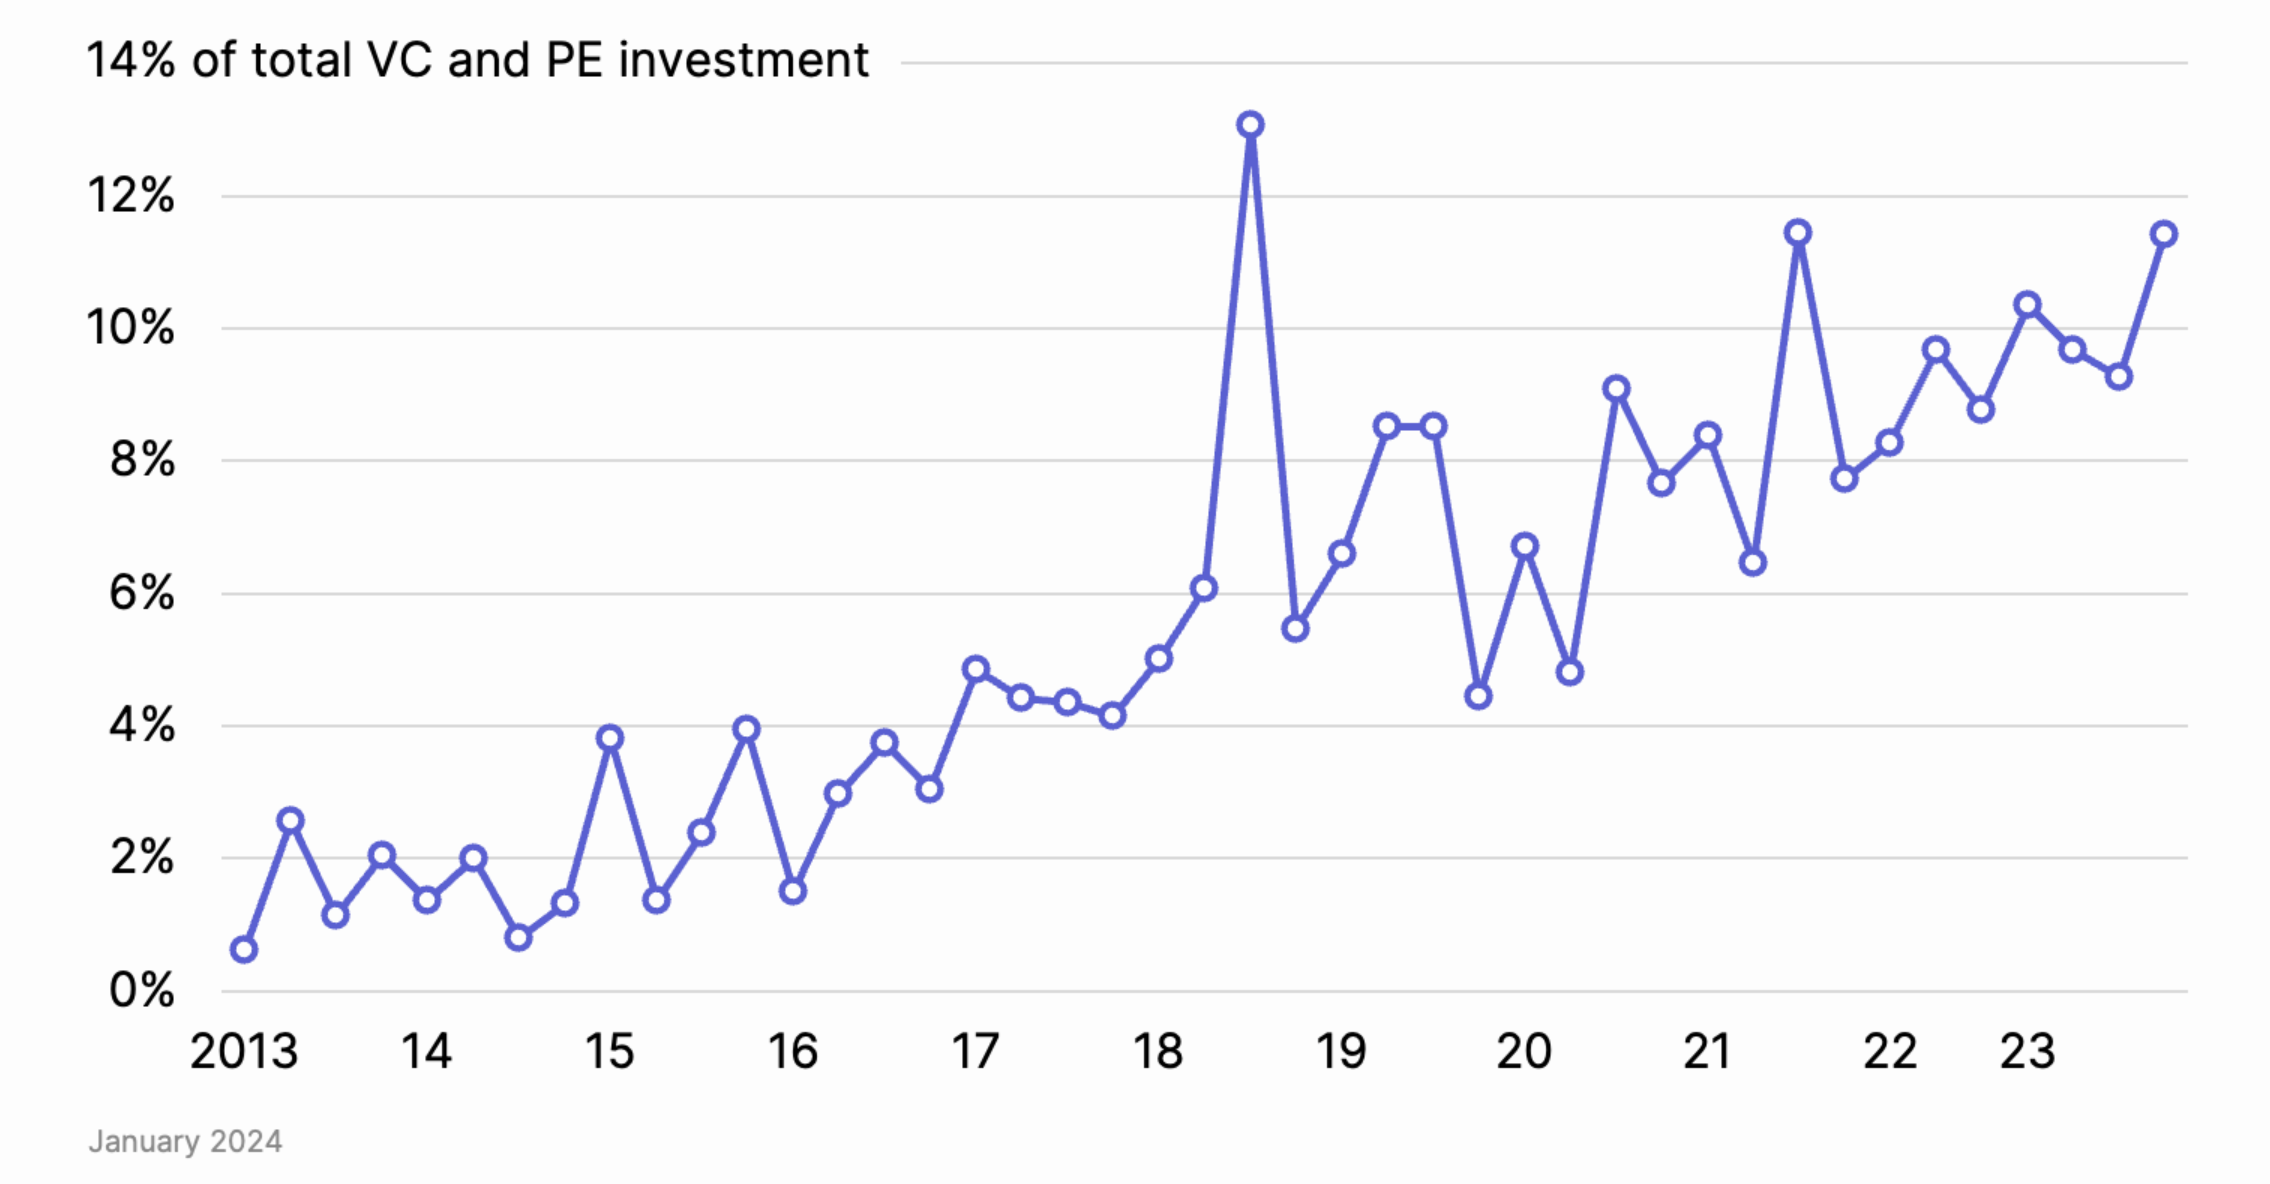
Imagine if foundations/grants would only pay for projects that had already succeeded at making an impact, leaving “venture” to take the risk on which projects actually would succeed by buying shares in them.
This idea, reverse engineering how capital markets operate, is discussed at length here in a very practical way.
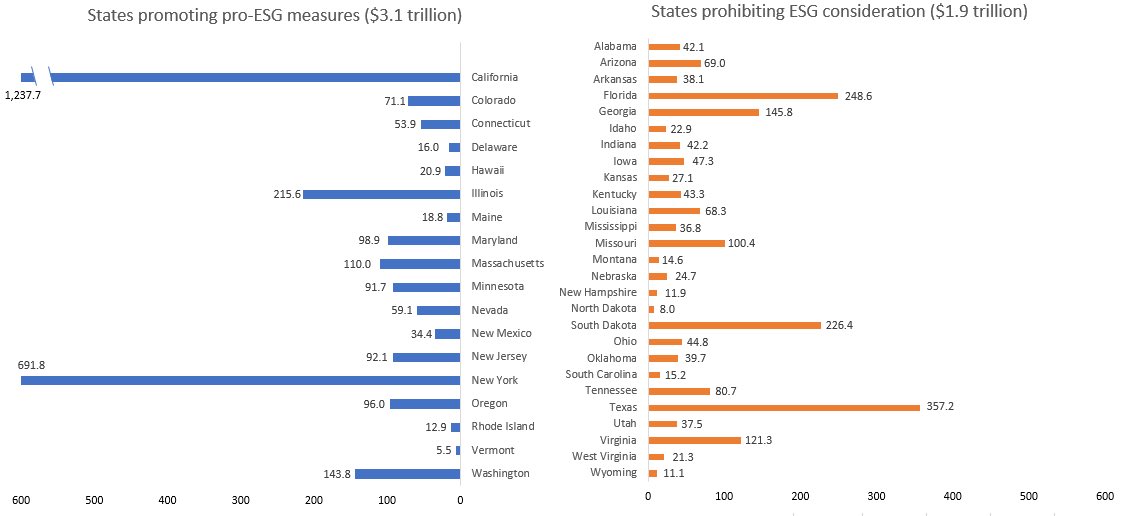
Charting the backlash against ESG across US states.
“As of January 2023, almost 50% of US states either have some type of anti-ESG restriction in place or have placed blacklisting ESG action high on their legislative agenda.“
“Analysis of these developments (111 in total as of 10 January 2023) reveals how at the state level, anti-ESG developments have rapidly outpaced those in support of ESG measures over the past three years.”
The chart on page 66 of the deck suggests that this backlash, at least as it materialized in ESG ETF flows, is mostly an American and Japanese phenomenon.
Original source here; chart from this excellent climate slide deck.
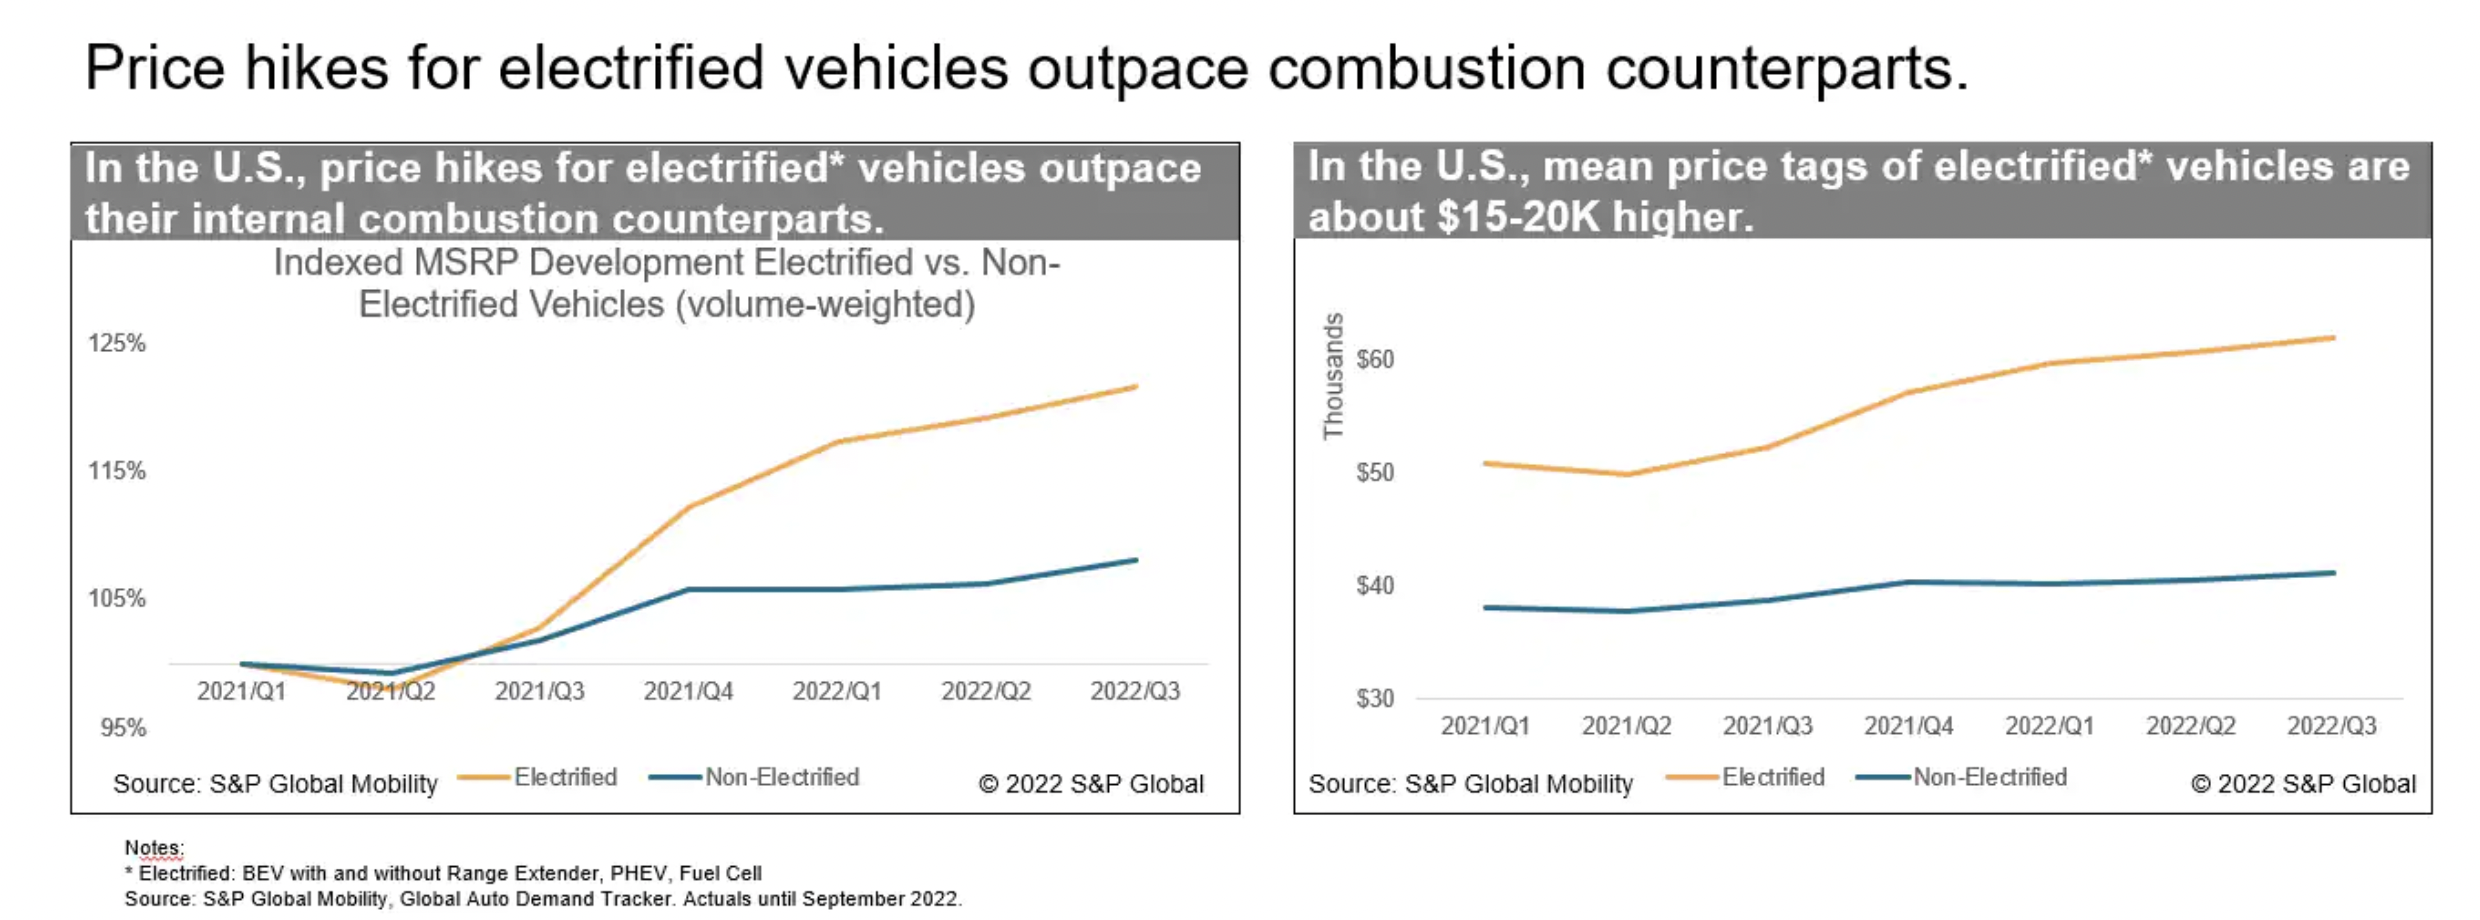
“Since about 2021-Q4, prices for electrified vehicles significantly outpaced their internal combustion counterparts, largely owing to battery material prices.“
These vehicles are “on average about $15-20K higher than their internal combustion counterparts.“
This is probably the opposite of what one expects to see for a new technology – but TCO considerations still drive most purchase decisions.
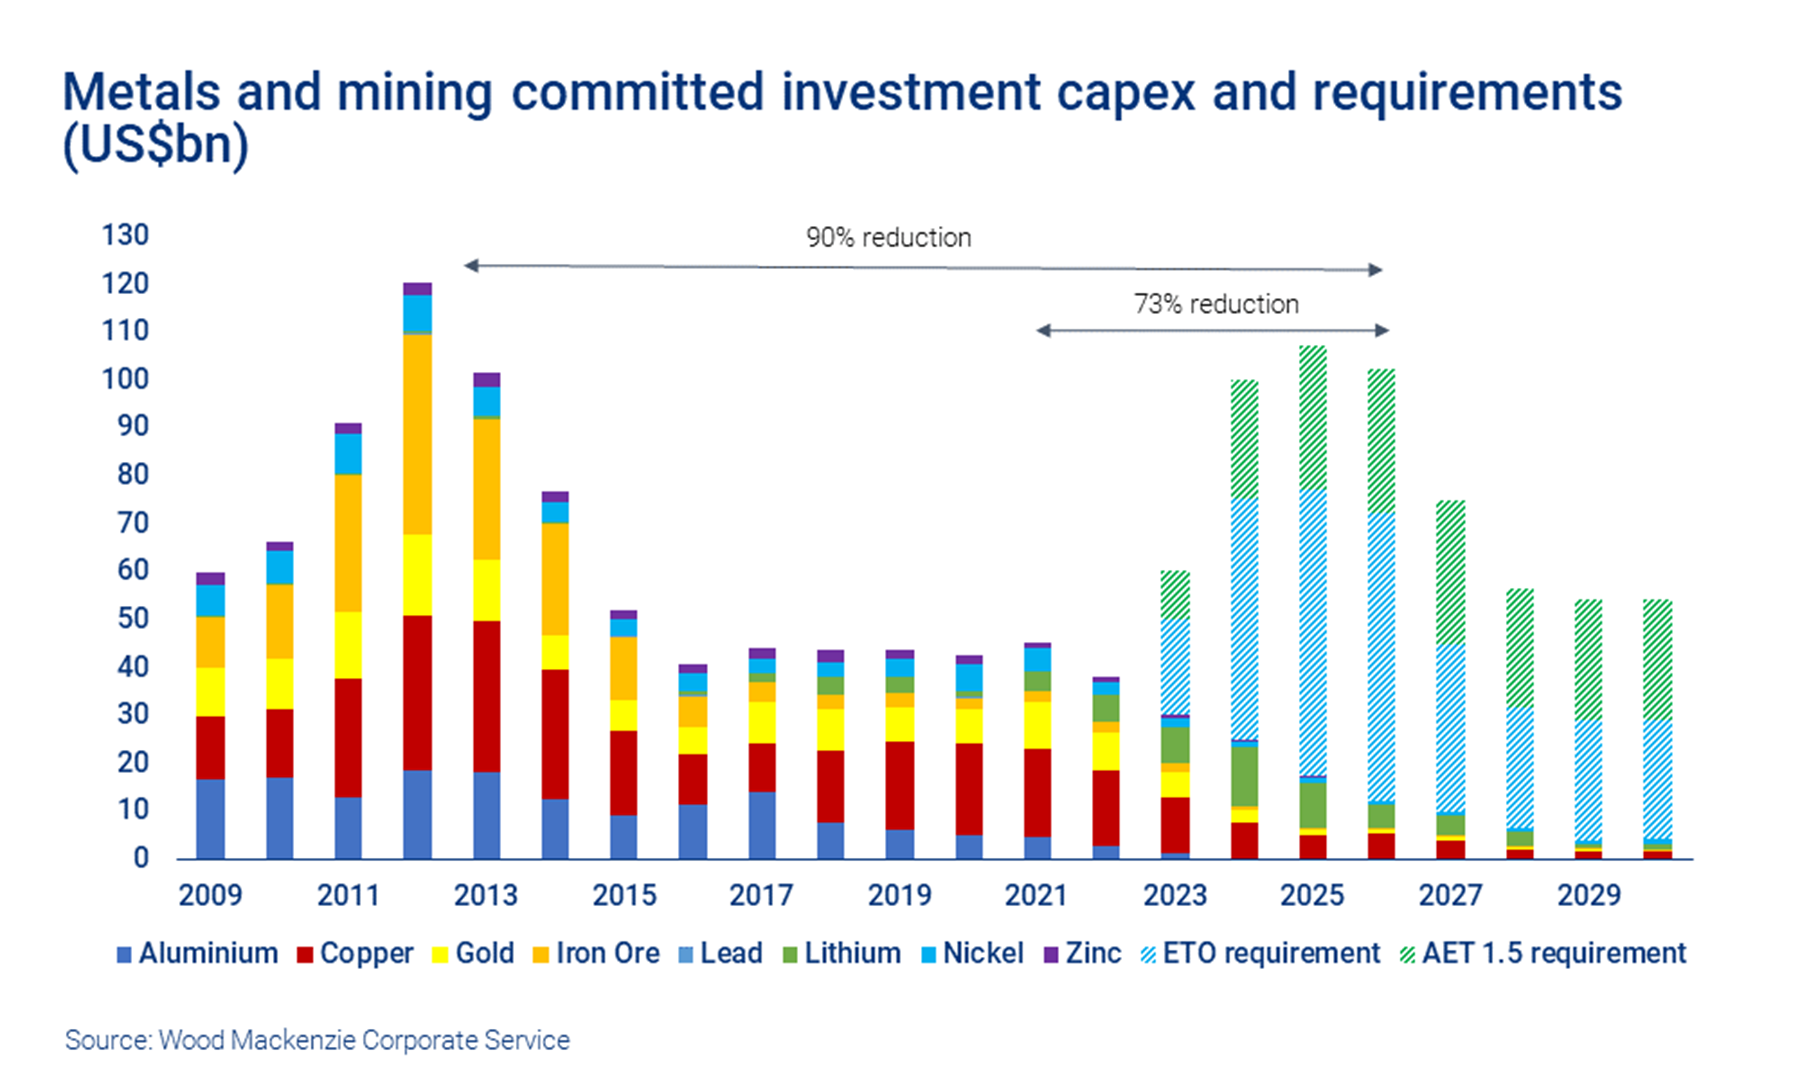
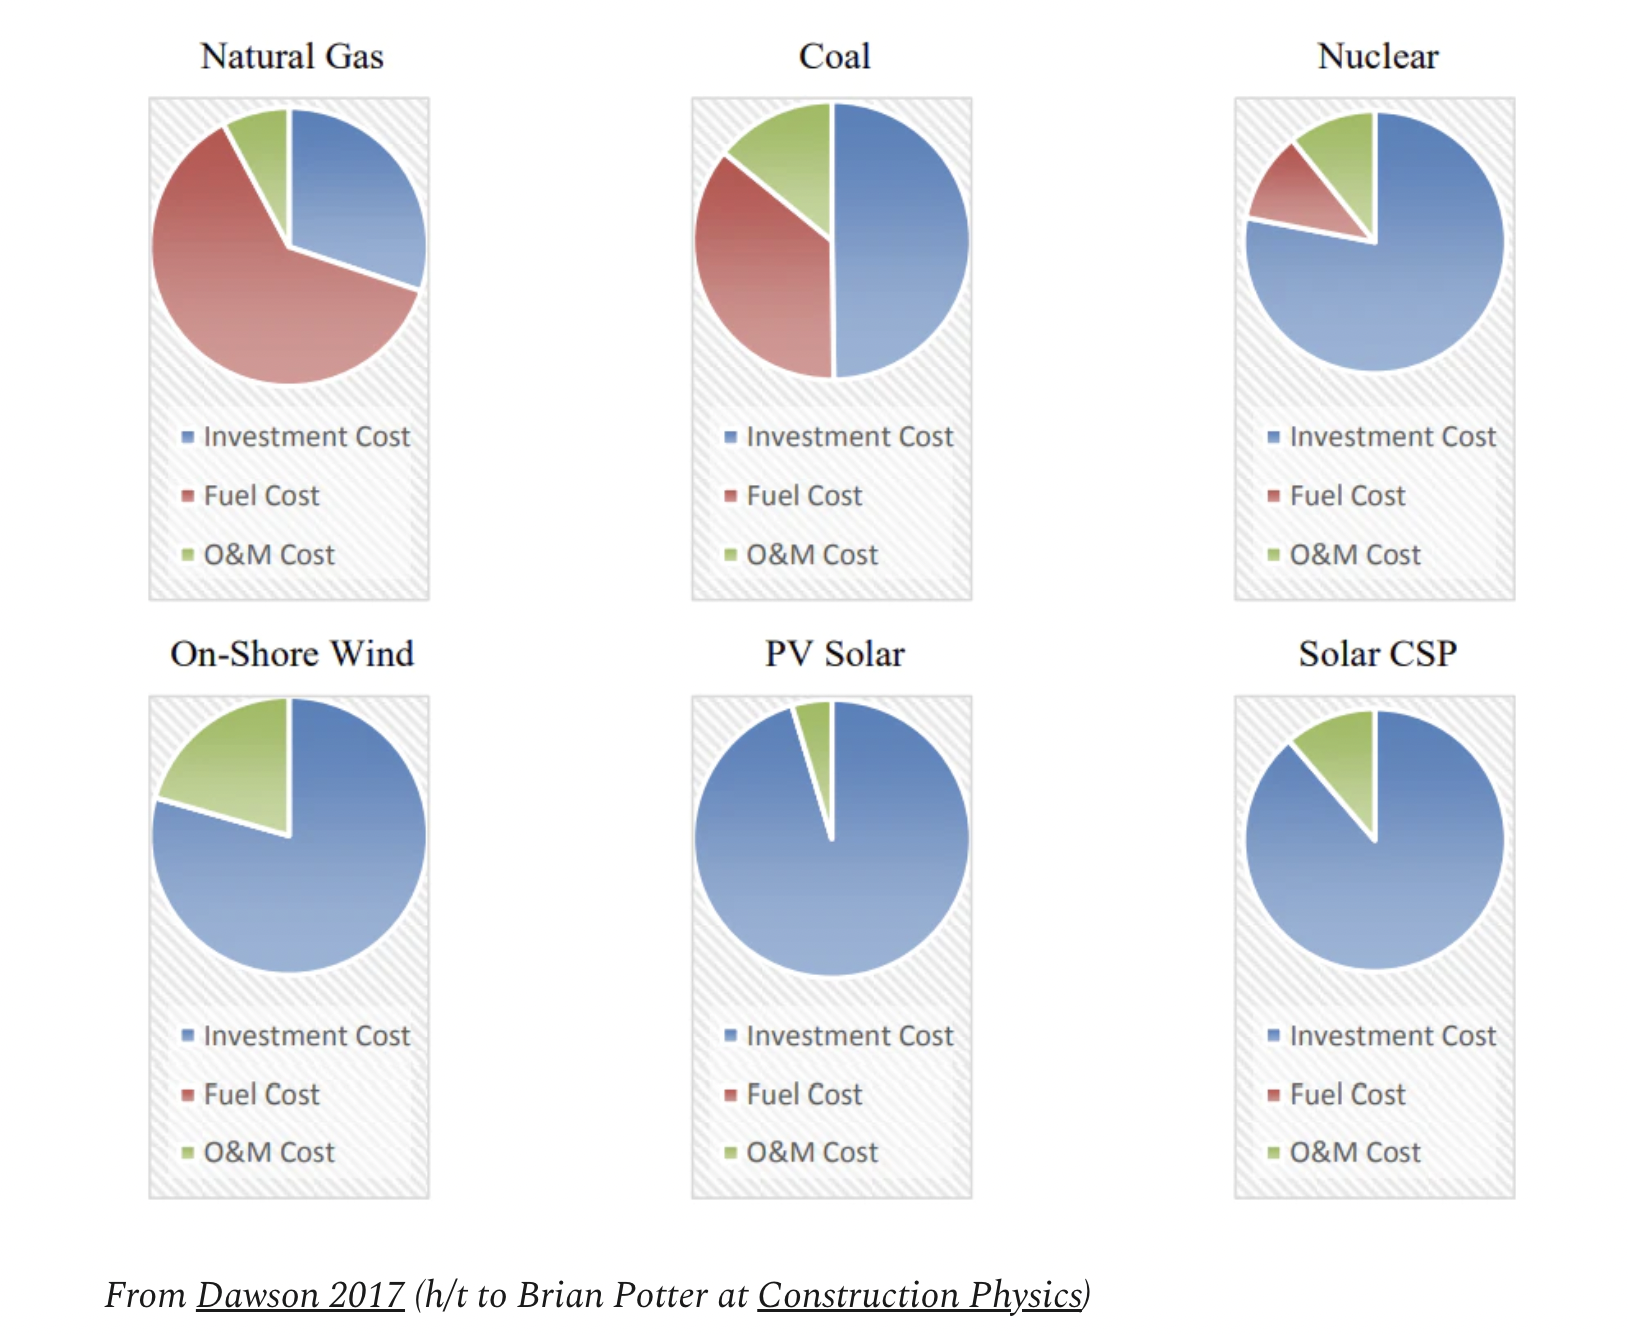
“Oversimplifying monstrously, clean energy technology requires big CapEx outlays today for low or next-to-no OpEx for decades.“
“This is why finance is so important to clean energy—it’s the way we teleport those future OpEx savings through time and space to cover those higher upfront costs.“
So argues this interesting article, exploring clean energy.
This chart summarises the idea nicely (excludes things like biomass which are an exception).
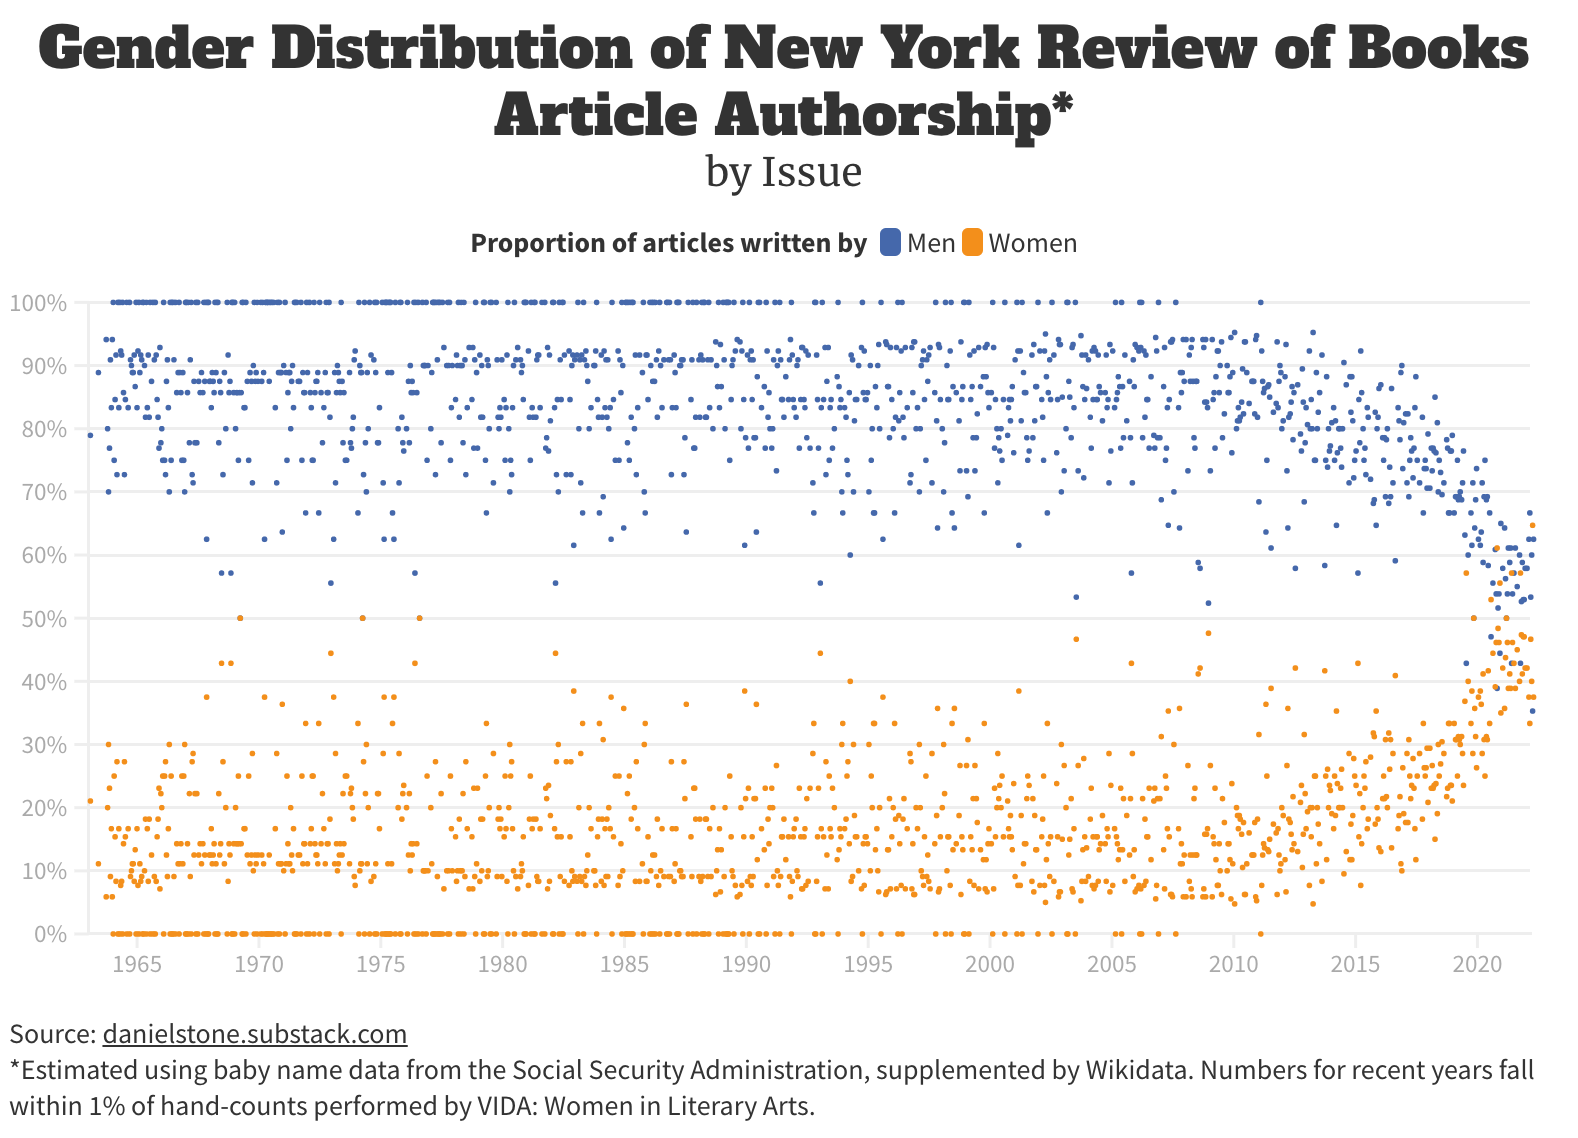
Interesting chart via The Browser (a must subscribe) plotting each issue of the New York Review of Books (NYRB) by the gender mix of authors.
“What you are seeing is that there are only twelve issues out of 1228 (1%) to which women have contributed half or more of the articles. Nine of them have appeared within the past three years. Meanwhile there are about 196 issues (16%) to which not a single woman contributed an article.”
Tyres are an order of magnitude worse source of particles pollution than exhausts.
“We came to a bewildering amount of material being released into the environment – 300,000 tonnes of tyre rubber in the UK and US, just from cars and vans every year.”
Whereas “Tailpipes are now so clean for pollutants that, if you were starting out afresh, you wouldn’t even bother regulating them.”
Listed tyre companies (GT, ML) are generally ranked low on ESG risk.
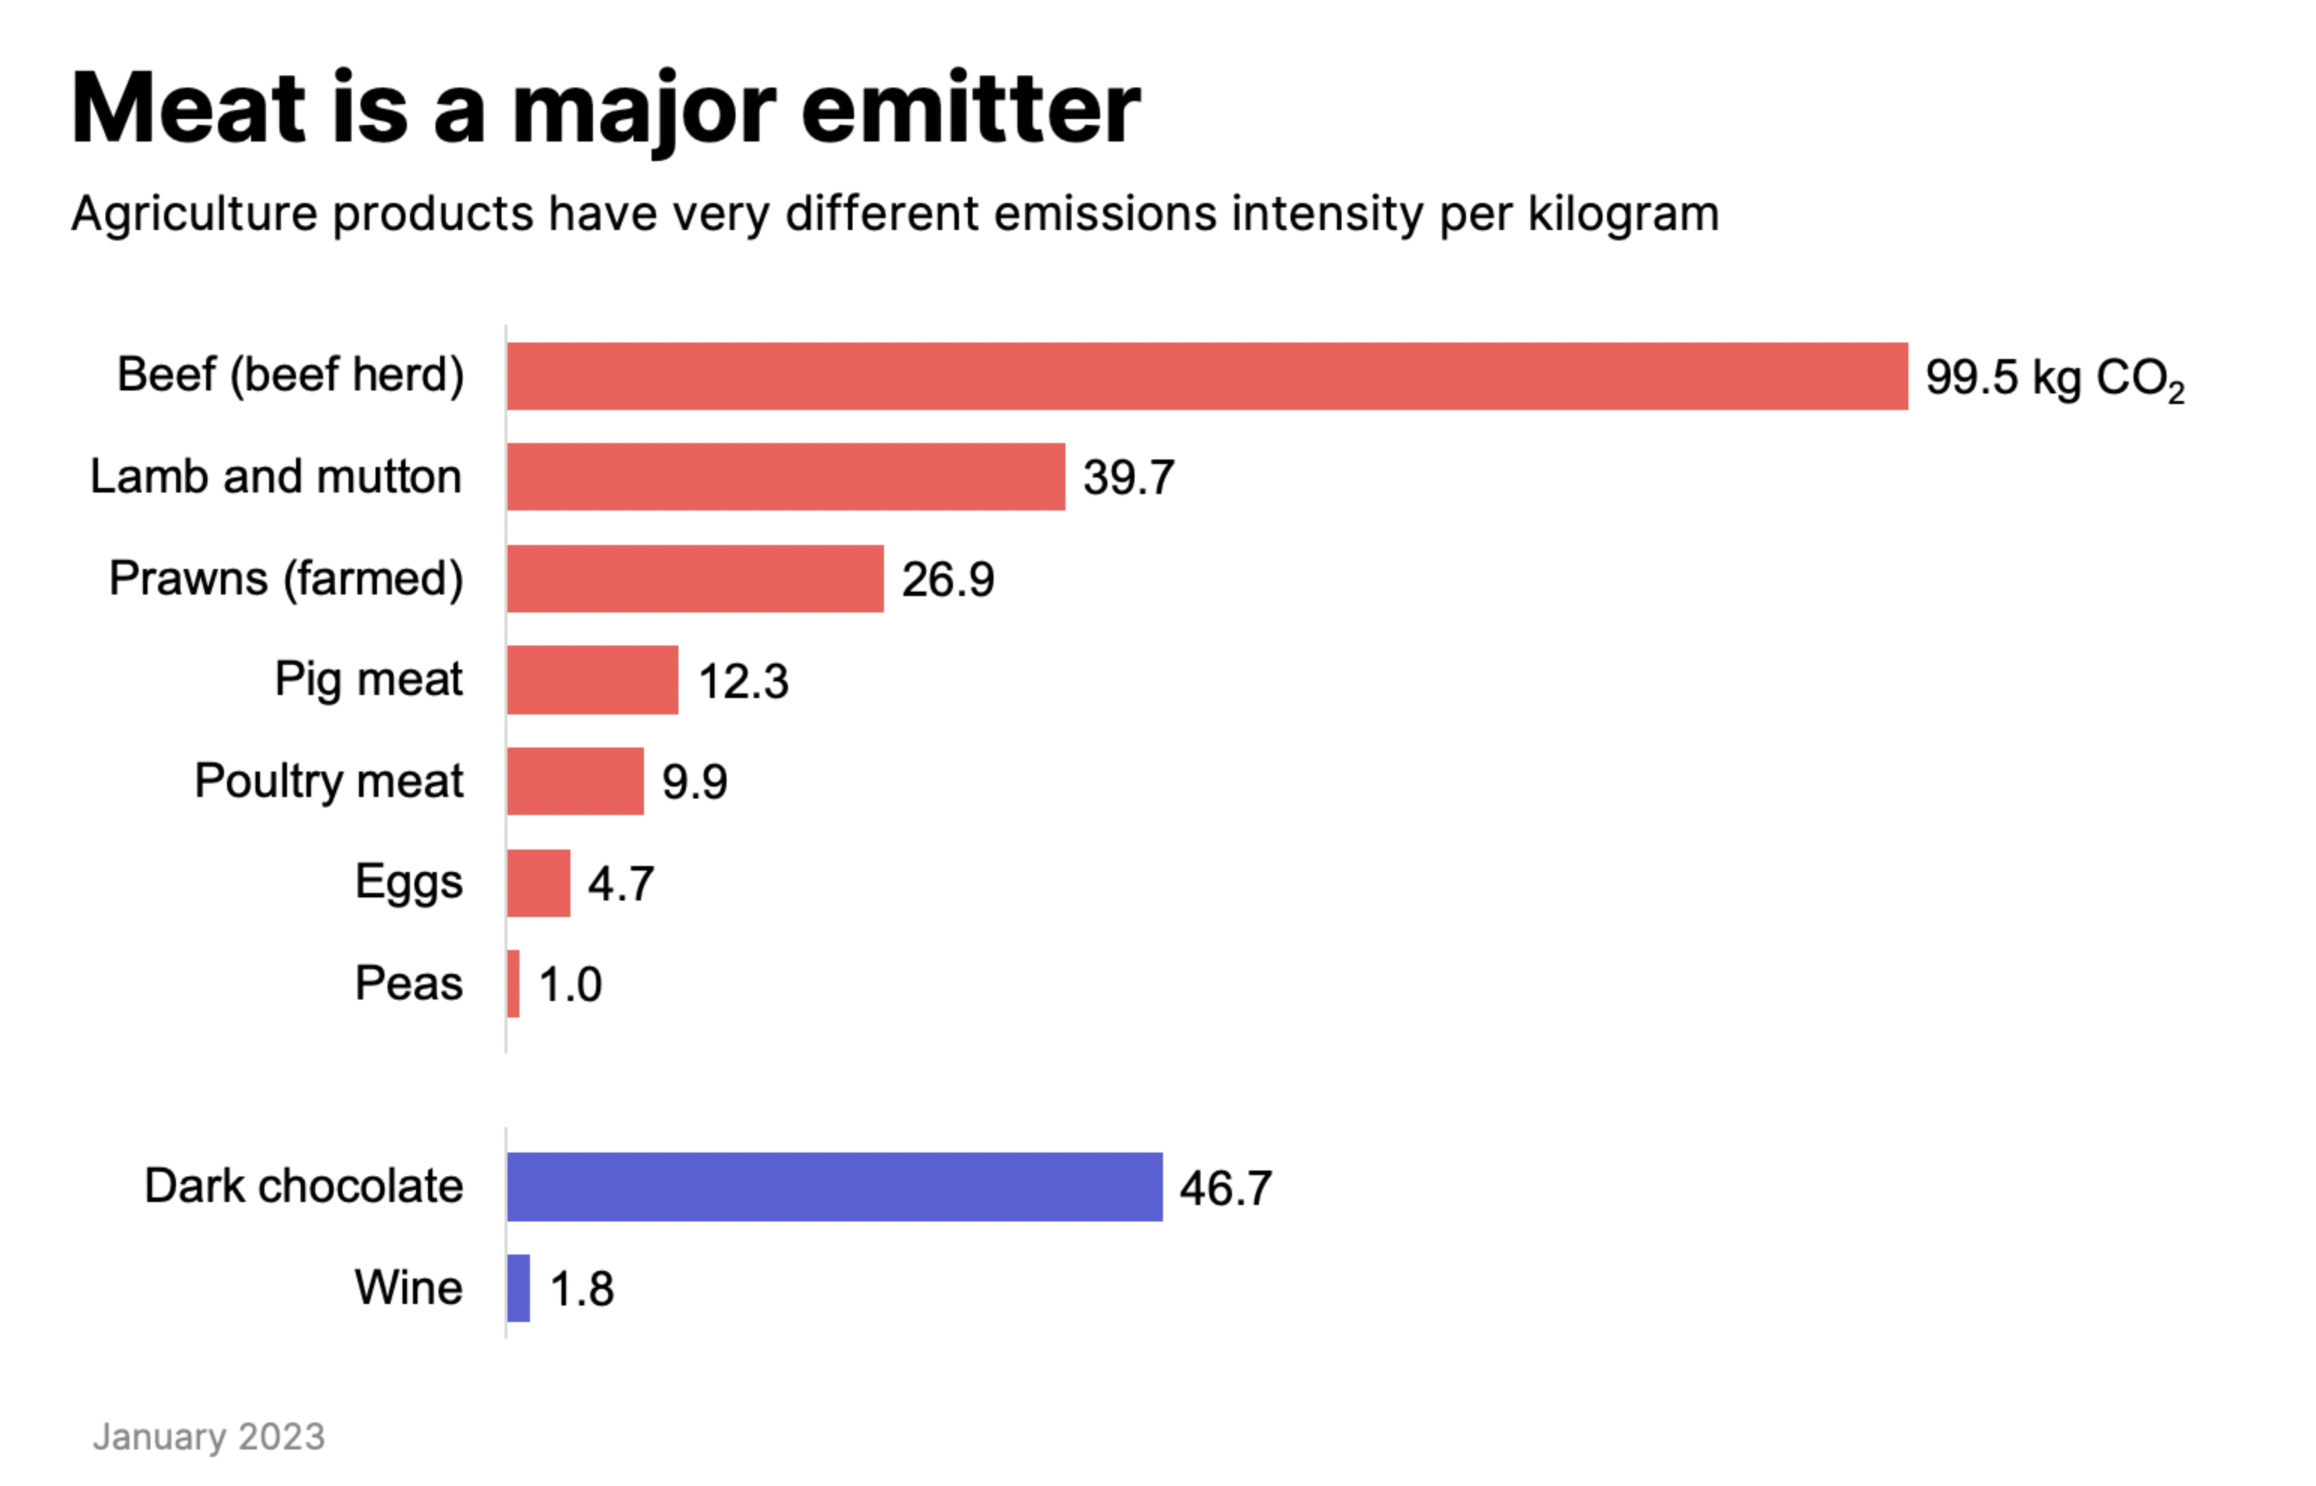
Chart below (from this paper) is a meta analysis of “globally reconciled and methodologically harmonized” data on the environmental impact (from GHG emissions to eutrophication) of 40 major foods.
What is interesting is the range – even the best meat farms still outweigh the worst grains.