- A great piece of analysis applying Helmer’s 7 powers to the content business in order to establish if content has ability to maintain profitability and resist competition.
- Scale is one such power – this chart shows there is a slight positive linear correlation between size of budget and eventual box office returns.
- Network effects are also interesting – given the social dynamics of shared experience and discussing content. Franchises really shine here.
Author: Snippet.Finance
Electronification
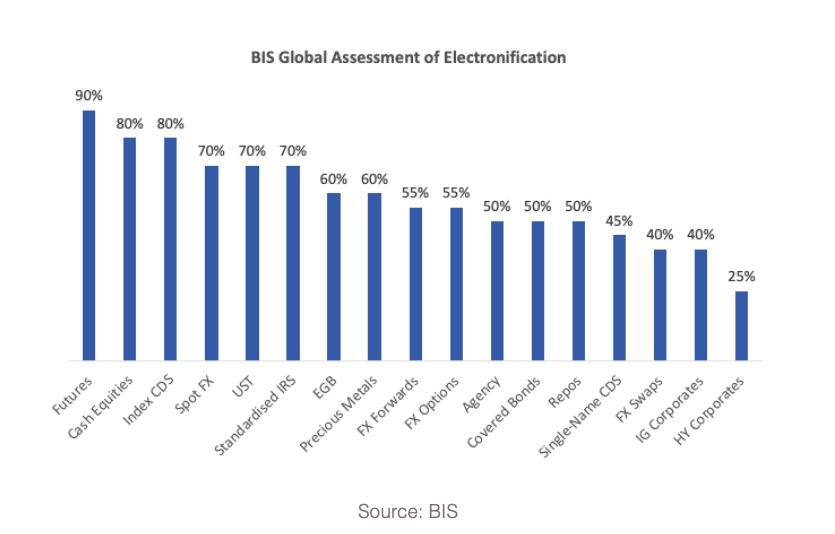
- Rather amazing to see that huge parts of many financial instruments are still not traded electronically, especially in the credit markets.
- From a brilliant post on the electronic trading business MarketAxess.
e-commerce Marketplaces
- A brilliant long read on the state of e-commerce marketplaces in 2020.
- Amazon marketplace, which “added eBay’s worth of sales to its GMV this year“, is a key topic.
- The nature of sellers there has evolved, including the new trend of capital raised to roll-up (i.e. acquire) sellers.
- The review also covers other winners like Walmart and Etsy.
Real Options and Valuation
- A fascinating read about the use of real options in valuation analysis by Mauboussin and Callahan.
- They argue it applies to a subset of companies – namely those with adept management, strong competitive position and high asset volatility.
- They also show why 2020 had characteristics (like decoupling of volatility and equity risk premium) that made this type of analysis more attractive.
Taiwan
- An investigation by Reuters suggests China is using “gray-zone” warfare to subdue Taiwan via military exhaustion.
- “The risk of conflict is now at its highest level in decades. PLA aircraft are flying menacingly towards airspace around Taiwan almost daily, sometimes launching multiple sorties on the same day. Since mid-September, Chinese warplanes have flown more than 100 of these missions, according to a Reuters compilation of flight data drawn from official statements by Taiwan’s Ministry of National Defense.”
- Something to watch carefully.
Banned Words
- We leverage the Snippet ecosystem to expand our footprint holistically in the space we operate. We have a long runway for our KPIs. After all it is a global and iconic brand.
- A fun list of banned corporate “words” from FundSmith.
Vanderbilt
- Business lessons from a man who at one point commanded one in every nine dollars in the United States.
- “Vanderbilt’s legacy provides timeless and universal lessons in business success. He thrived in an era of enormous technological change as railways revolutionised the American economy. Yet his approach to business is evident in many of the successful businesses we see today; tapping new markets through lower prices, respecting shareholders, sharing scale advantages and sacrificing short term profits for long term gains.“
JPM Outlook 2021
- Good outlook piece by JPM Asset Management.
- Some amazing stats on the state of US federal finance – debt levels are about to hit World War II peaks (as % of GDP), and the projected 2020 deficit (at 16% of GDP) is the largest since 1945.
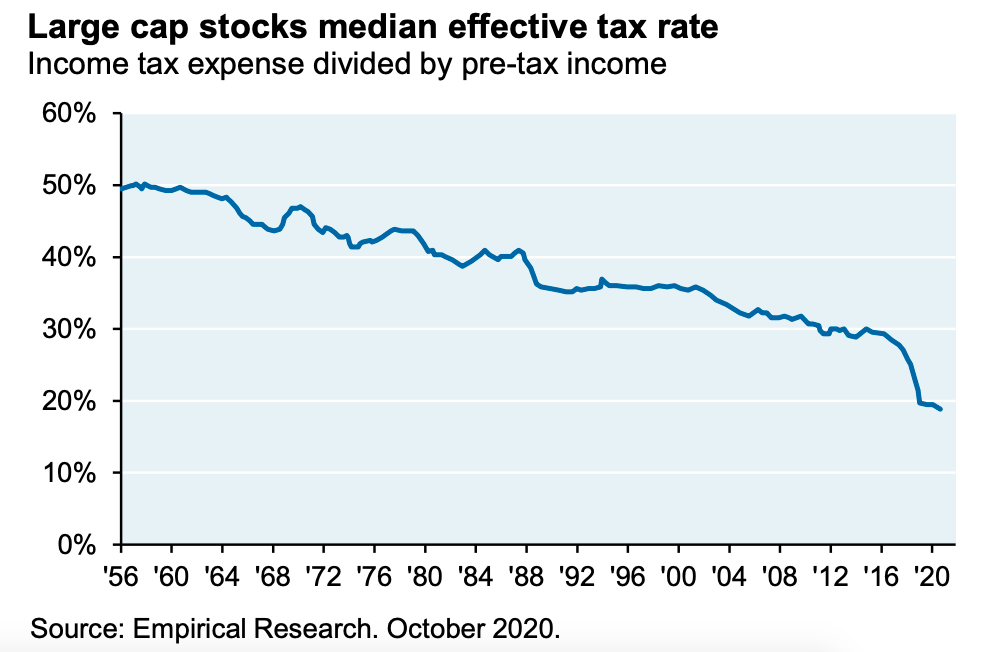
- This interesting chart shows the fall in the corporate effective tax rate for large cap stocks over the years.
- Under Biden’s plan – which will raise $2.2trn by raising and broadening corporate taxes (vs. $700bn Trump corporate tax cuts) – this trend could reverse (costing 10% of S&P EPS).
- Lots of other interesting observations inside.
Signal From Noise
- As the new year starts many, myself included, look to start forming new habits.
- As the third instalment of the Snippet Blog I felt it would be useful to give a few tips on how to make sense of the world and separate signal from noise.
Signal from Noise
How does one find valuable signal in the endless sea of pixels on the screen? What follows are a few tips from a year of curating Snippet Finance and more than a decade in financial markets. Relevant not just to investors but to anyone trying to make sense of the world.
(1) Curation
Good curation is important. Find people, not robots or algorithms, that possess the twin attributes of curiosity and experience and let them lead your exploration. FT Alpaville in finance, Benedict Evans and Stratechary in Media and Tech, and Farnam Street and The Browser in the crucial category of “everything else”.
(2) Skimming
Acquire the ability, through practice, to intelligently scan information. Like the investor searching for ideas or the scientist coming up with a hypothesis, it is often best to rely on the subconscious mind to let information wash over you. A good place to start is the section on skimming in this excellent guide on reading.
(3) Only a few things
Only a few things are worth reading carefully. This scene from Short Circuit 2 where Johnny 5 discovers a bookstore sums this up beautifully. Use an app like Pocket to save down those precious long reads. Change your physical environment and sit down to read.
(4) Finishing is for losers
It’s ok not to finish a book. As Naval Ravikant, Angel List founder said “We’re taught from a young age that books are something you finish. Books are sacred. When you go to school and you’re assigned to read a book, you have to finish the book. So…we get this contradiction where everyone I know is stuck on some book. So what do you do? You give up on reading books for a while. That, for me, was a tragedy because I grew up on books, and then I switched to blogs, and then I switched to Twitter and Facebook. And then I realized I wasn’t actually learning anything. I was just taking little dopamine snacks all day long …. [So] I came up with this hack where I started treating books as throwaway blog posts or as bite-sized Tweets or Facebook posts, and I felt no obligation to finish any book … I’m reading somewhere between ten and twenty books. I’m flipping through them.” [1]
(5) Hupomnemata
Write things down in a notebook. Michel Foucault in his writing on Ethics [2] talks about the hupomnemata, a journal concept from the Ancient Greeks. It is written in order “to capture the already said, to collect what one has managed to hear or read, and for a purpose that is nothing less than the shaping of the self”. It is not meant to be “a detached documentary” but rather “the hupomnemata makes the writer just as surely as the writer makes the hupomnemata” [3].
(6) Repetition
Re-read, as Foucault continues, “from time to time so as to reactualise“[2]. Try to use methods like spaced active repetition so that each repetition leads to efficient retention.
(7) Tell others in order to clarify your own thought
Explain your ideas to someone, ideally someone with no prior knowledge. Here the famous Feynman Technique comes to mind. As America’s greatest thinker Charles Sanders Peirce put it “The very first lesson that we have a right to demand that logic shall teach us is, how to make our ideas clear … To know what we think, to be masters of our own meaning, will make a solid foundation for great and weighty thought.“
(8) Be just the right amount of sceptical
“It makes me nervous when someone believes too deeply or too much. I think that being skeptical and questioning all deeply held beliefs is essential. Of course we must know the difference between skepticism and cynicism because cynicism is as much a restriction of one’s openness to the world as passionate belief is. They are sort of twins.” [4]
(9) Read widely
“Don’t just read in business or finance. Expand the scope into new domains or fields. Follow your curiosity. It is hard to know when an idea from an apparently disparate field may come in handy” Mauboussin [5]
Home Fitness Shift
Scientific Publishing
Amazon as a Risk Factor
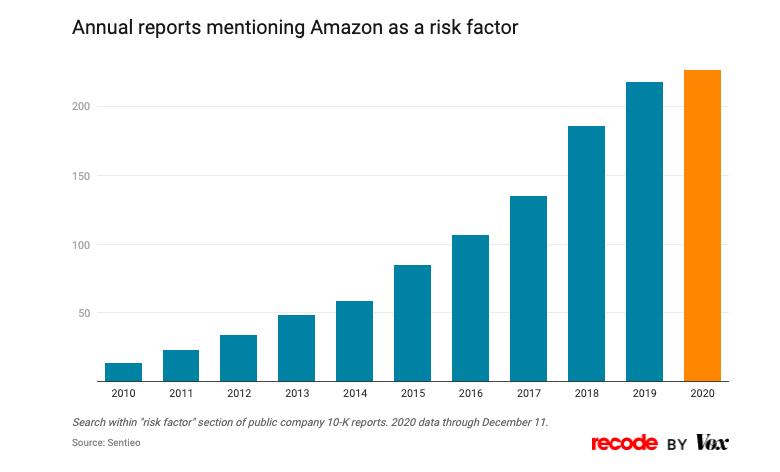
- Interesting chart showing number of annual reports that mention Amazon as a risk factor.
Fedex ShopRunner
- Interesting acquisition by Fedex buying the ShopRunner platform – vertically integrating forward.
- Sign of more to come?
US Saudi Oil Imports
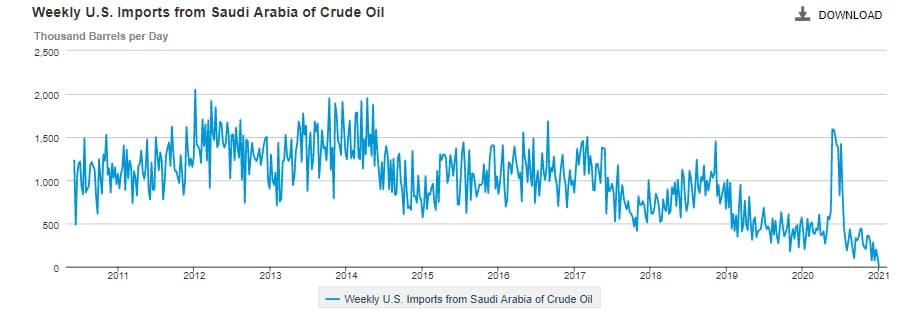
- For the first time in 35 years, no oil flowed from Saudi Arabia to the United States last week, according to EIA data.
Corporate Climate Goals
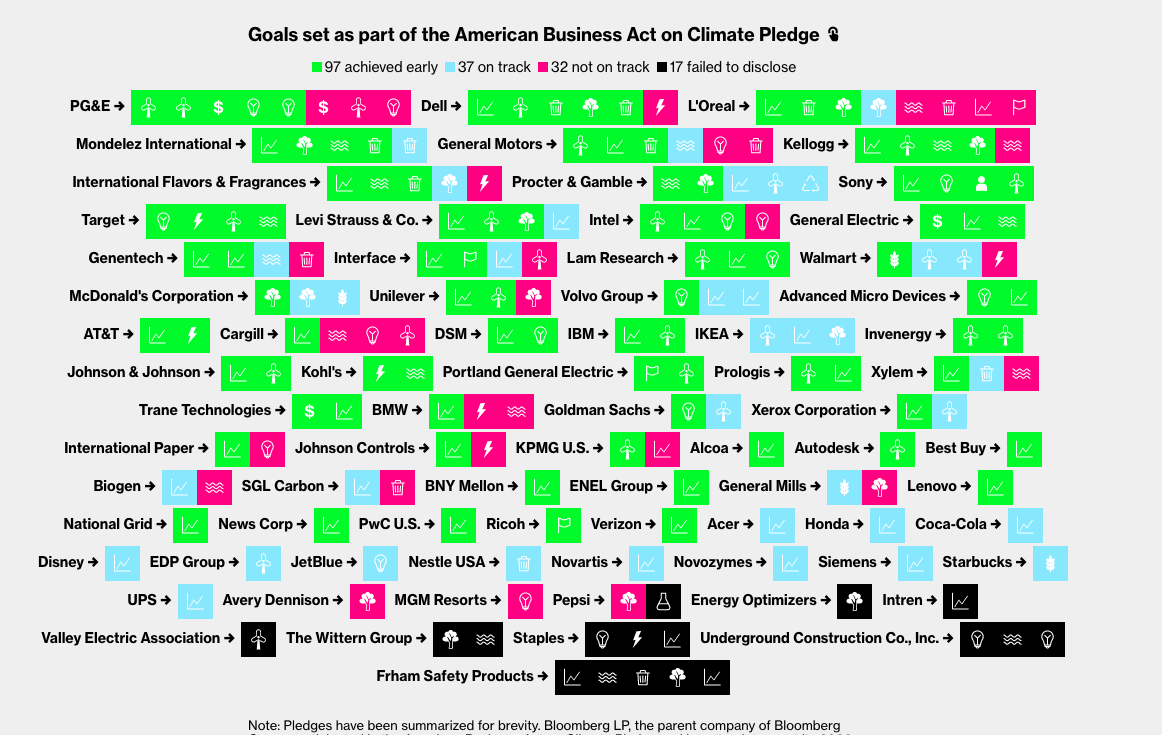
- Bloomberg analysed how well companies fared against their 2020 climate goals (set in 2015).
- “The good news is that most of these pledges—138, so far—have already been met or appear on track by year-end, in part because many companies set modest goals.“
- Worryingly, data disclosure remains a big issue as many companies either don’t report or do so unevenly.
- Looking forward many are now making stand out statements.
- Microsoft has not just committed to going carbon negative (by 2030) they will, by 2050, remove from the environment all the carbon the company has emitted either directly or by electrical consumption since it was founded in 1975.
Churn Rates
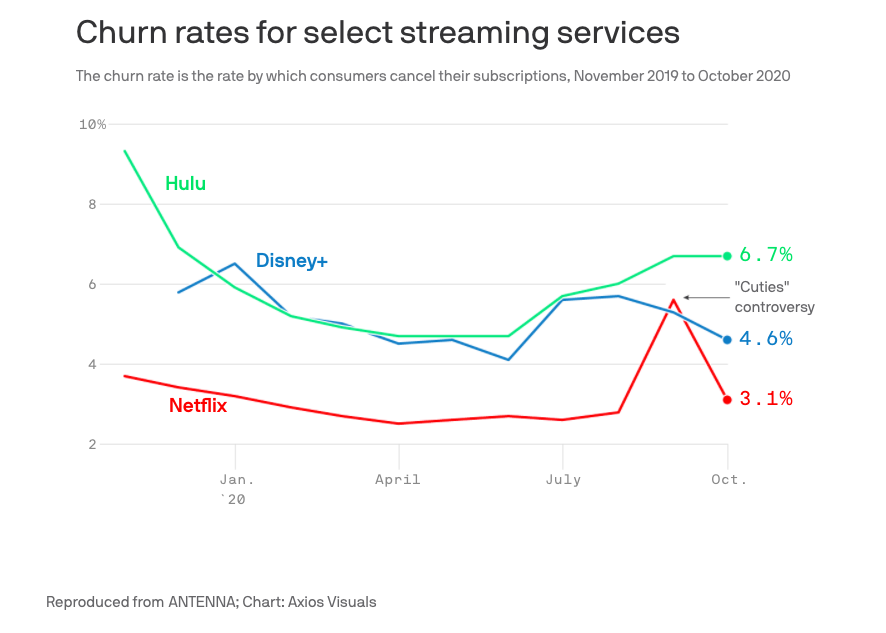
- A key variable to the life time value of streaming businesses is churn rate.
- This interesting chart shows the churn rate of NFLX vs. Disney services.
- There is a lot of room for improvement in the latter.
Vaccine Doubters
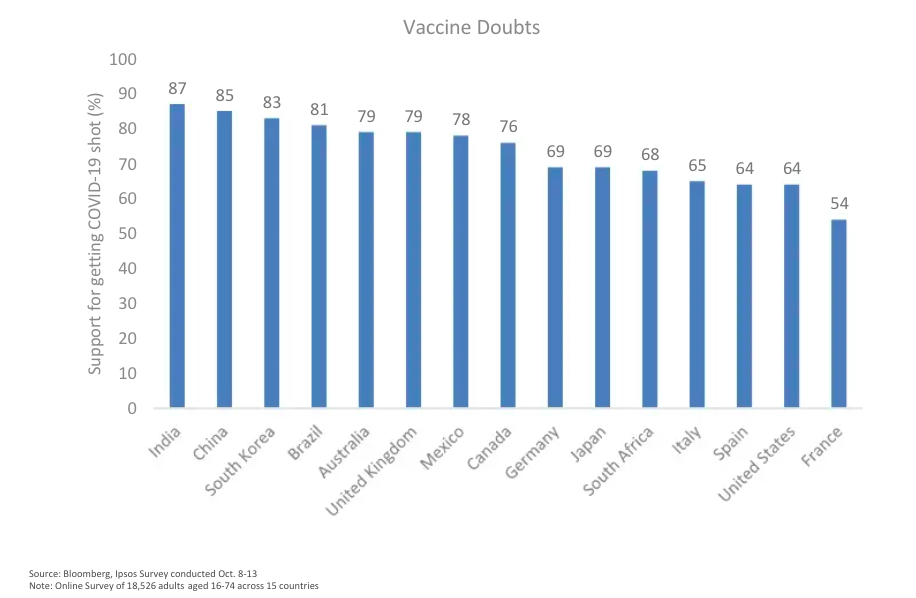
- Intriguing to see how support for the Covid-19 vaccine varies by country.
ARKK
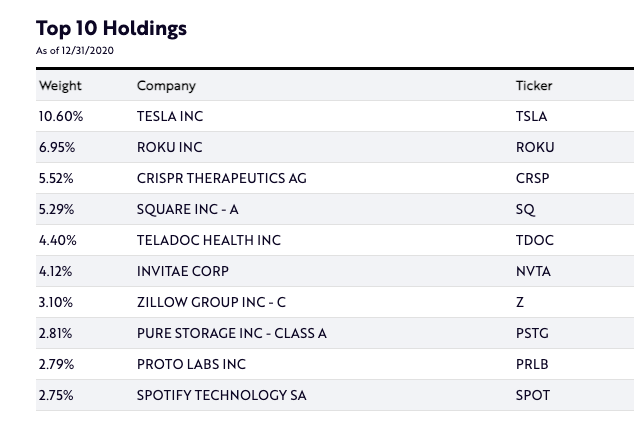
- ARKK is the ETF that represents the latest rally.
- It is seeing a lot of flows and discussion.
- This table shows the top 10 holdings as of 31/12/2020.
- Always worth knowing the composition of ETFs that are seeing strongest flows.
World Trade
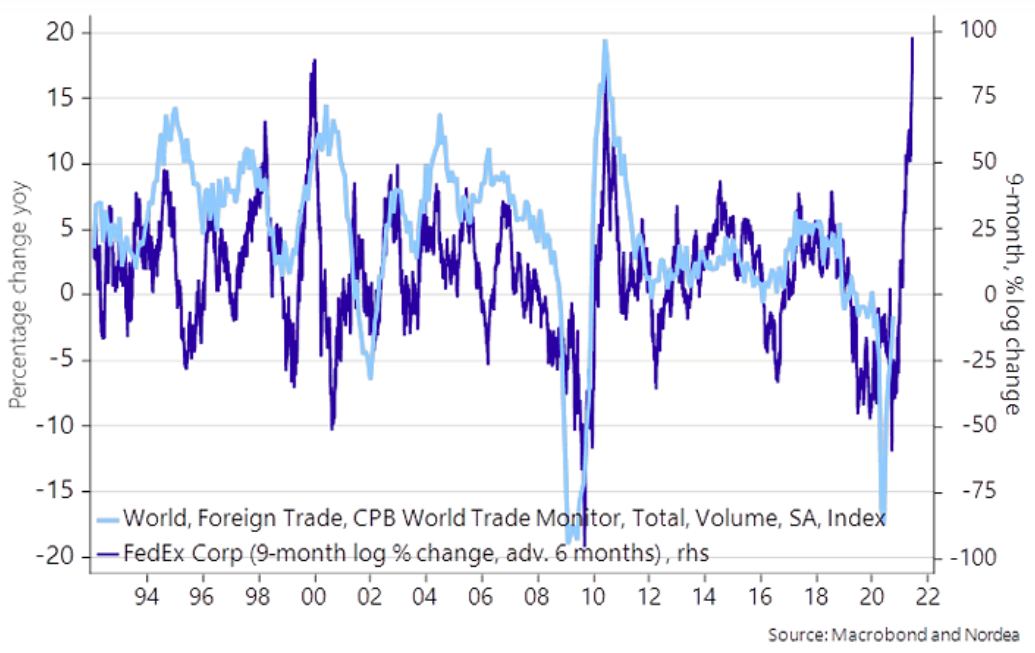
- Fedex share price suggesting (with a six month lead) that world trade should start to improve.


