The number of publicly listed companies in the US has fallen since the mid-1990s.
This chart captures this decline in the total number of listed stocks, including additions and subtractions each year from 1976 to 2019.
“There are one-half as many public companies as there were in 1996 and three-quarters as many as there were in 1976. The Wilshire 5000 Total Market Index, launched in 1974 to reflect the complete U.S. equity market, had 3,473 stocks as of December 31, 2019.”
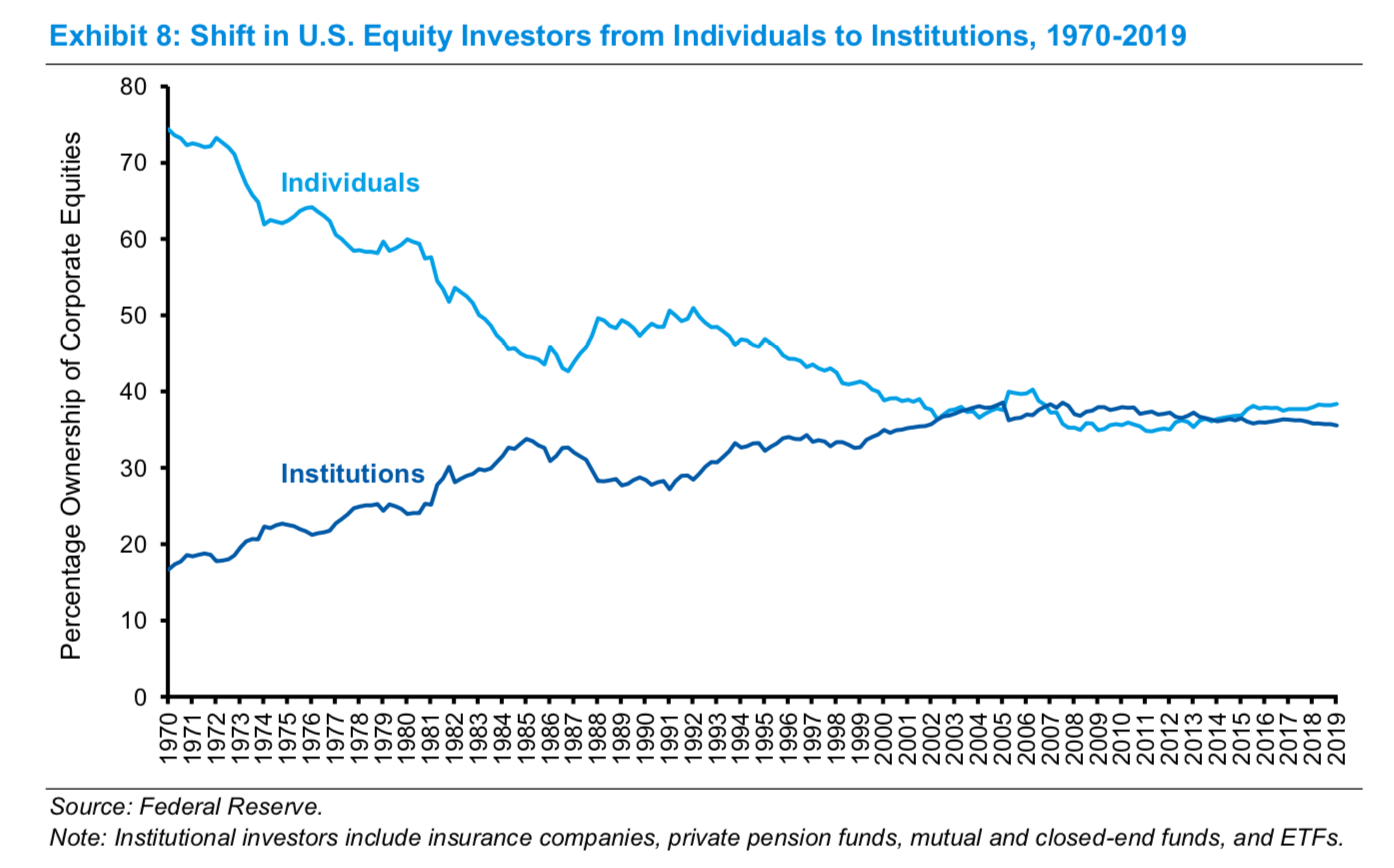
“Over the past quarter century there has been a marked shift in U.S. equities from public markets to private markets controlled by buyout and venture capital firms. This change has had reverberations for asset managers, investors, executives, and policy makers.“
A really insightful and bearish essay on Nintendo.
“However, the “Nintendo is Disney” thesis is deeply flawed. It feels more like a desire to apply a pattern than to find a real analogue. Elements of Nintendo certainly represent Disney, but they represent Disney insofar as both companies are best in class creators of four-quadrant, multi-generational content. Otherwise the businesses are fundamentally different, their management styles fundamentally different, and their approaches to content itself are fundamentally different, too.”
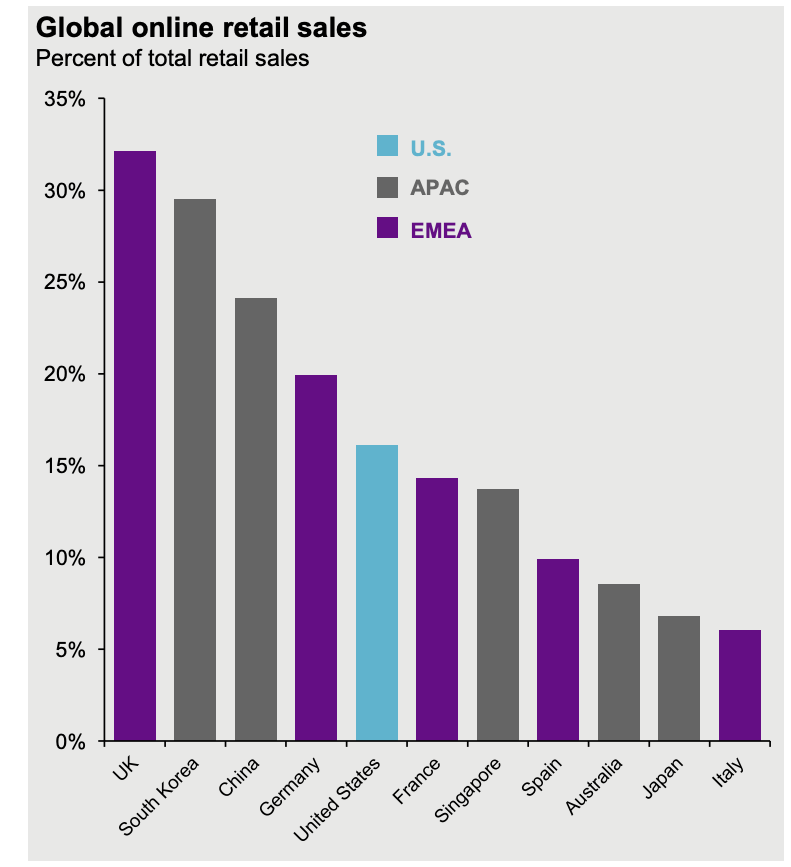
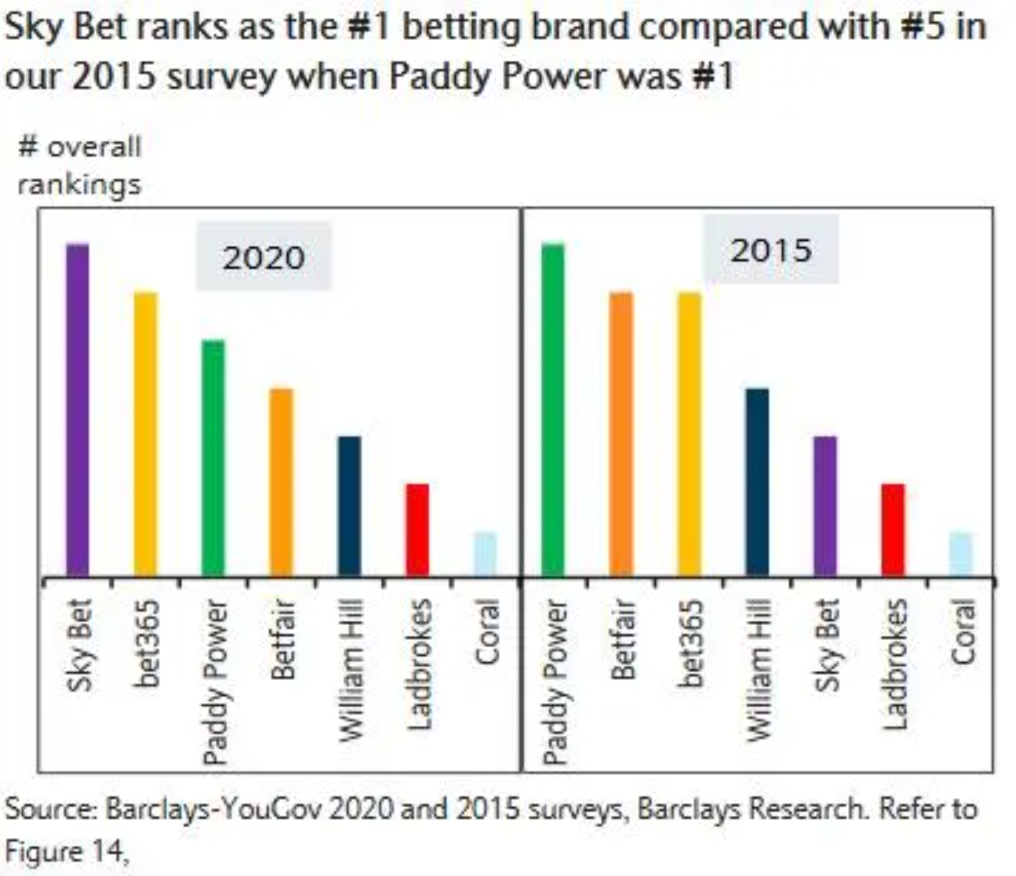
Their rise had a lot to do with a huge advertising campaign in the US
This stat is staggering – for a period in 2018 “nearly 22% of all ads seen by U.S. Apple device users on Facebook ad network came from TikTok and its Chinese counterpart Douyin”
As the article points out this actually provides more evidence of Facebooks dominance.
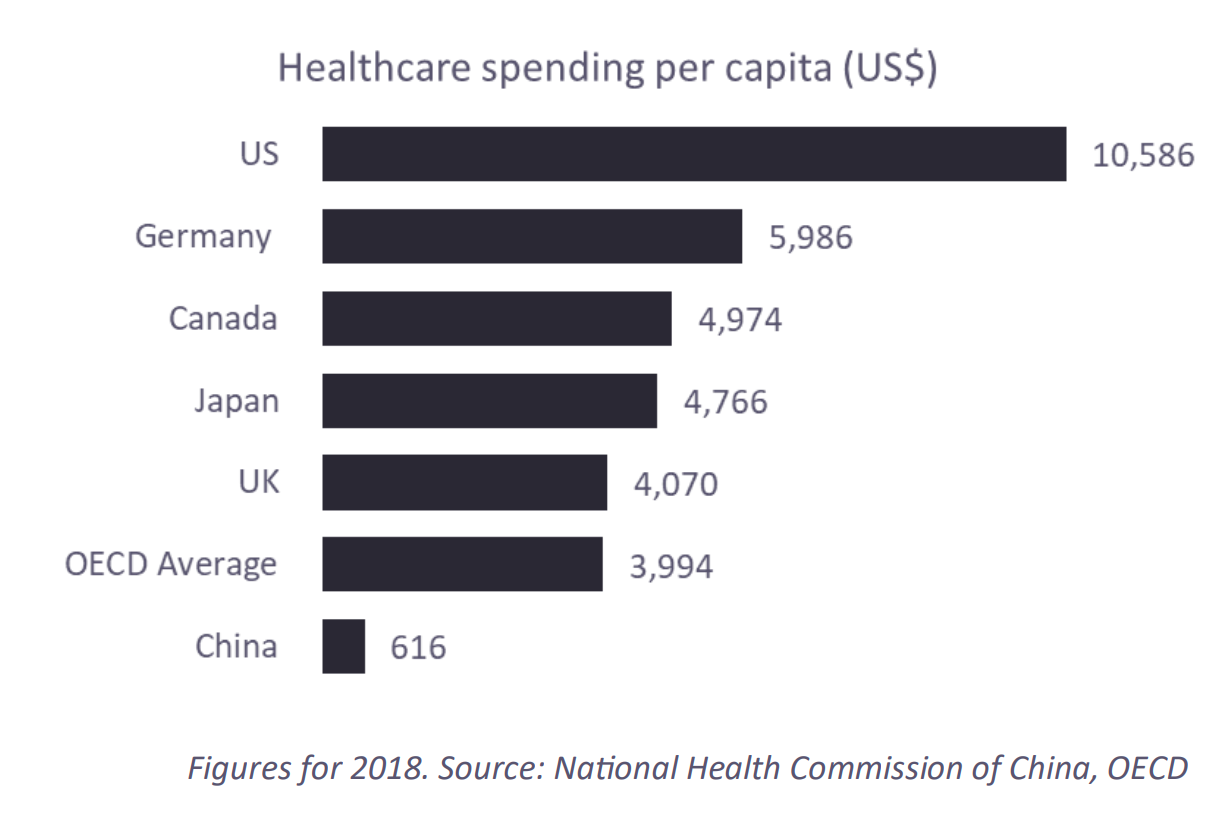
“To say that healthcare in China is a growth story is an understatement: despite the country’s per capita spending growing at 16% p.a. over the past 18 years, it is still only 1/7th that of the UK and1/17th that of the US.“
“Consider the country’s changing demographics: in 1970, the median age was 19 years; today that figure is 38, and by 2040 it is projected to be 47.“
“As people age, they tend to experience more ailments, which require more (and costlier) treatments: according to Bernstein, Americans aged 25 or younger use five prescriptions per year, while those aged 65 or older use a whopping 46 scripts!“
“The resources are not simply about investing. It is about becoming a better human being. Learning from the success and failure of others is the fastest way to get smarter and wiser without a lot of pain.”
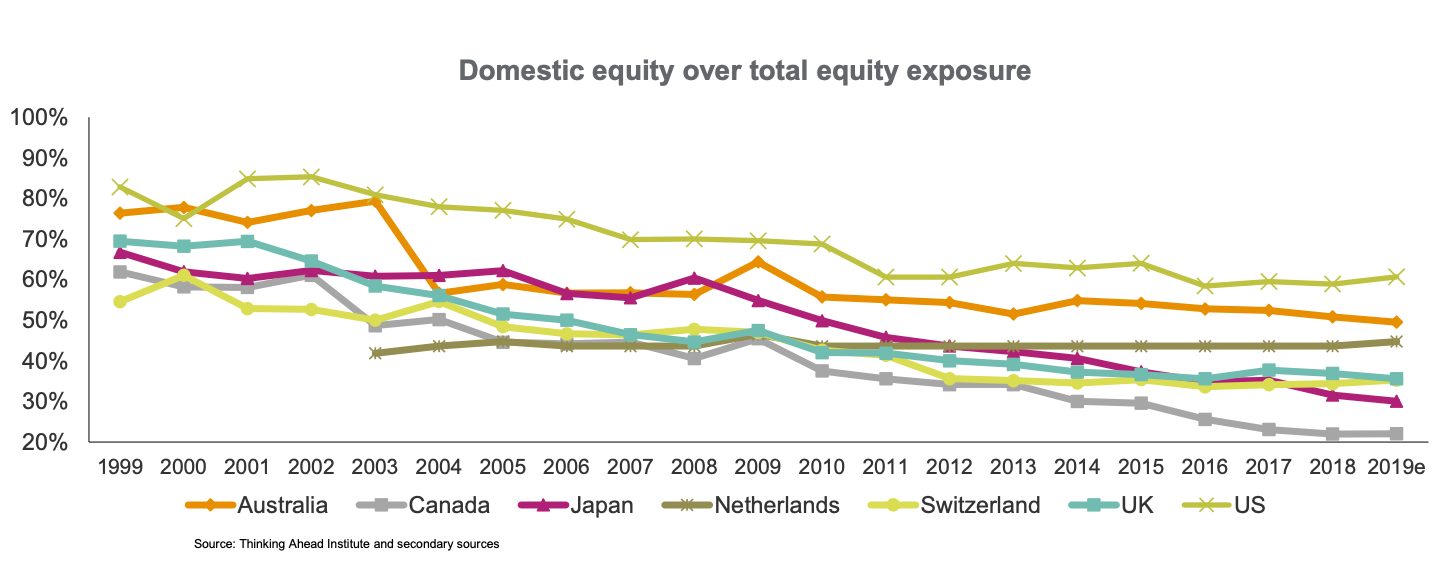
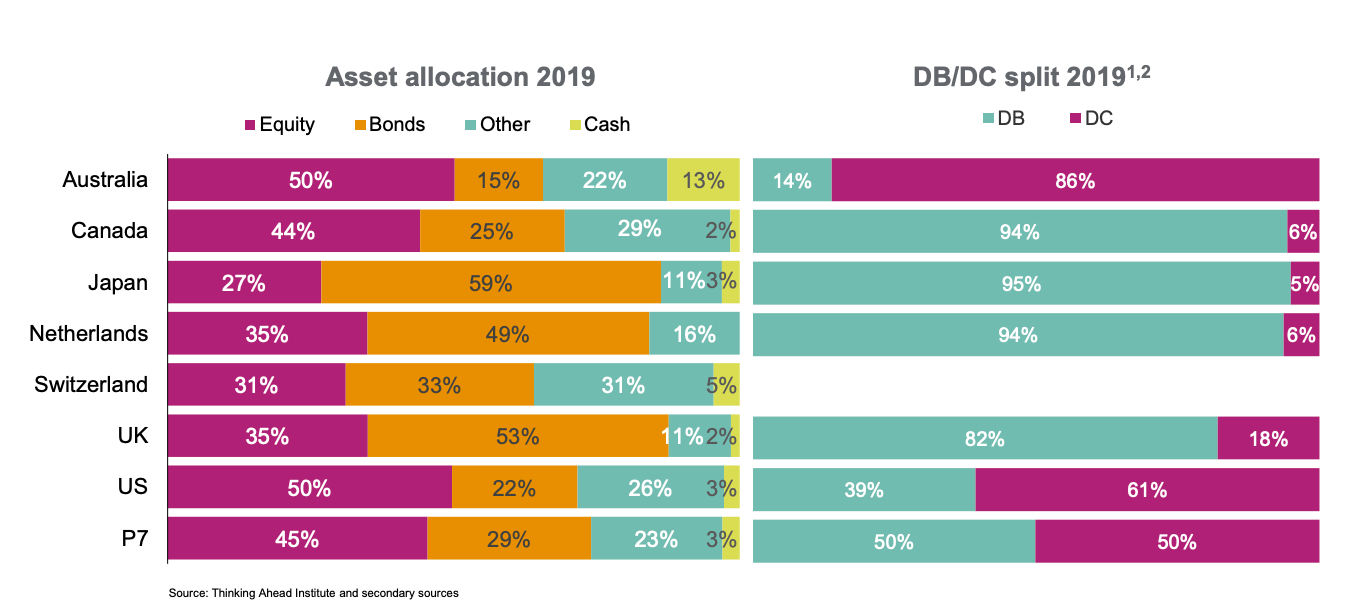
For Pensions – “There is a clear sign of a reduced home bias in equities, as the weight of domestic equities has fallen, on average, from 68.6% in 1999 to 39.7% in 2019.”
Interesting chart showing the asset allocation of pension fund assets and the split between defined contribution and defined benefit in different countries.
The UK really stands out.
For the top 7 countries (P7) the allocation to equities has been reduced dramatically in favour of “other assets” since 1999.
Defined contribution has also crossed 50% for the first time last year.
“Some banks trade at valuations equal to (or less than) their surplus capital, implying that the banks themselves—including their interest-rate-resilient wealth management divisions, trading and operations segments, and automobile and mortgage lending businesses—are free.“
A great podcast on how container shipping started and revolutionised the world by a historian who wrote the book on the subject.
“Container didn’t just happen. Its adoption required huge sums of money, both from private investors and from ports that aspired to be on the leading edge of a new technology. It required years of high-stakes bargaining with two of the titans of organized labor, Harry Bridges and Teddy Gleason, as well as delicate negotiations on standards that made it possible for almost any container to travel on any truck or train or ship. Ultimately, it took McLean’s success in supplying U.S. forces in Vietnam to persuade the world of the container’s potential.“