- Equities struggle generally when yields are rising AND forward earnings per share (EPS) expectations are falling.
- Source: Oxford Economics.
Macroeconomics
Snippets on the big picture.

Ukraine
- This is a very useful resource for tracking what is going on in the Ukraine war.
- Produced by The Institute for Study of War (ISW) it is a daily assessment (see under “Latest”, example here) of the situation on the ground along with a useful map (pictured).
- Here is a video that time lapses all the maps since the invasion began.
- This Substack (written by Lawrence Freedman, Emeritus Professor of War Studies at King’s College) provides some very good analysis of the meta situation.
- One angle that is key to watch for second order thinking is China. This was a really great piece to understand the China angle as was this (arguing that perhaps this crisis could push China back to collective leadership).
- (h/t The Browser).

European inflation
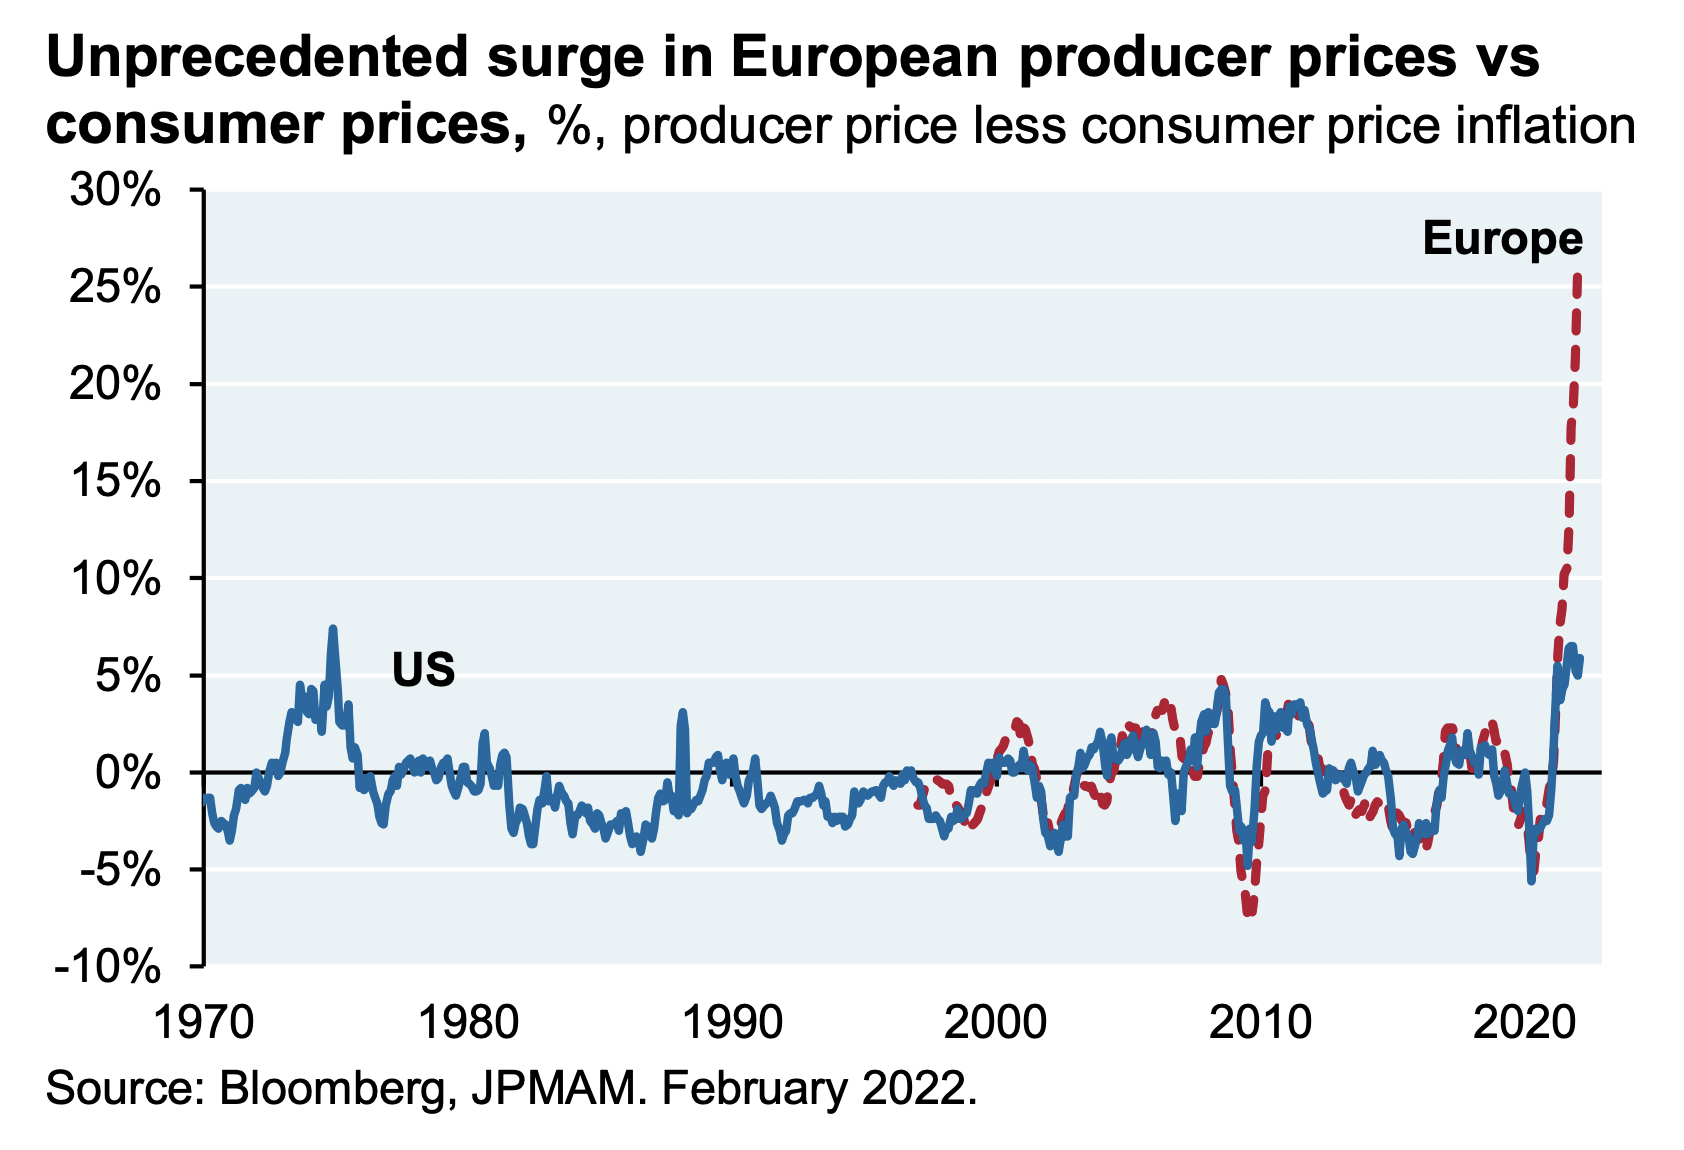
- Europe is experiencing an unprecedented surge in producer prices relative to consumer prices.
- This surge is either going to hit margins and profits, or will need to be passed through to consumer prices.
- Source: JPM.
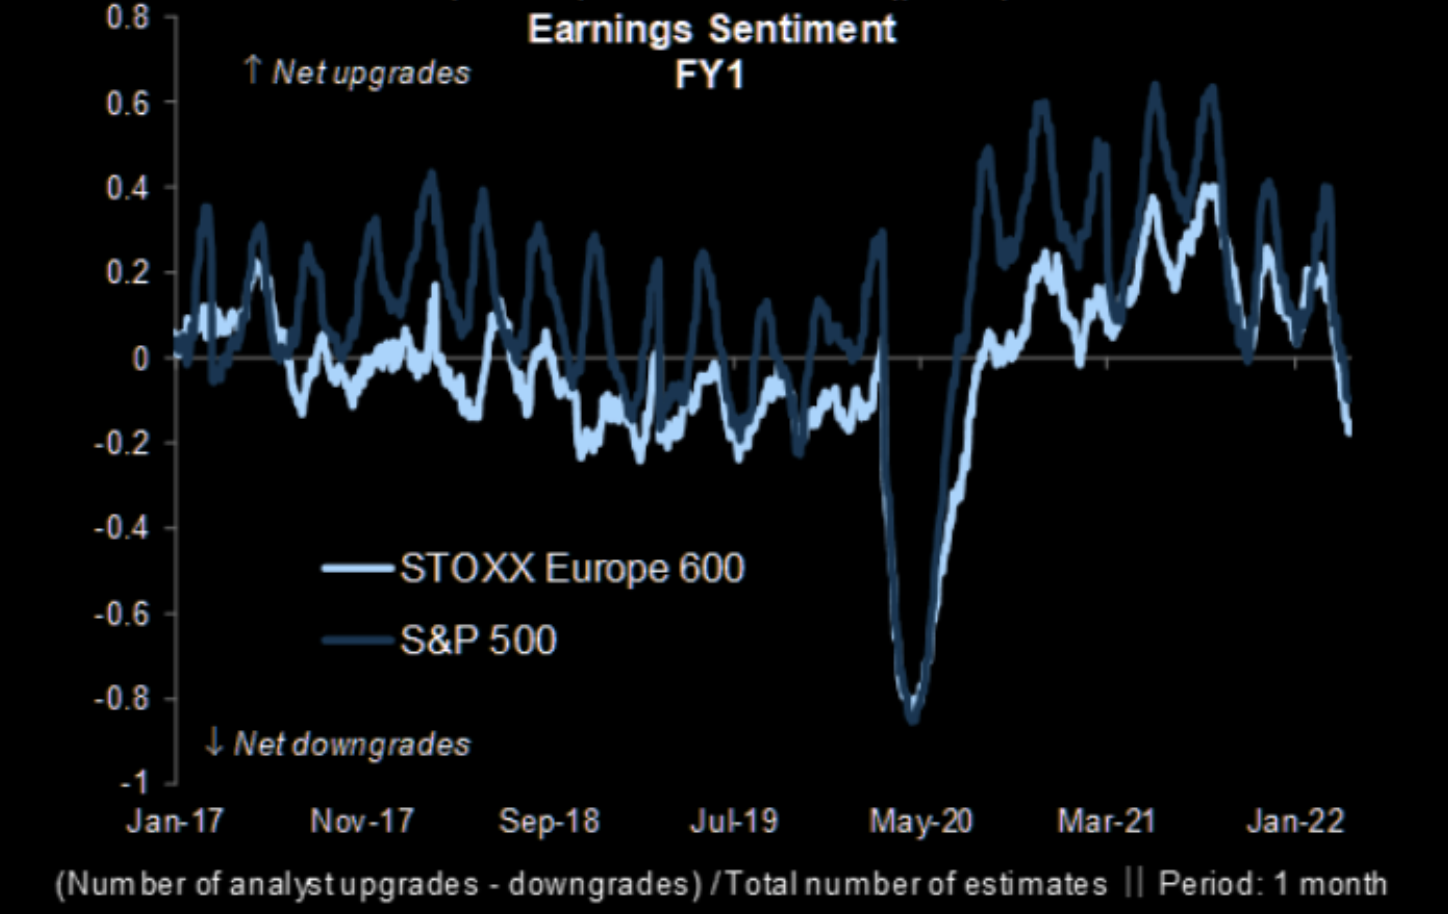
Earnings Sentiment
- Earnings sentiment has taken a big knock in the last two months.
- Source: themarketear.com.
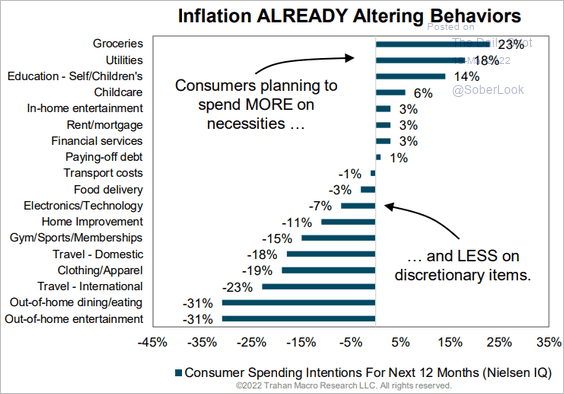
Inflation Impact
- The price shock is already starting to lead to changing consumption patterns.
- h/t Daily Shot.
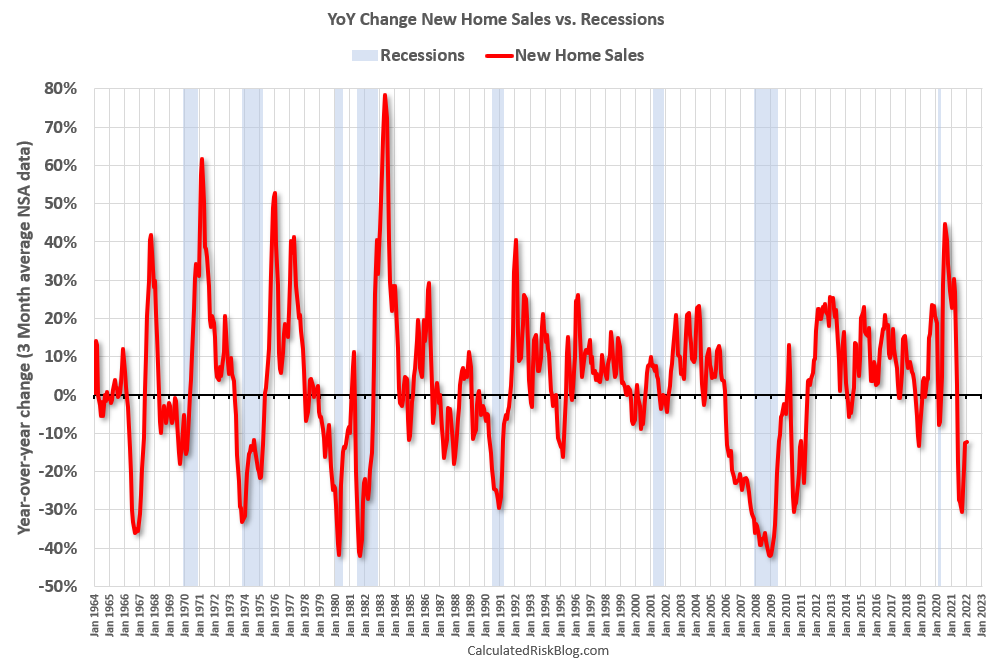
Recession Watching
- New home sales is a great variable to watch for recessions.
- “When the YoY change in New Home Sales falls about 20%, usually a recession will follow.”
- Any Fed tightening cycles that cause recessions show up here first.
- There are exceptions to this rule – usually due to strong spending on defence or non-residential investment holding the economy up. The pandemic also distorted the series.
- Currently this indicator isn’t flashing red.
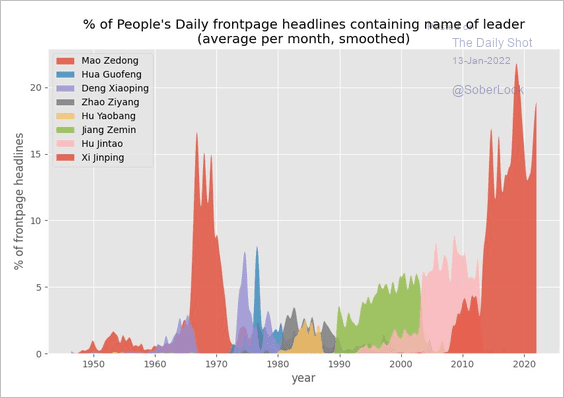
China People’s Daily
- Chart showing the percentage of front page headlines of the People’s Daily in China containing the name of the leader.
- No comment needed.
- Source: DailyShot.
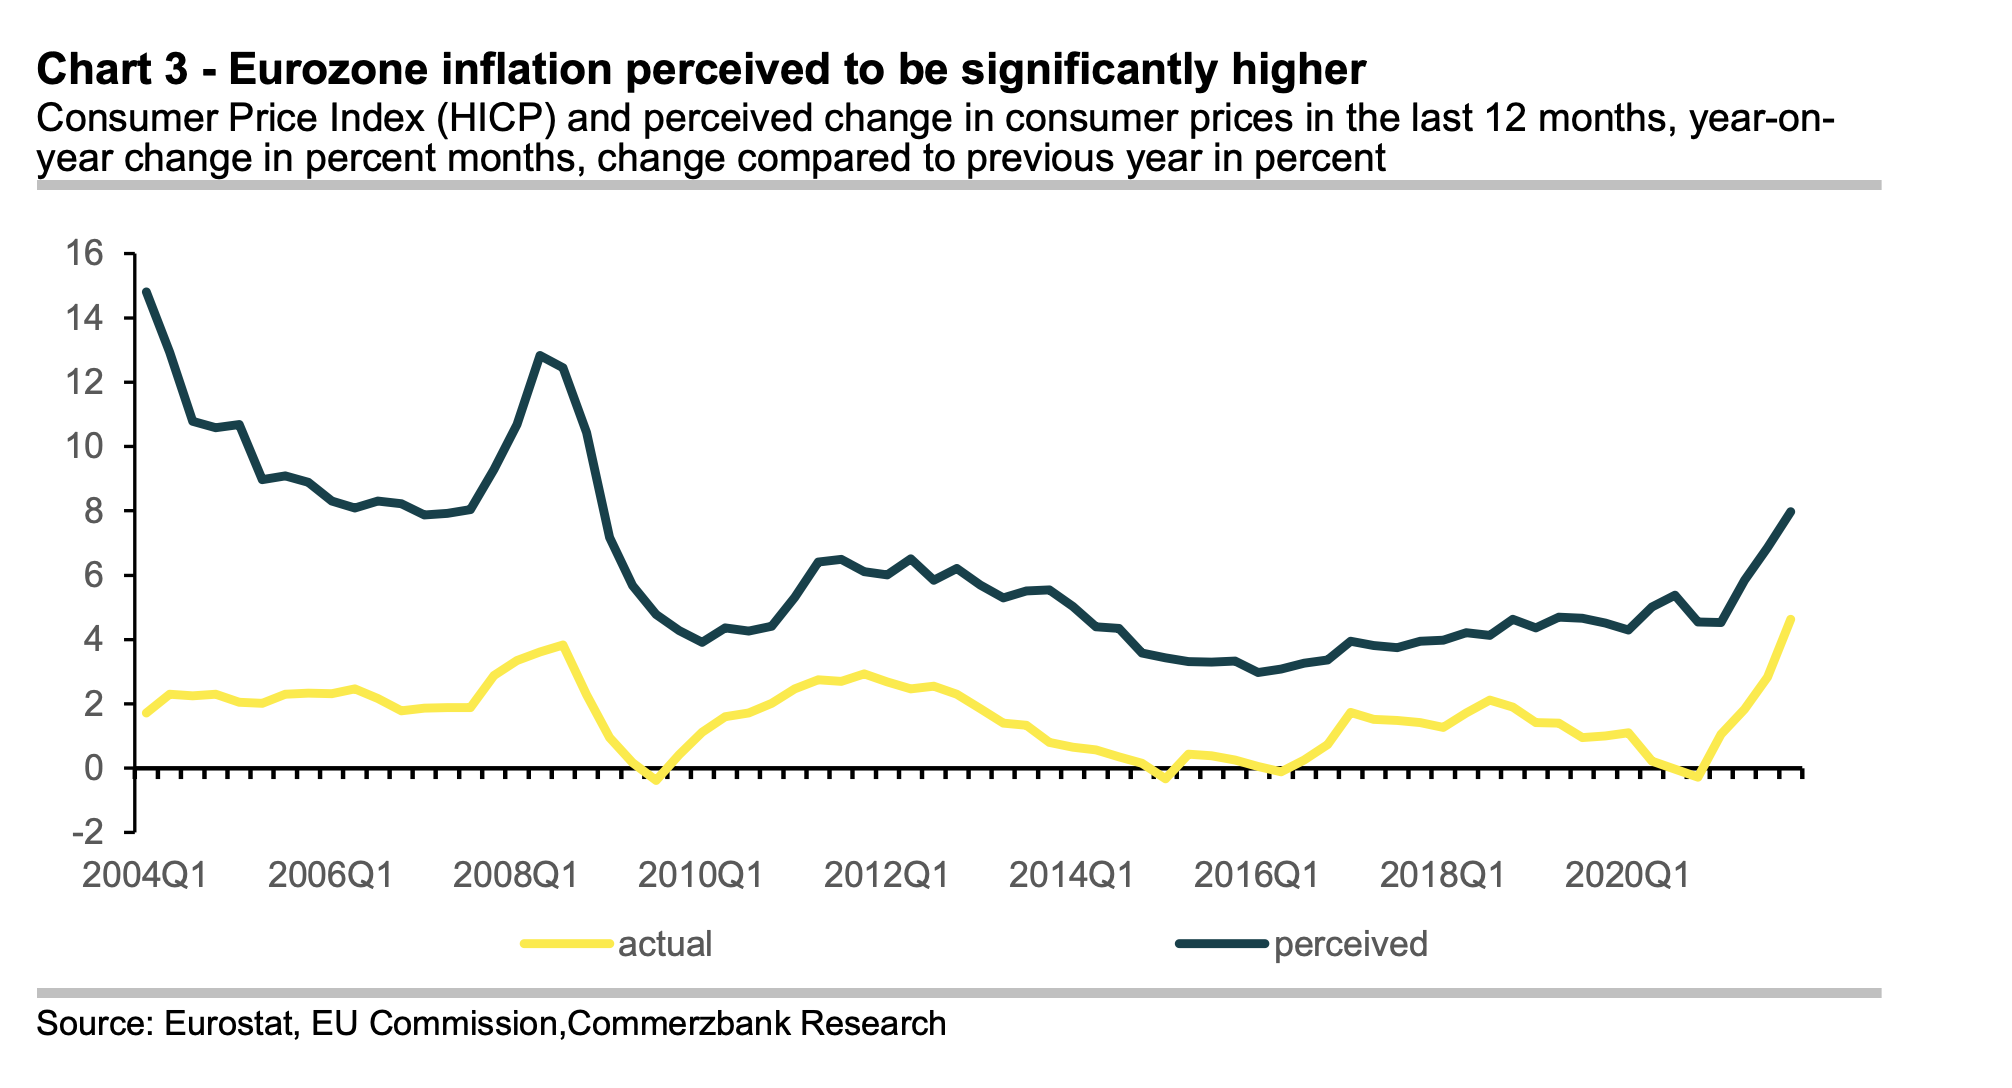
Inflation Perception
- Data from ECB showing that people perceive inflation to be a lot worse than the officially measured values.
- Interesting to see how this difference moves over time and behaves in spikes.
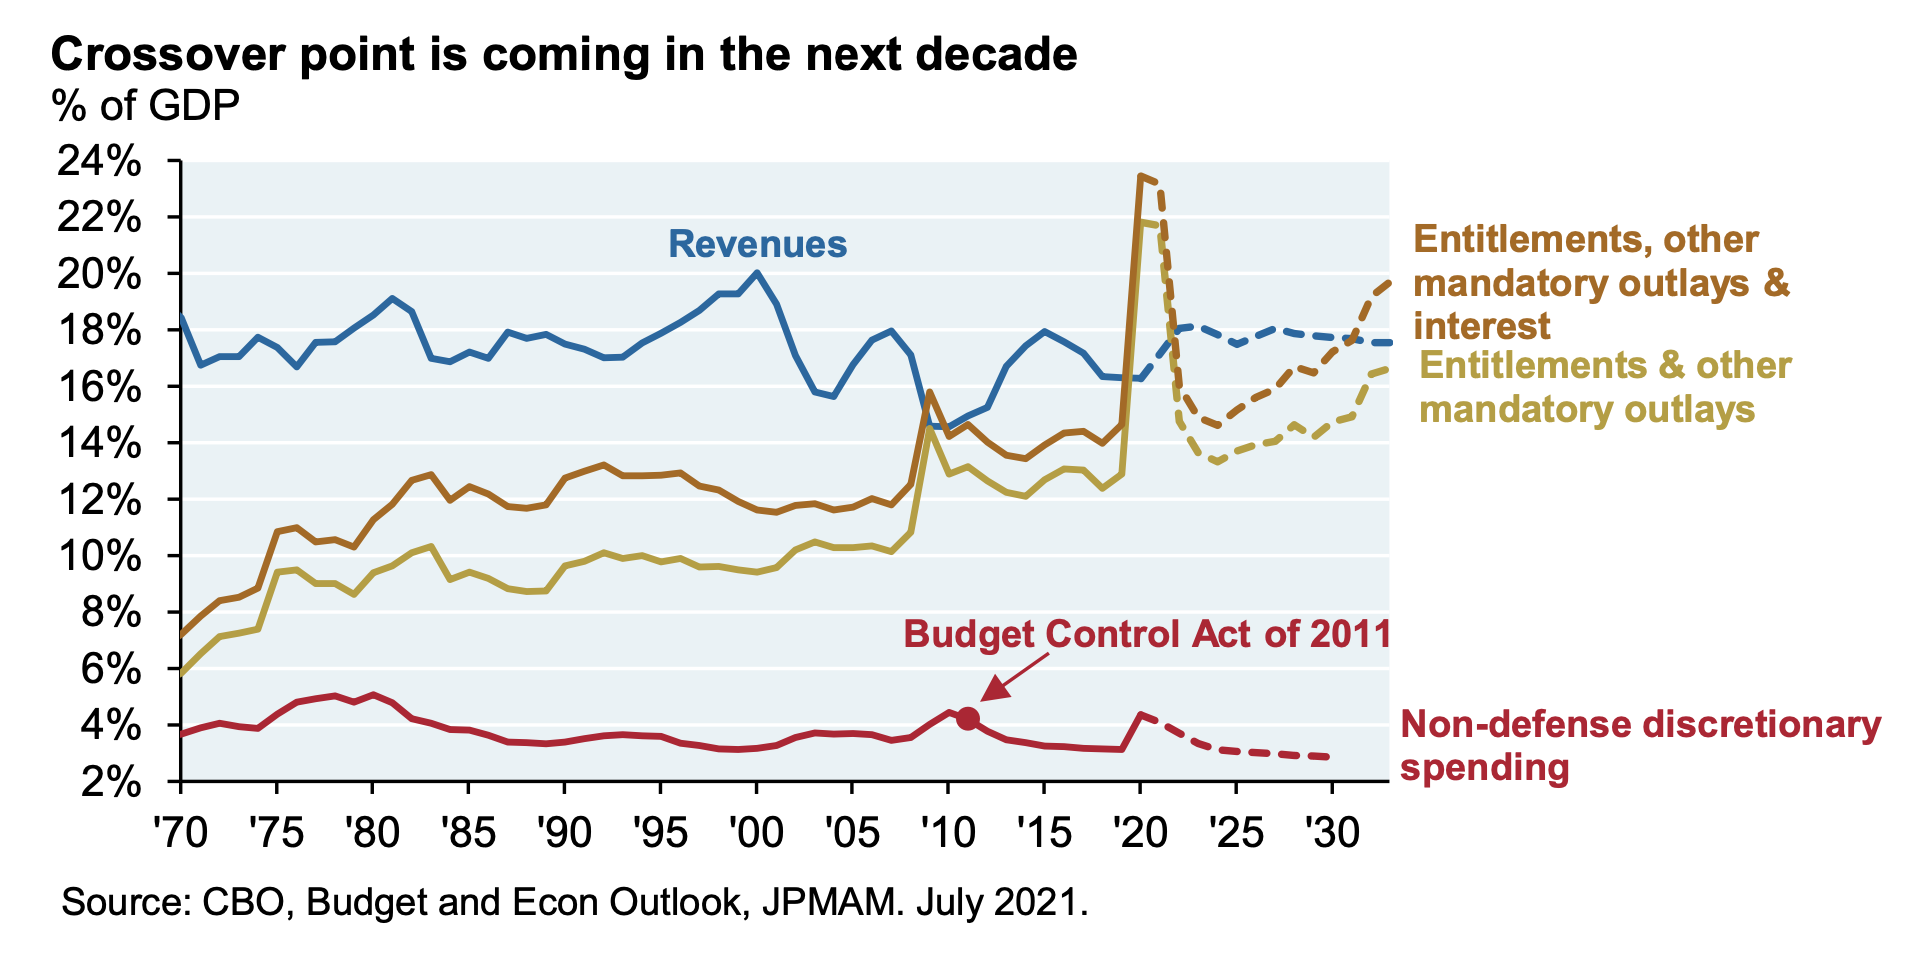
Crossover Point
- In 2030 the US budget will reach a crossover point where entitlements and mandatory outlays will outstrip revenues.
- This means there will be no room for non-defence discretionary spending.
- Source: JPM.
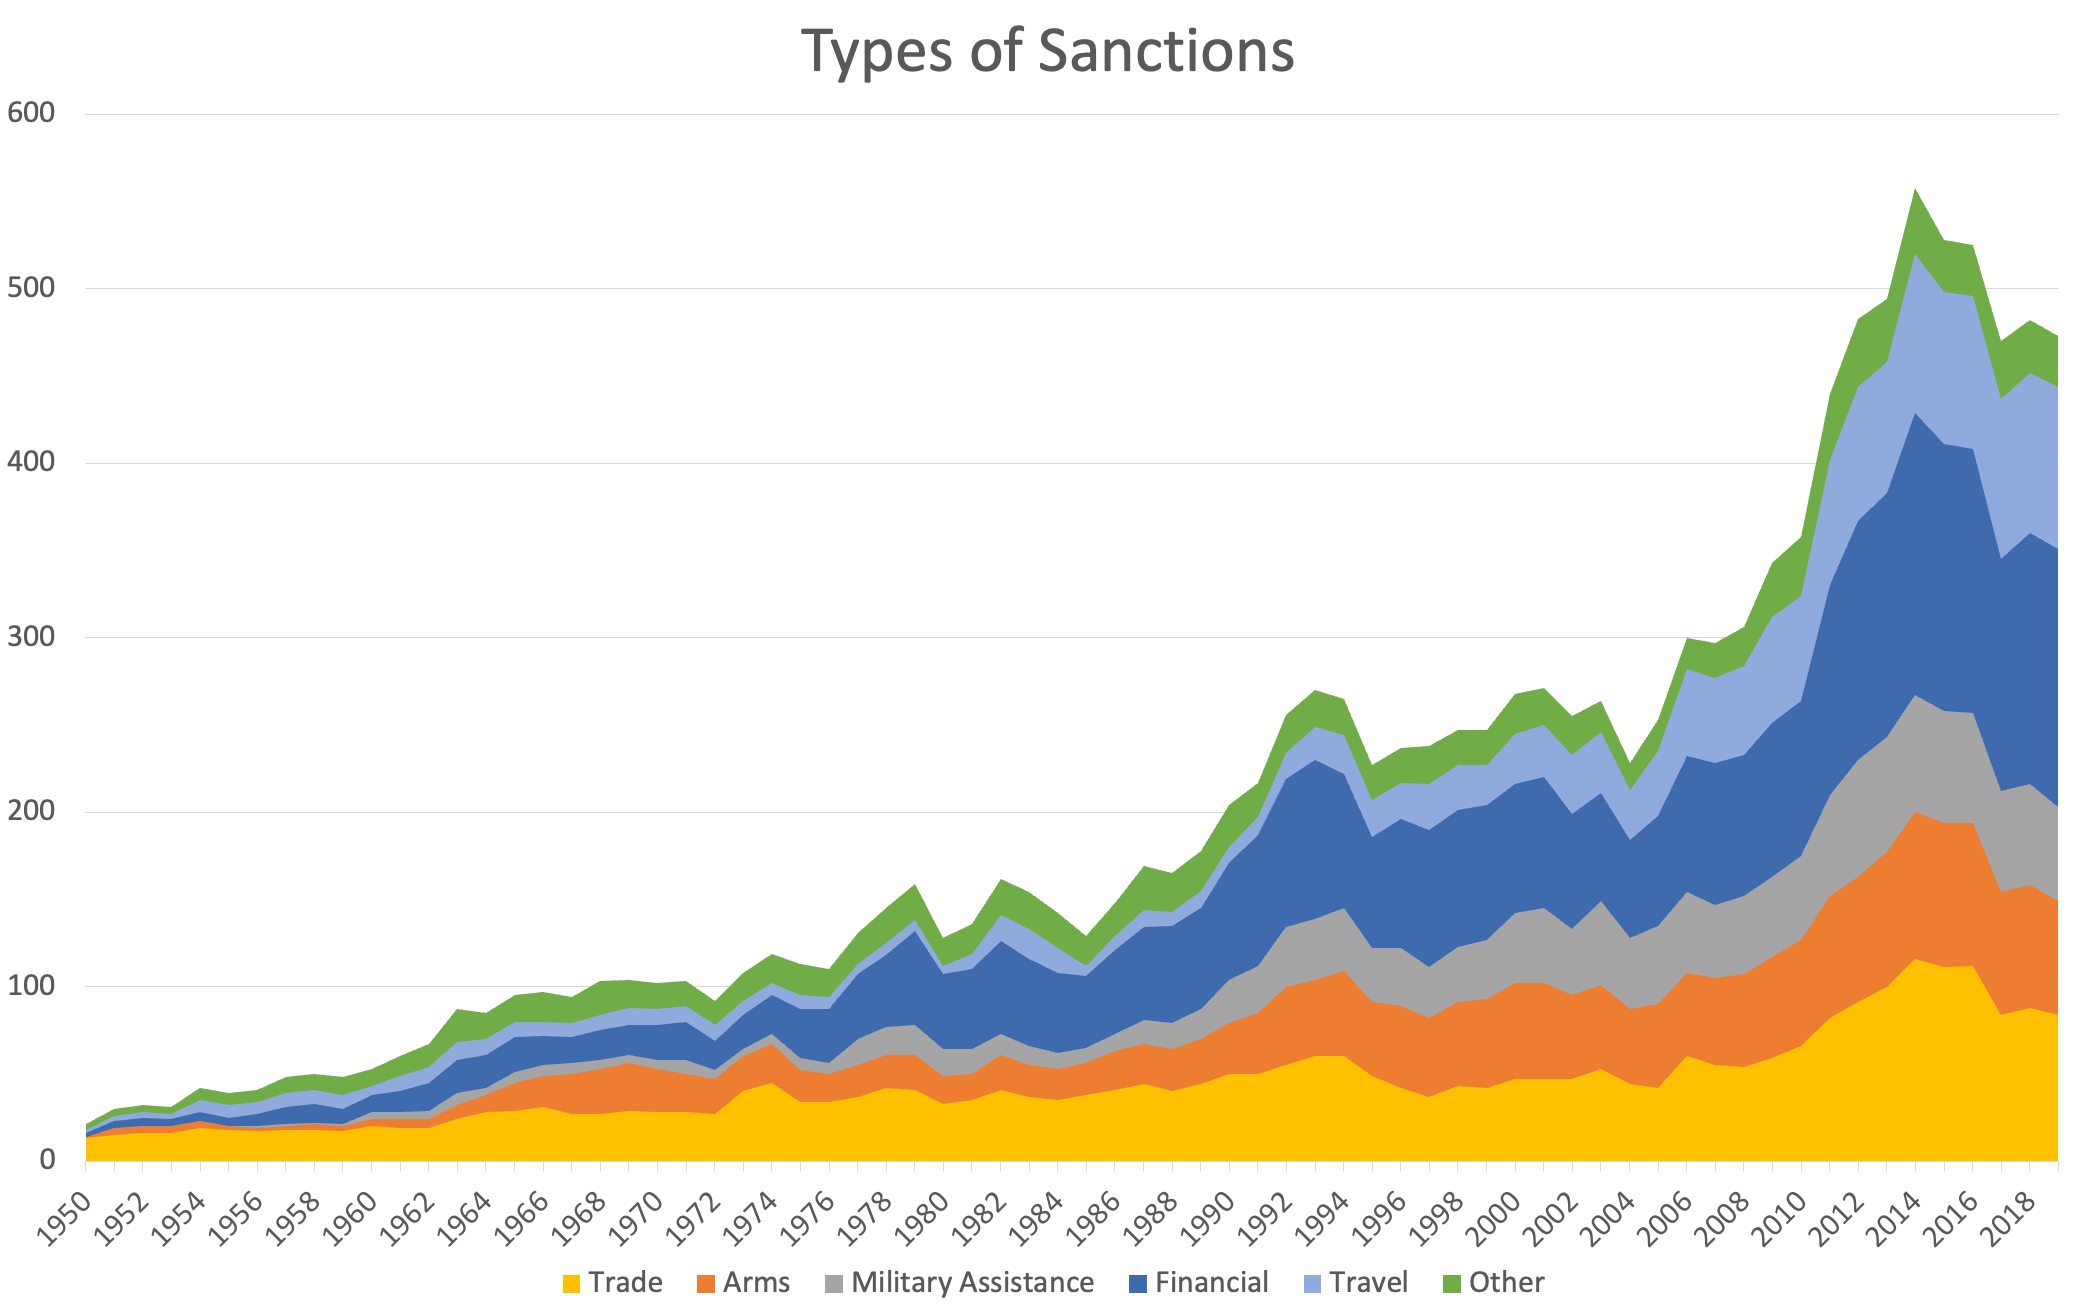
Sanctions
- Nice chart from Net Interest showing global sanctions by type.
- Interesting to see the rise of financial sanctions vs. other sanctions.
- The original source has all the data.
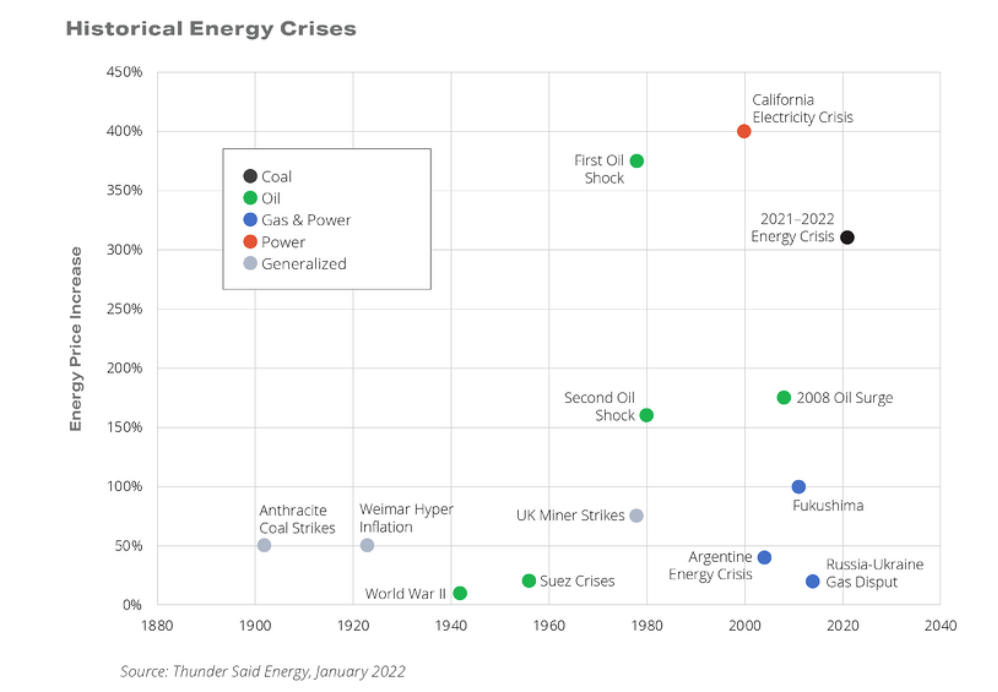
Historical Energy Crises
- A basket of energy commodities – seaborne thermal coal, global gas, European electricity and US gasoline – has risen by a weighted average of 4x since 2018-20 levels.
- This ranks as one of the top three worst price rises in history.
- Source.
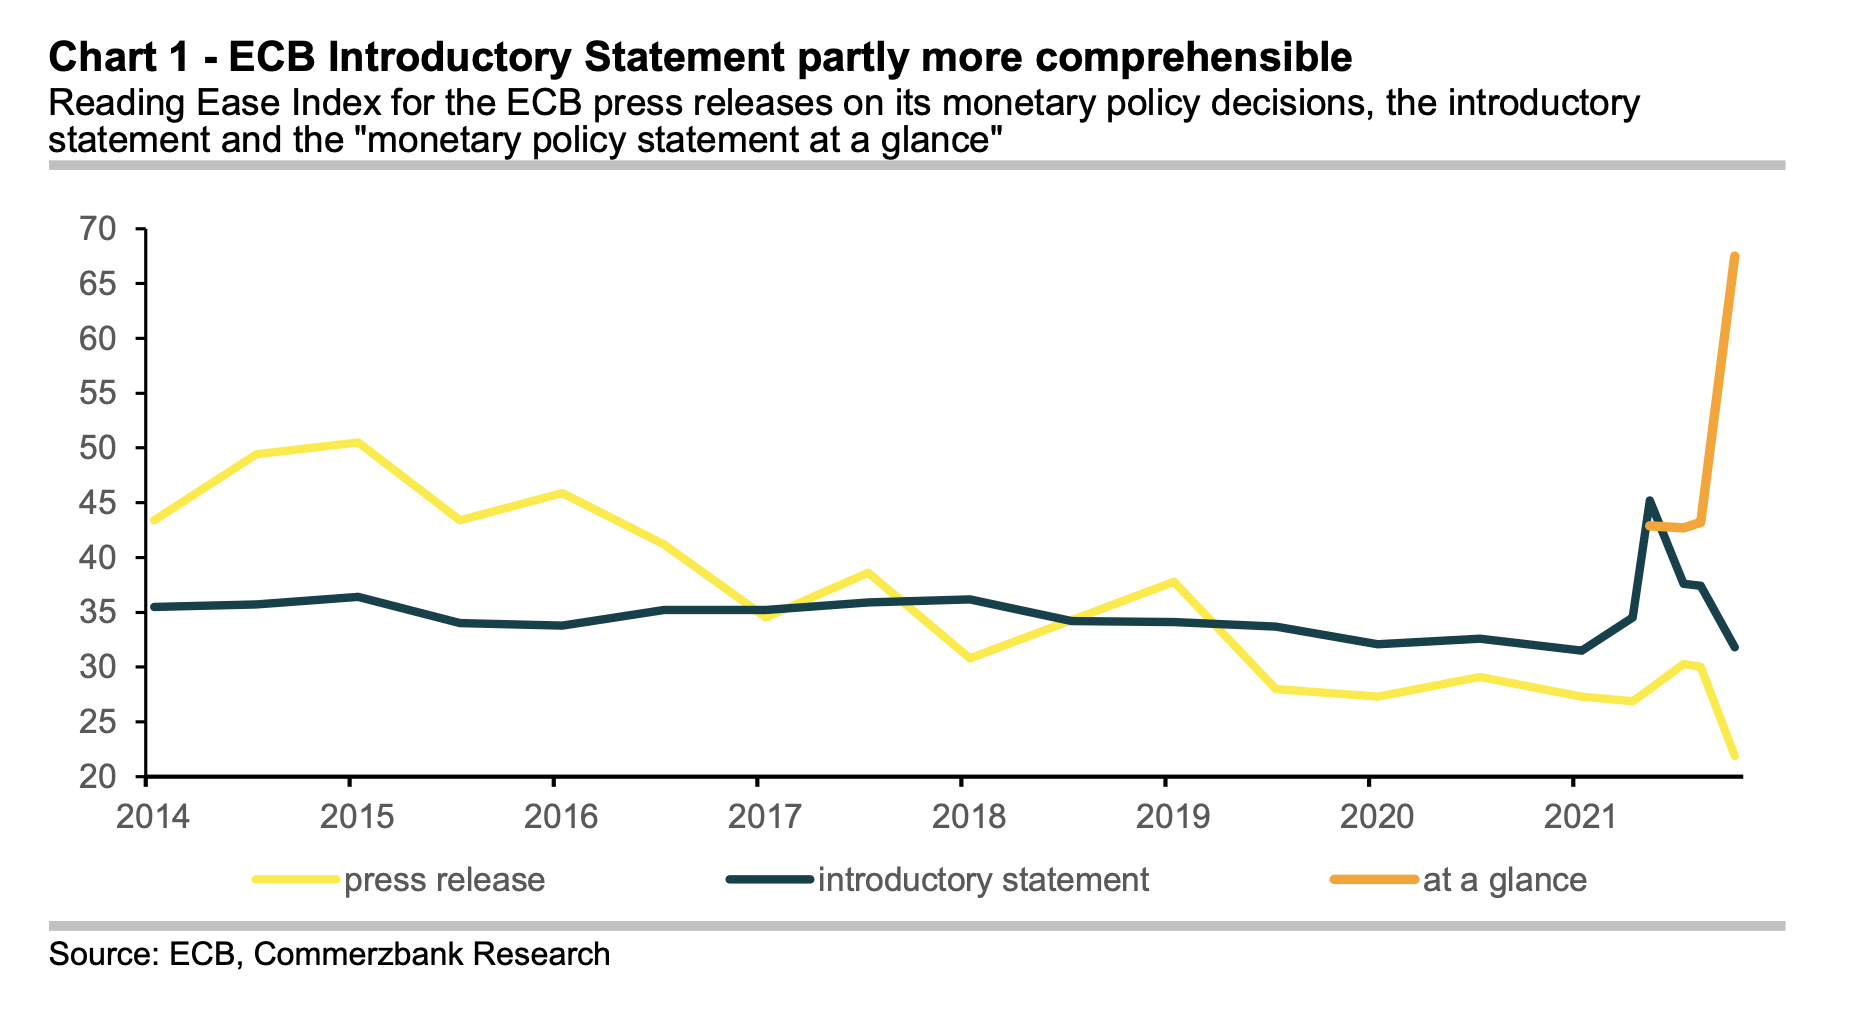
ECB Communications
- The ECB, by introducing a new publication – “monetary policy at a glance“, is trying to address the declining and very poor readability of its existing press releases.
- The decline in readability, measured by the Reading Ease Index (REI), is largely down to the introduction of more complex monetary tools (e.g. TLTRO).
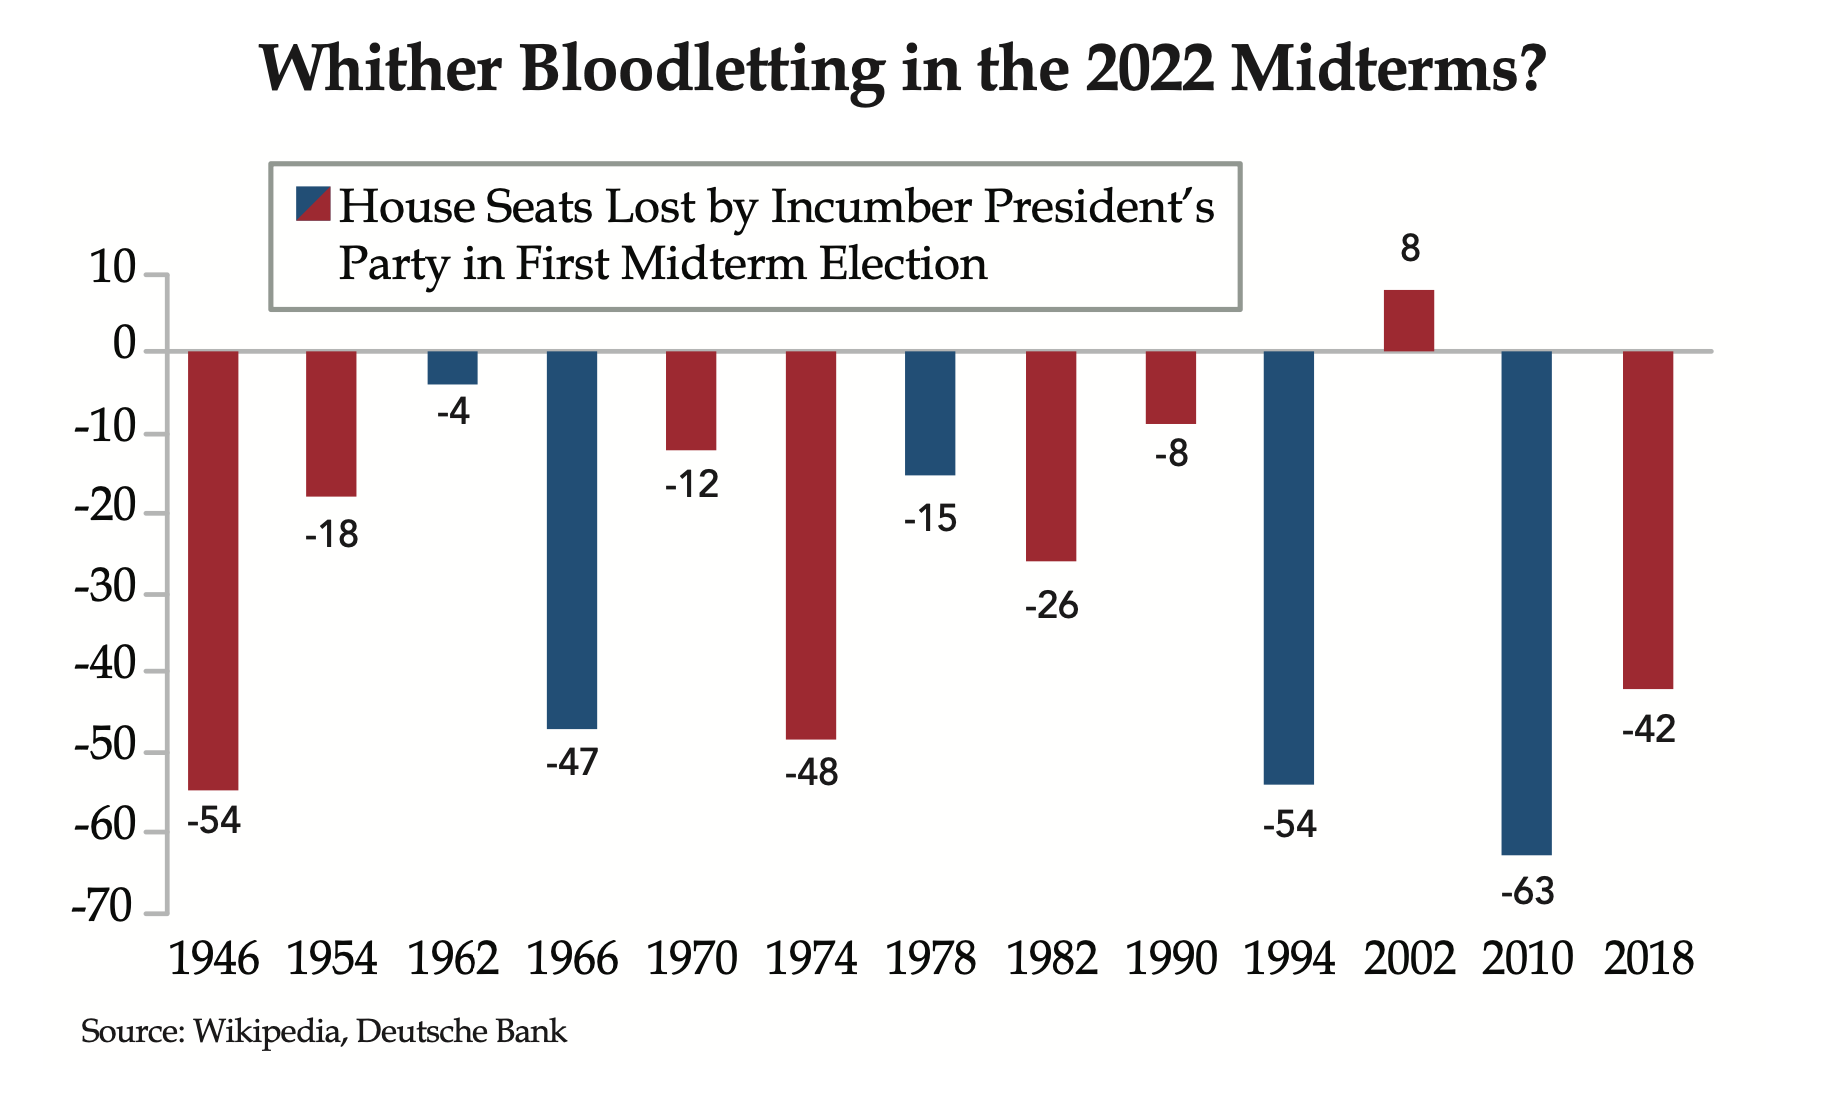
Mid-Term Elections 2022
- Incumbent President’s party typically loses seats in mid-term elections.
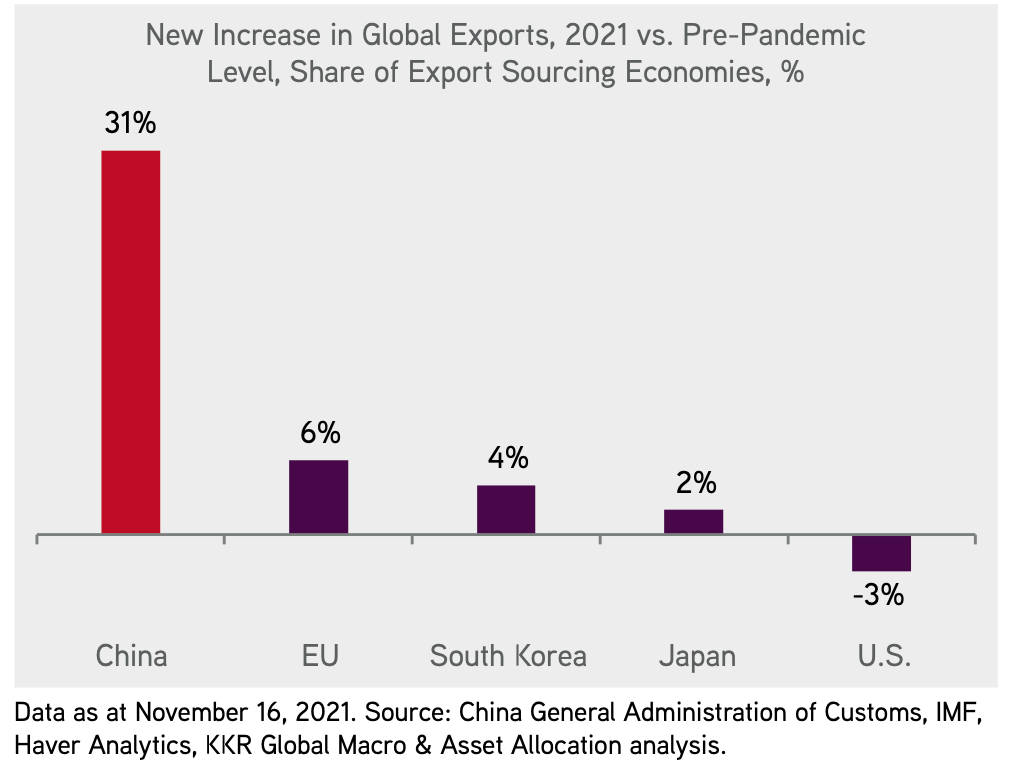
Export Share
- China has taken full advantage of the pandemic, gaining the most share of export growth.
Net Income by Sector
- Nice chart from GS showing contribution of total S&P 500 net income by sector.
- Interesting to see Financials pretty much hold up over a long period of time, with a blip for the financial crisis.
- Tech has been steadily increasing and Energy declining.

Dynamism
- Despite the prevailing narrative, dynamisms in the US has been consistently falling since the last 1970s.

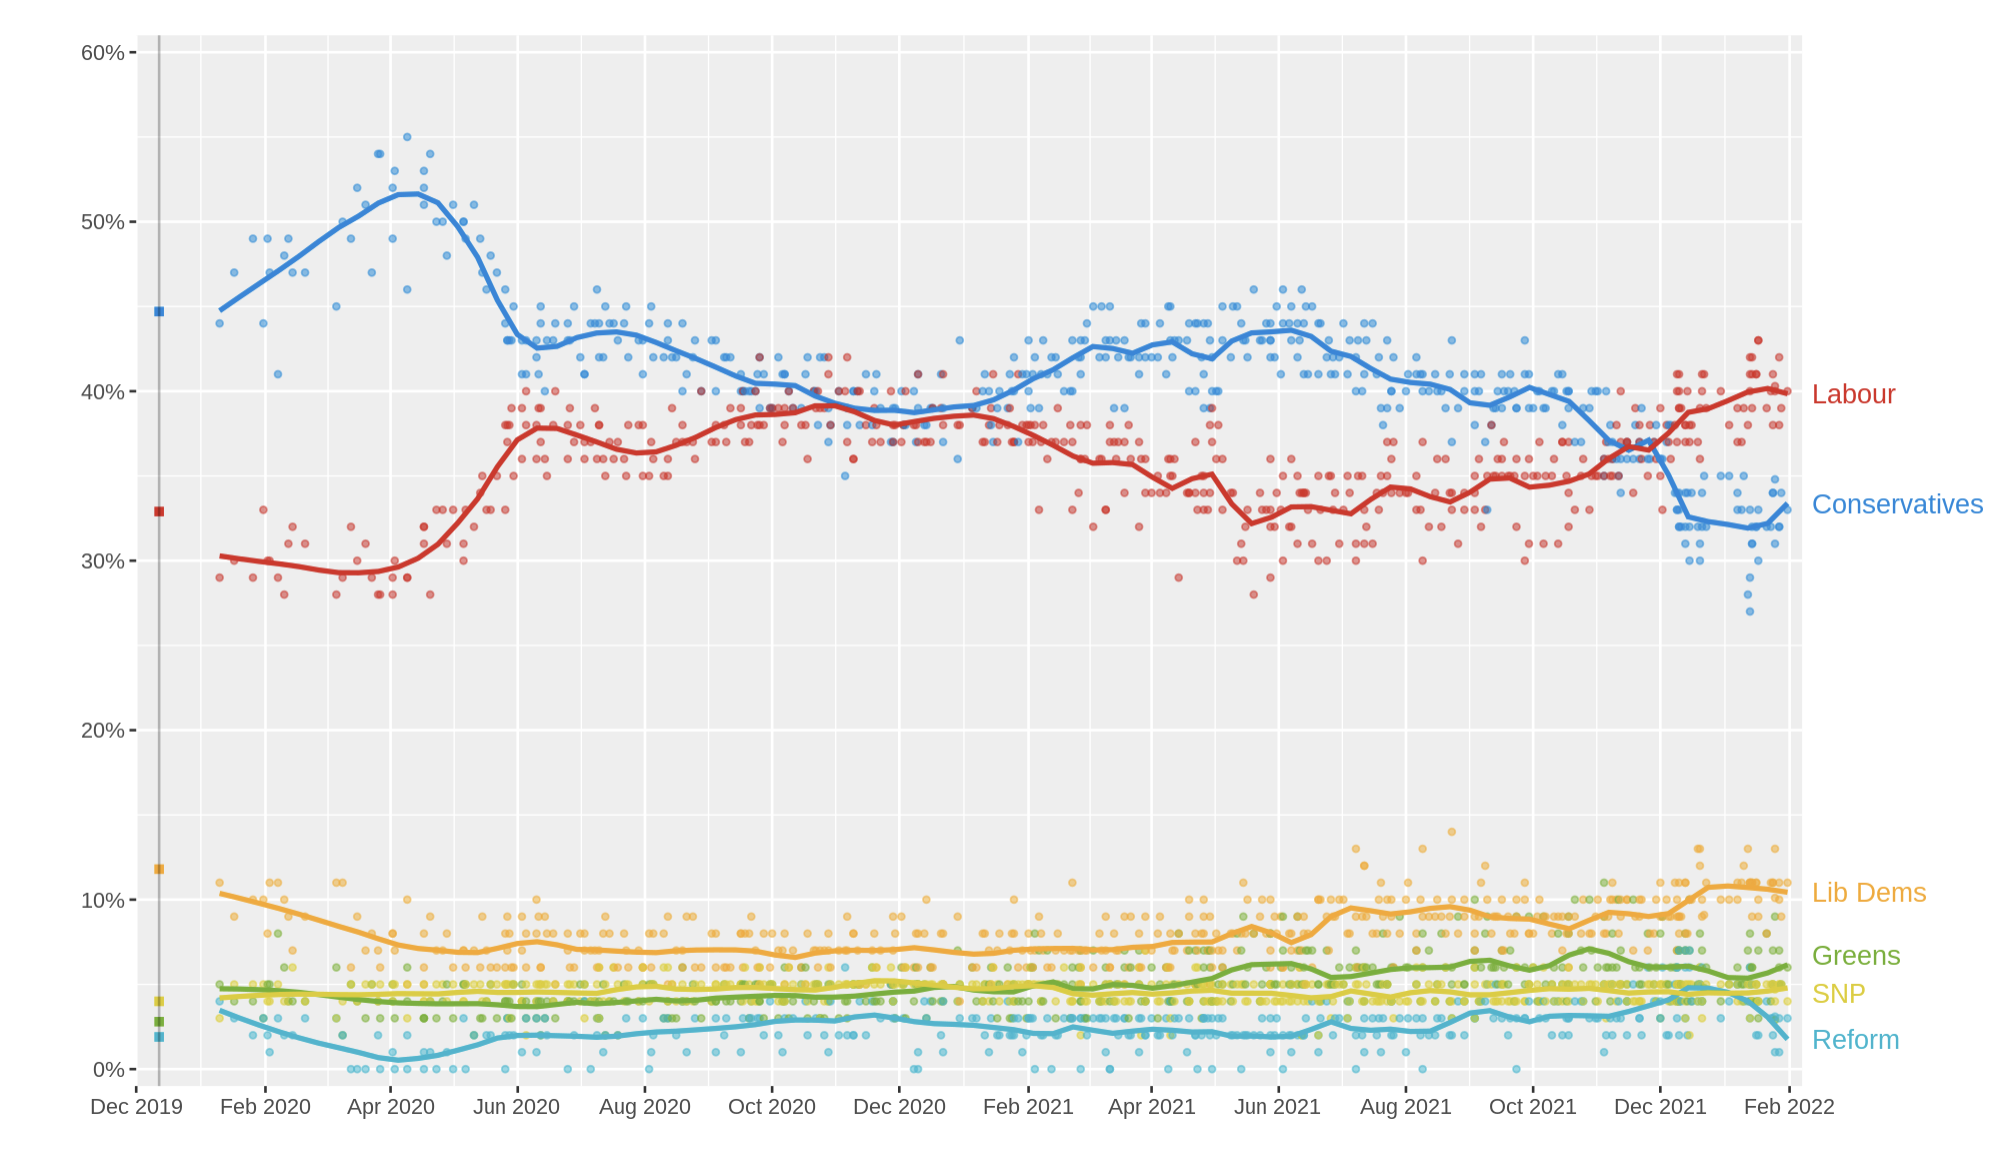
UK’s Labour Takes the Lead
- Latest opinion polls show Labour taking the lead.
- Source: Wikipedia poll tracker.
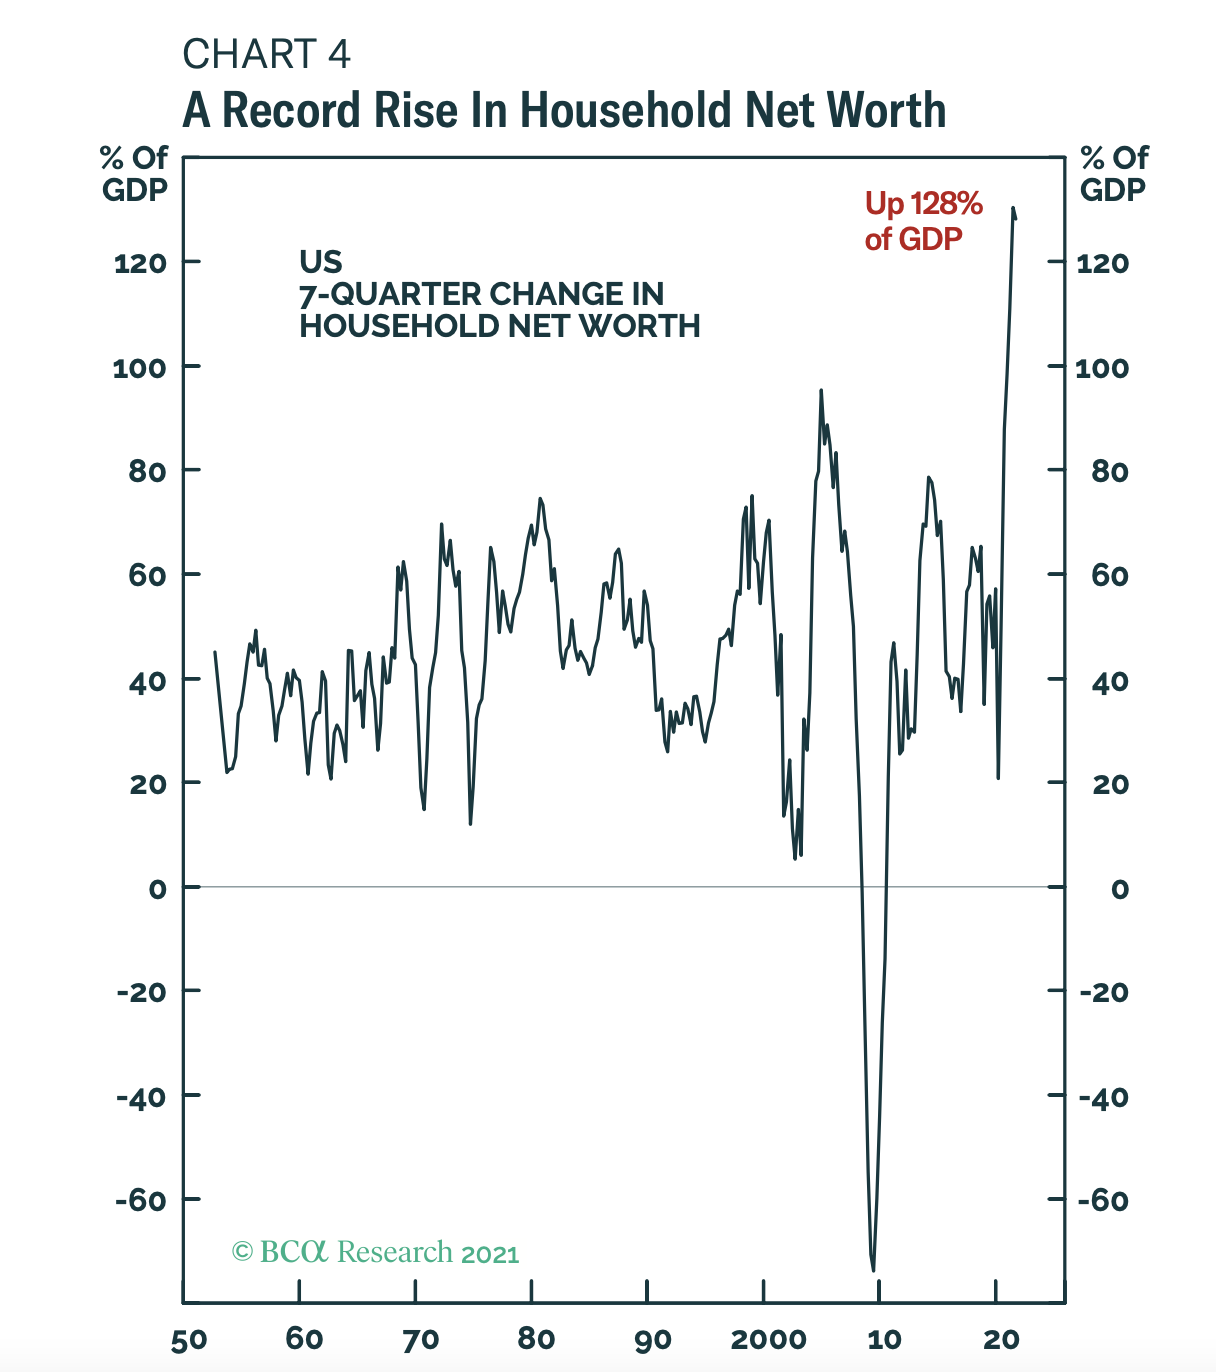
Household Net Worth
- US Household Net Worth is up a staggering 128% of GDP.
- The wealth effect alone can, using historic models, add a few points to GDP growth.
- Source: BCA Research.
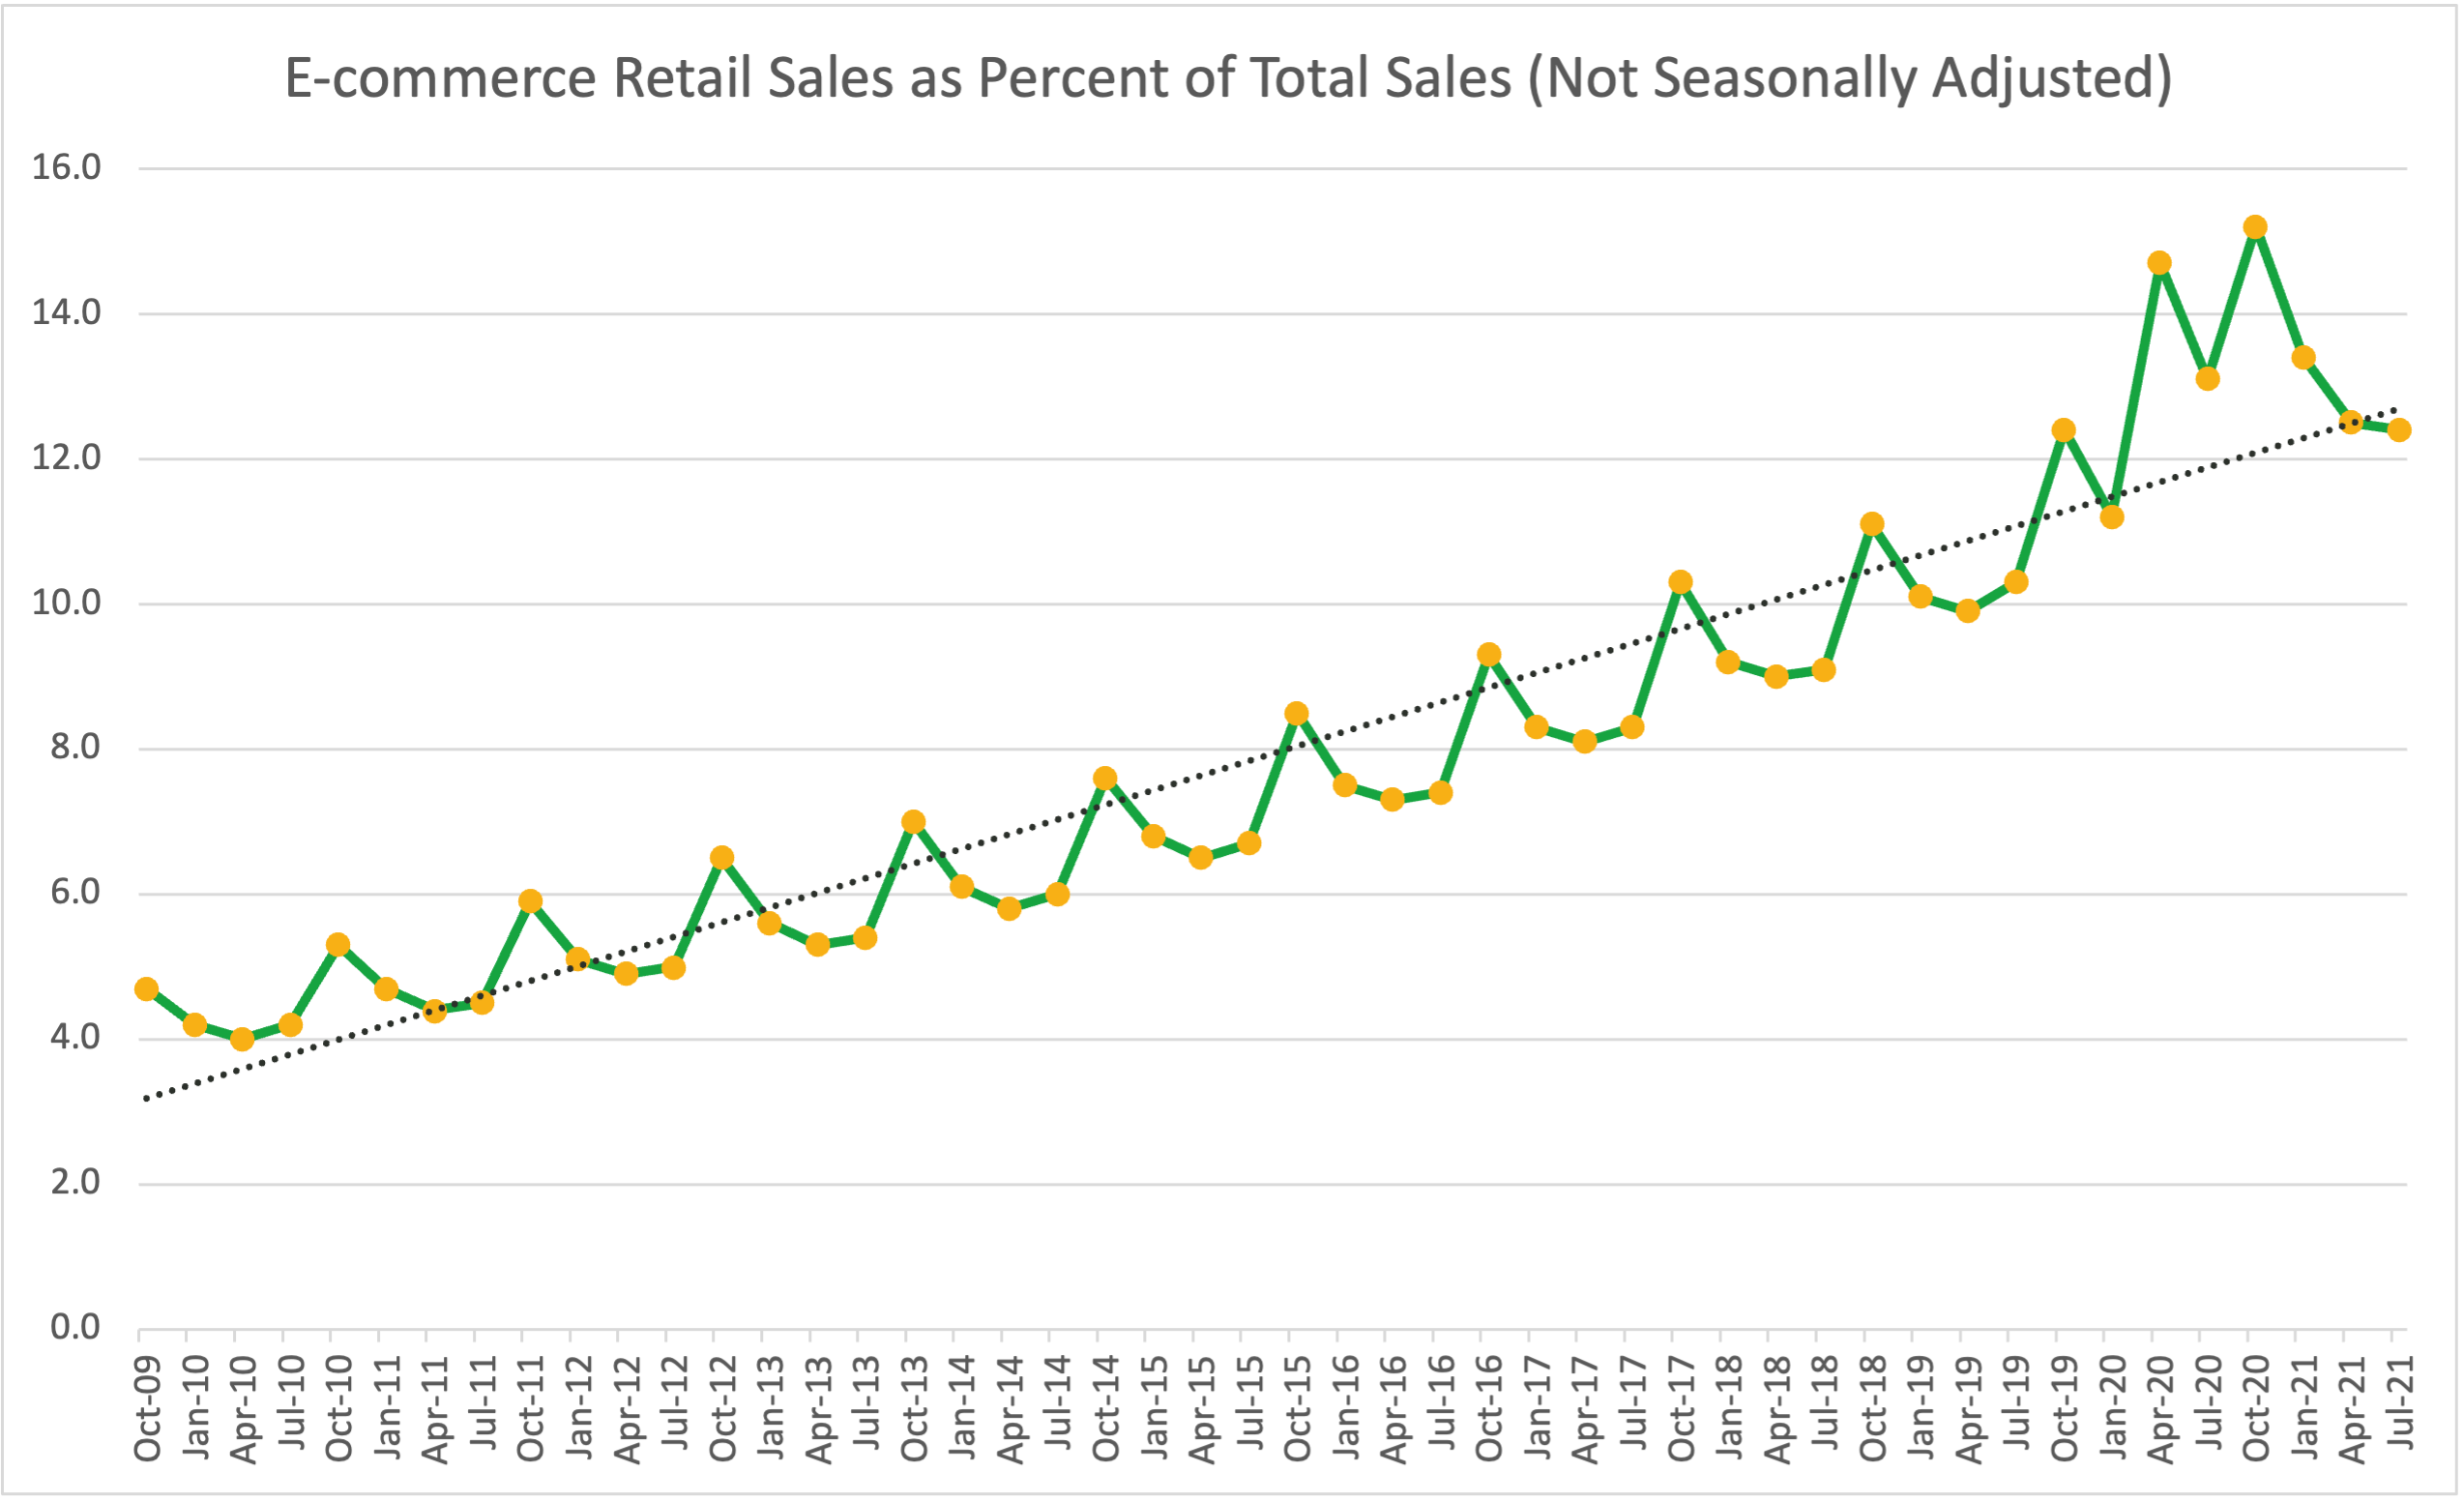
E-Commerce Sales Share
- Counter to the prevailing narrative – e-commerce hasn’t seen a step change and is almost exactly where a 10-year trend line would have predict it would be as a share of total retail in the US.
- The reason for this is that total retail sales has grown strongly (+13% vs. normally being +2-3%). In absolute terms, shoppers spent $204bn on e-commerce in Q3 2021 but the pre-pandemic trend would have predicted $183bn.
- h/t NZS Capital and Marketplace Pulse.
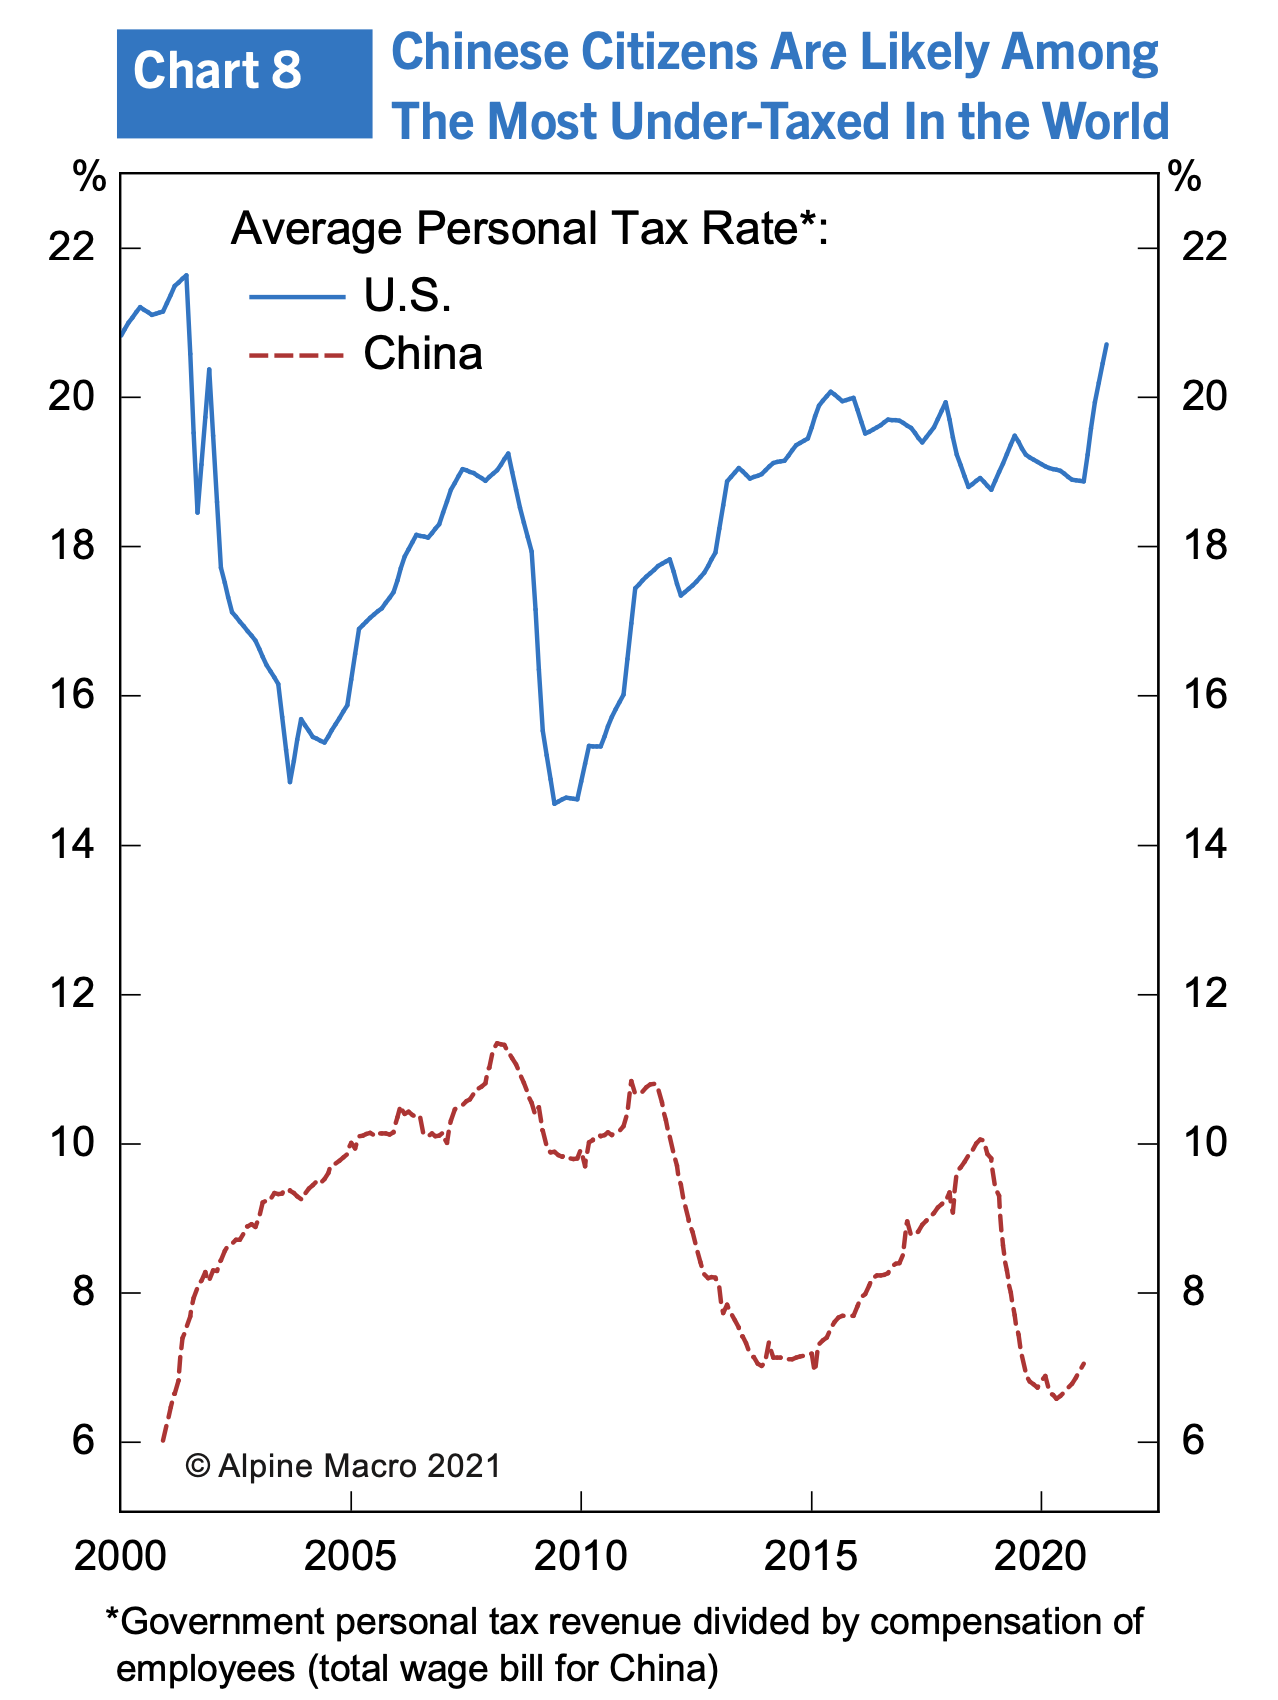
Chinese Tax Rate
- China has a very low personal tax rate.