- The European Central Bank (ECB) owns a large share of government bonds across Europe.
Macroeconomics
Snippets on the big picture.

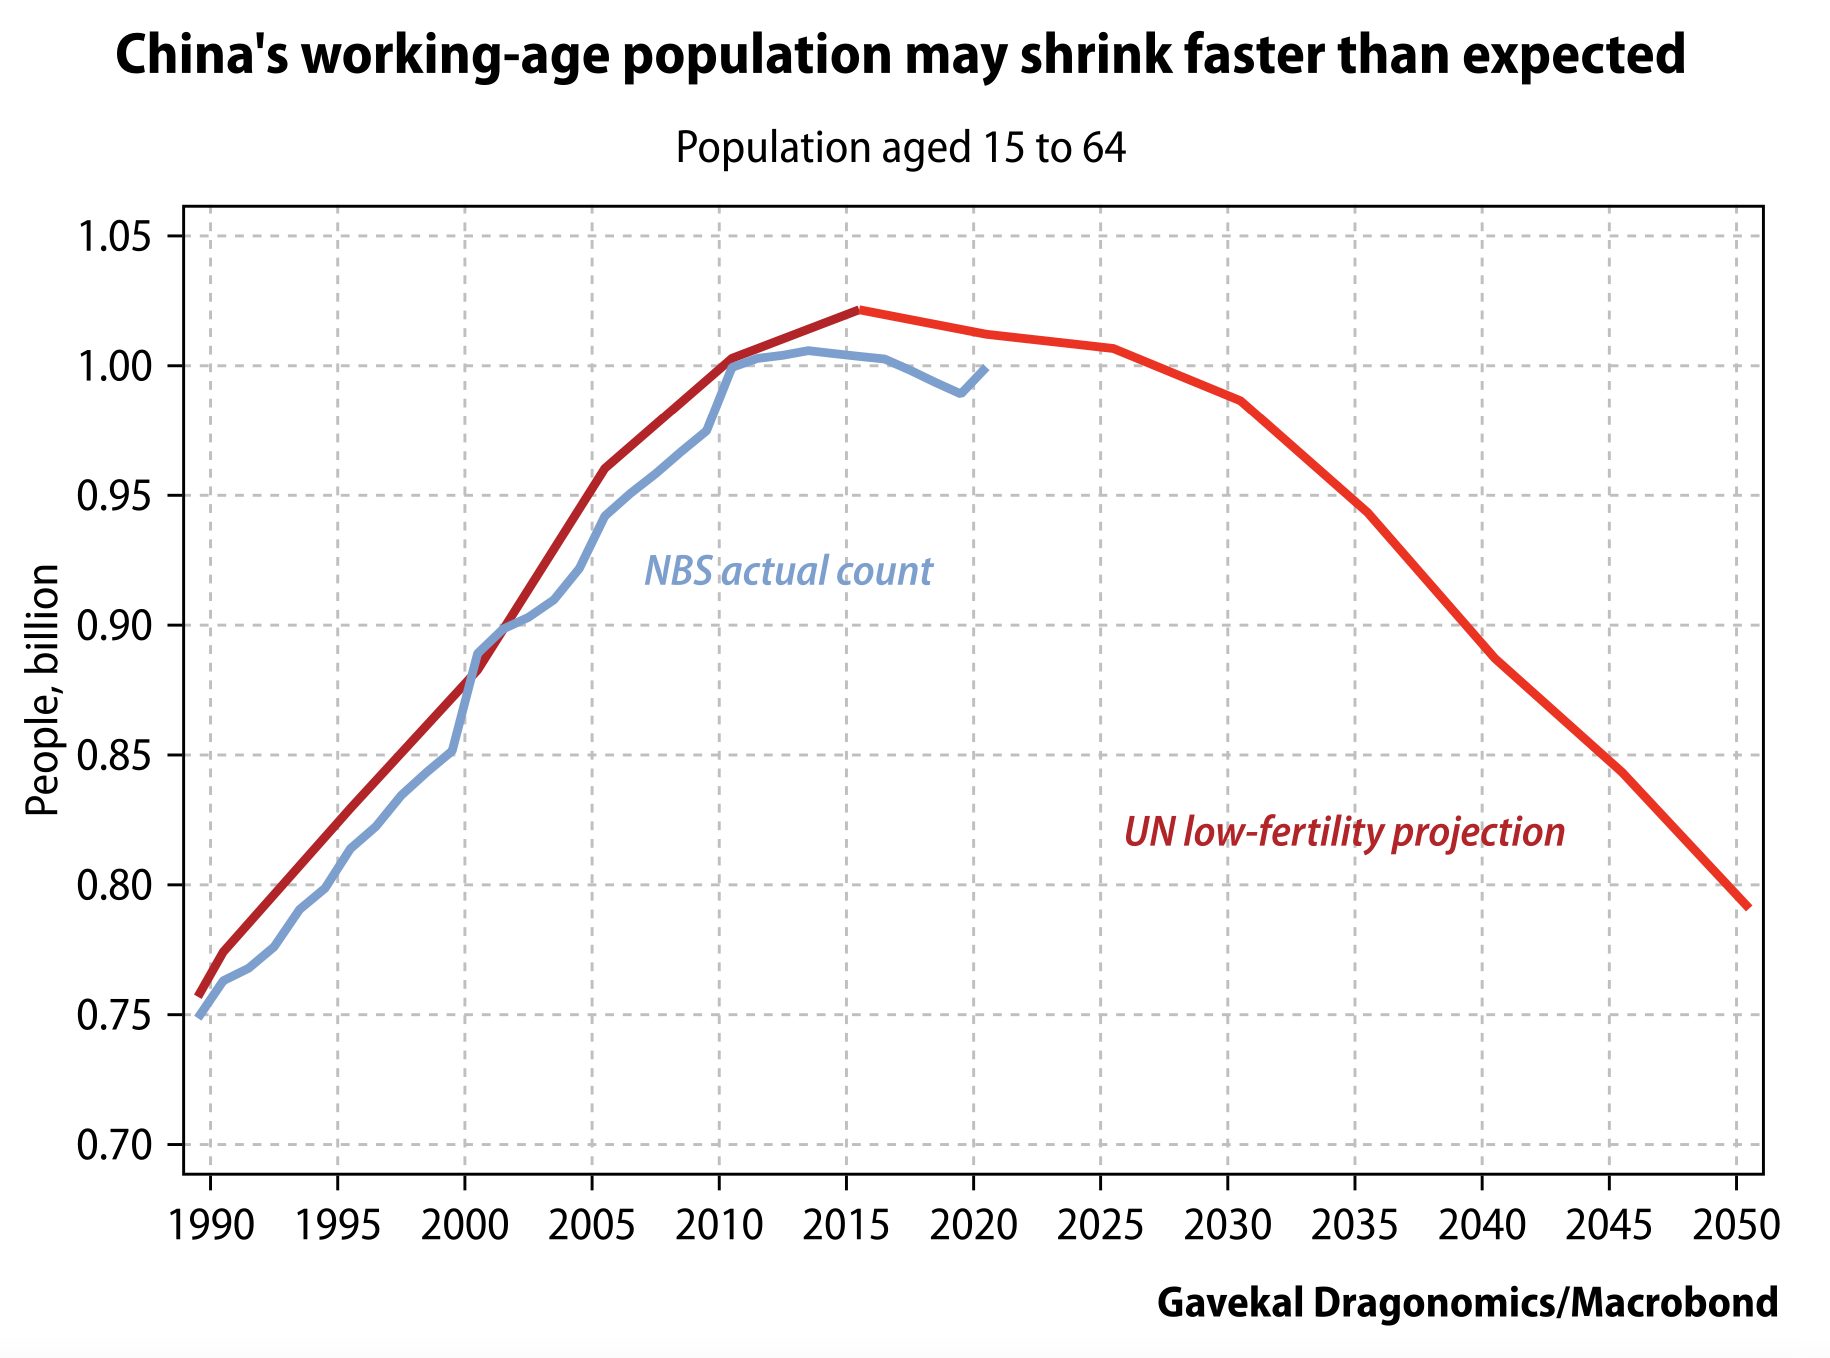
Chinese Working Age Population
- Latest 2020 census in China has painted a worrying picture.
- The working age population is declining faster than expected by models.
- Source: Gavekal.
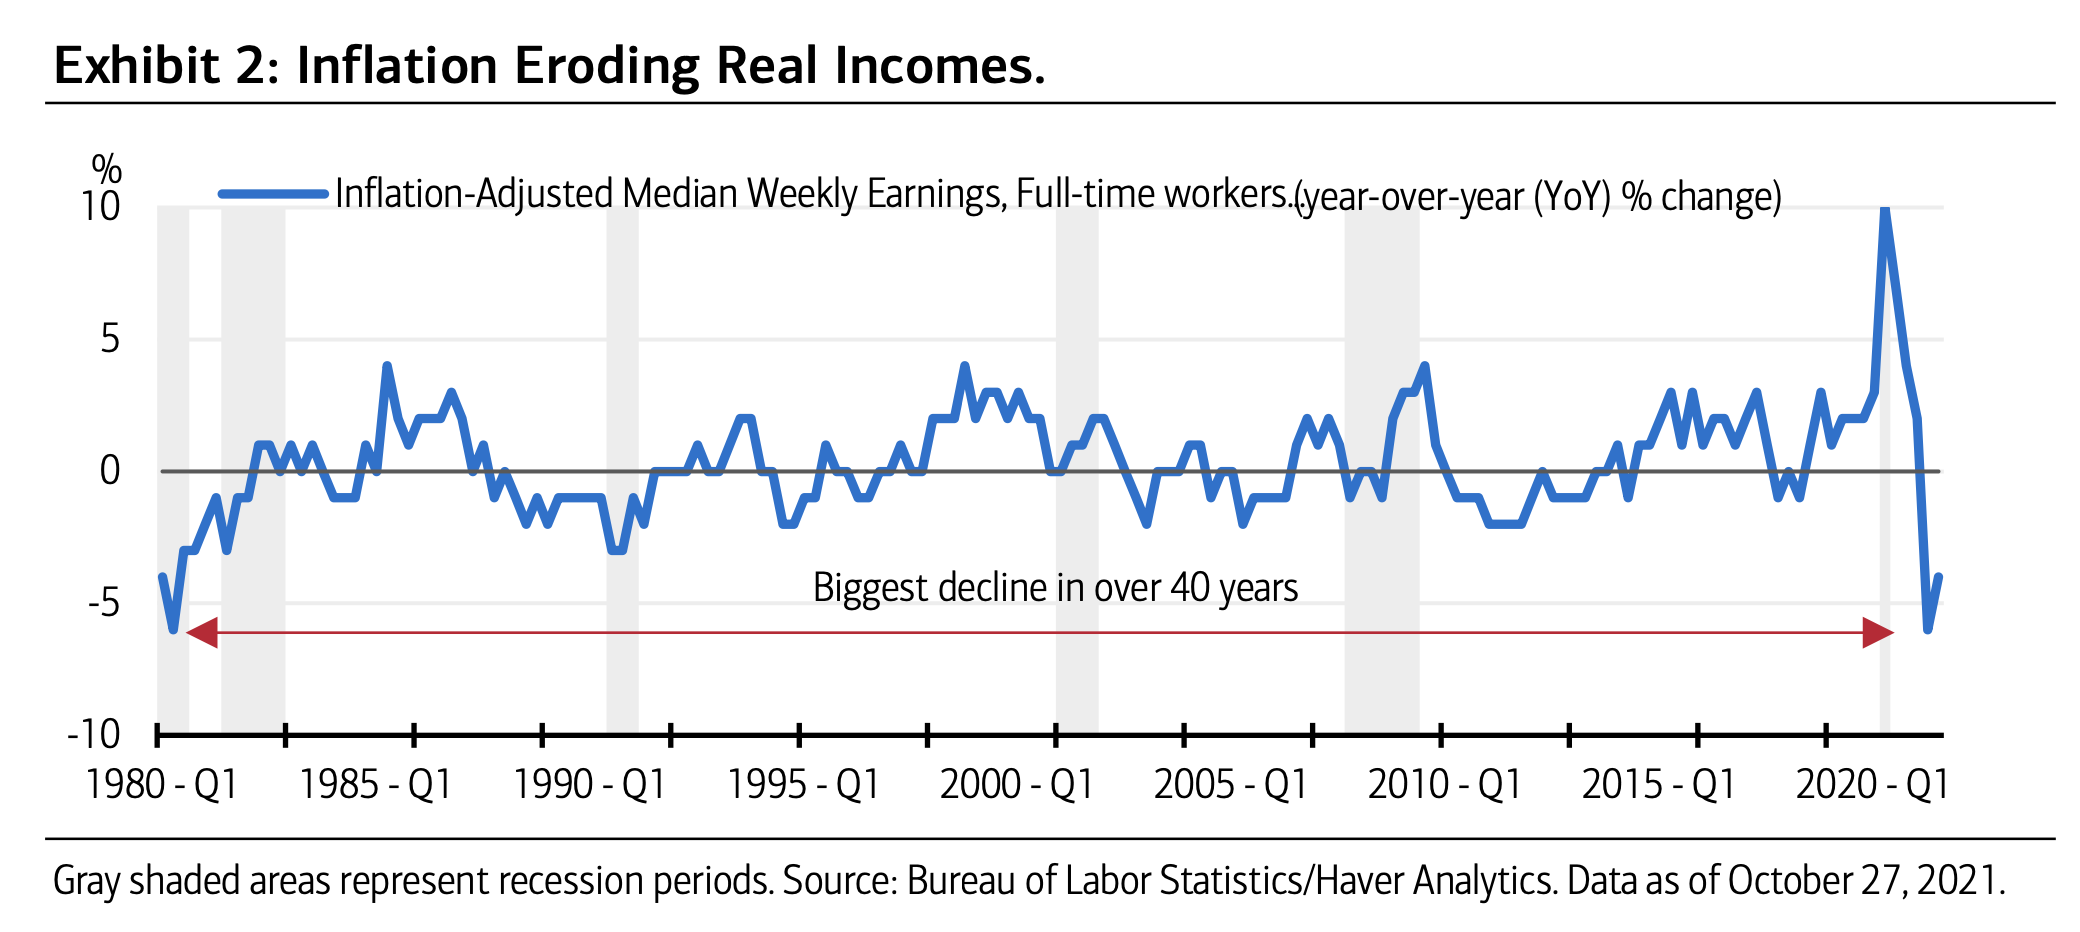
Real Incomes
- Inflation is eroding real incomes, at almost the same rate it did in the 1970s.
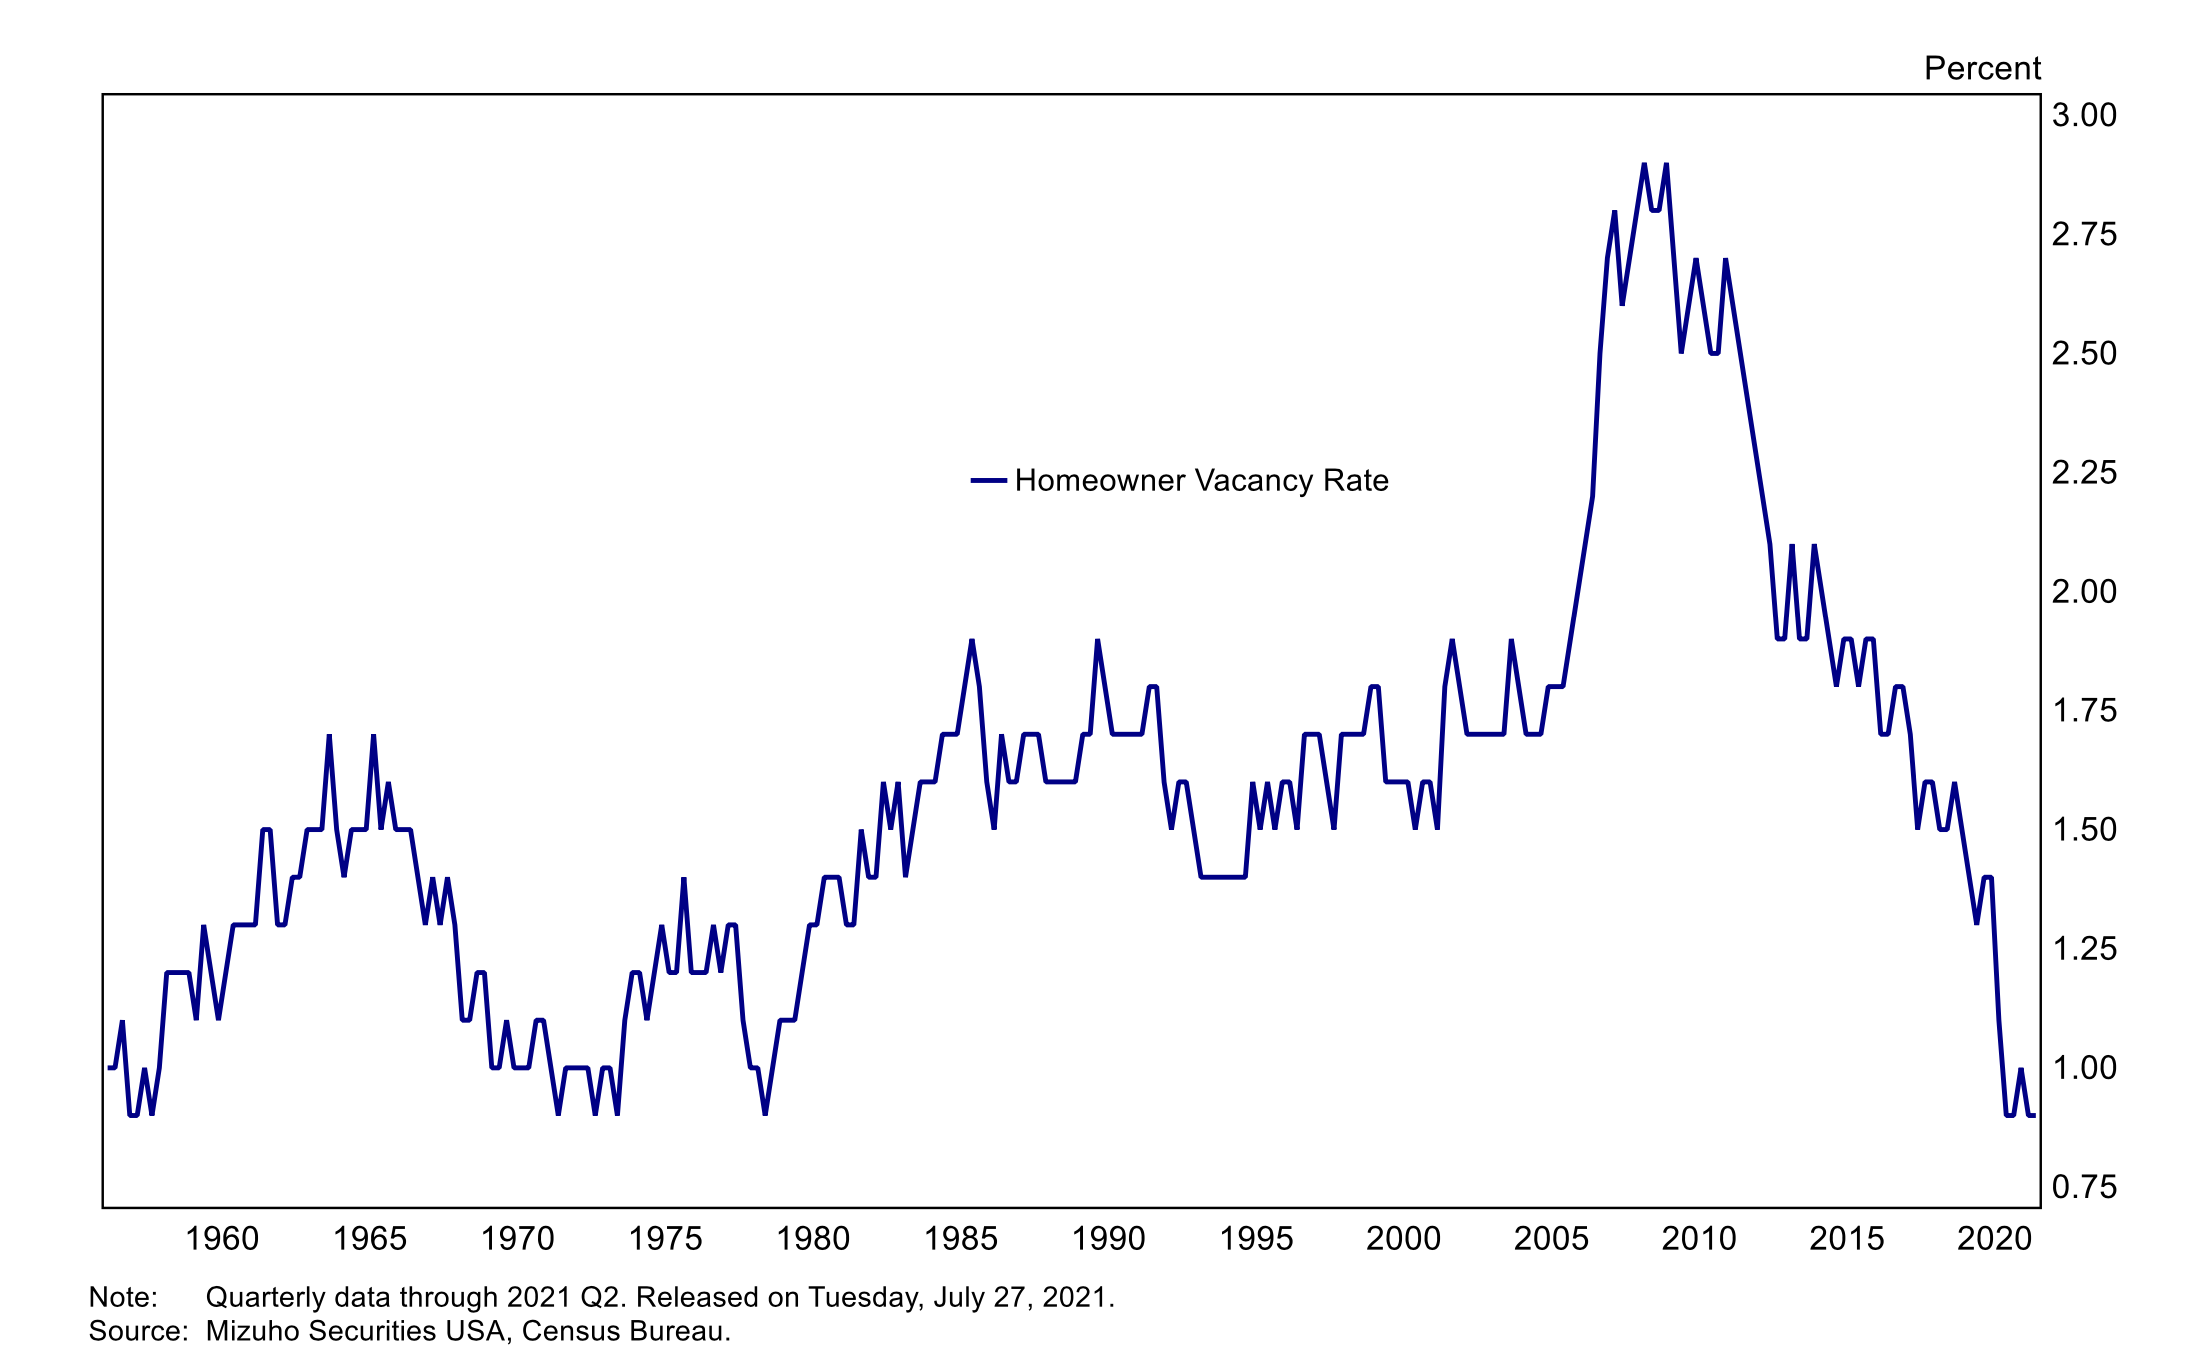
US Homeowner Vacancy Rate
- This rate has fallen to historic lows – a supportive and key variable for housing construction.
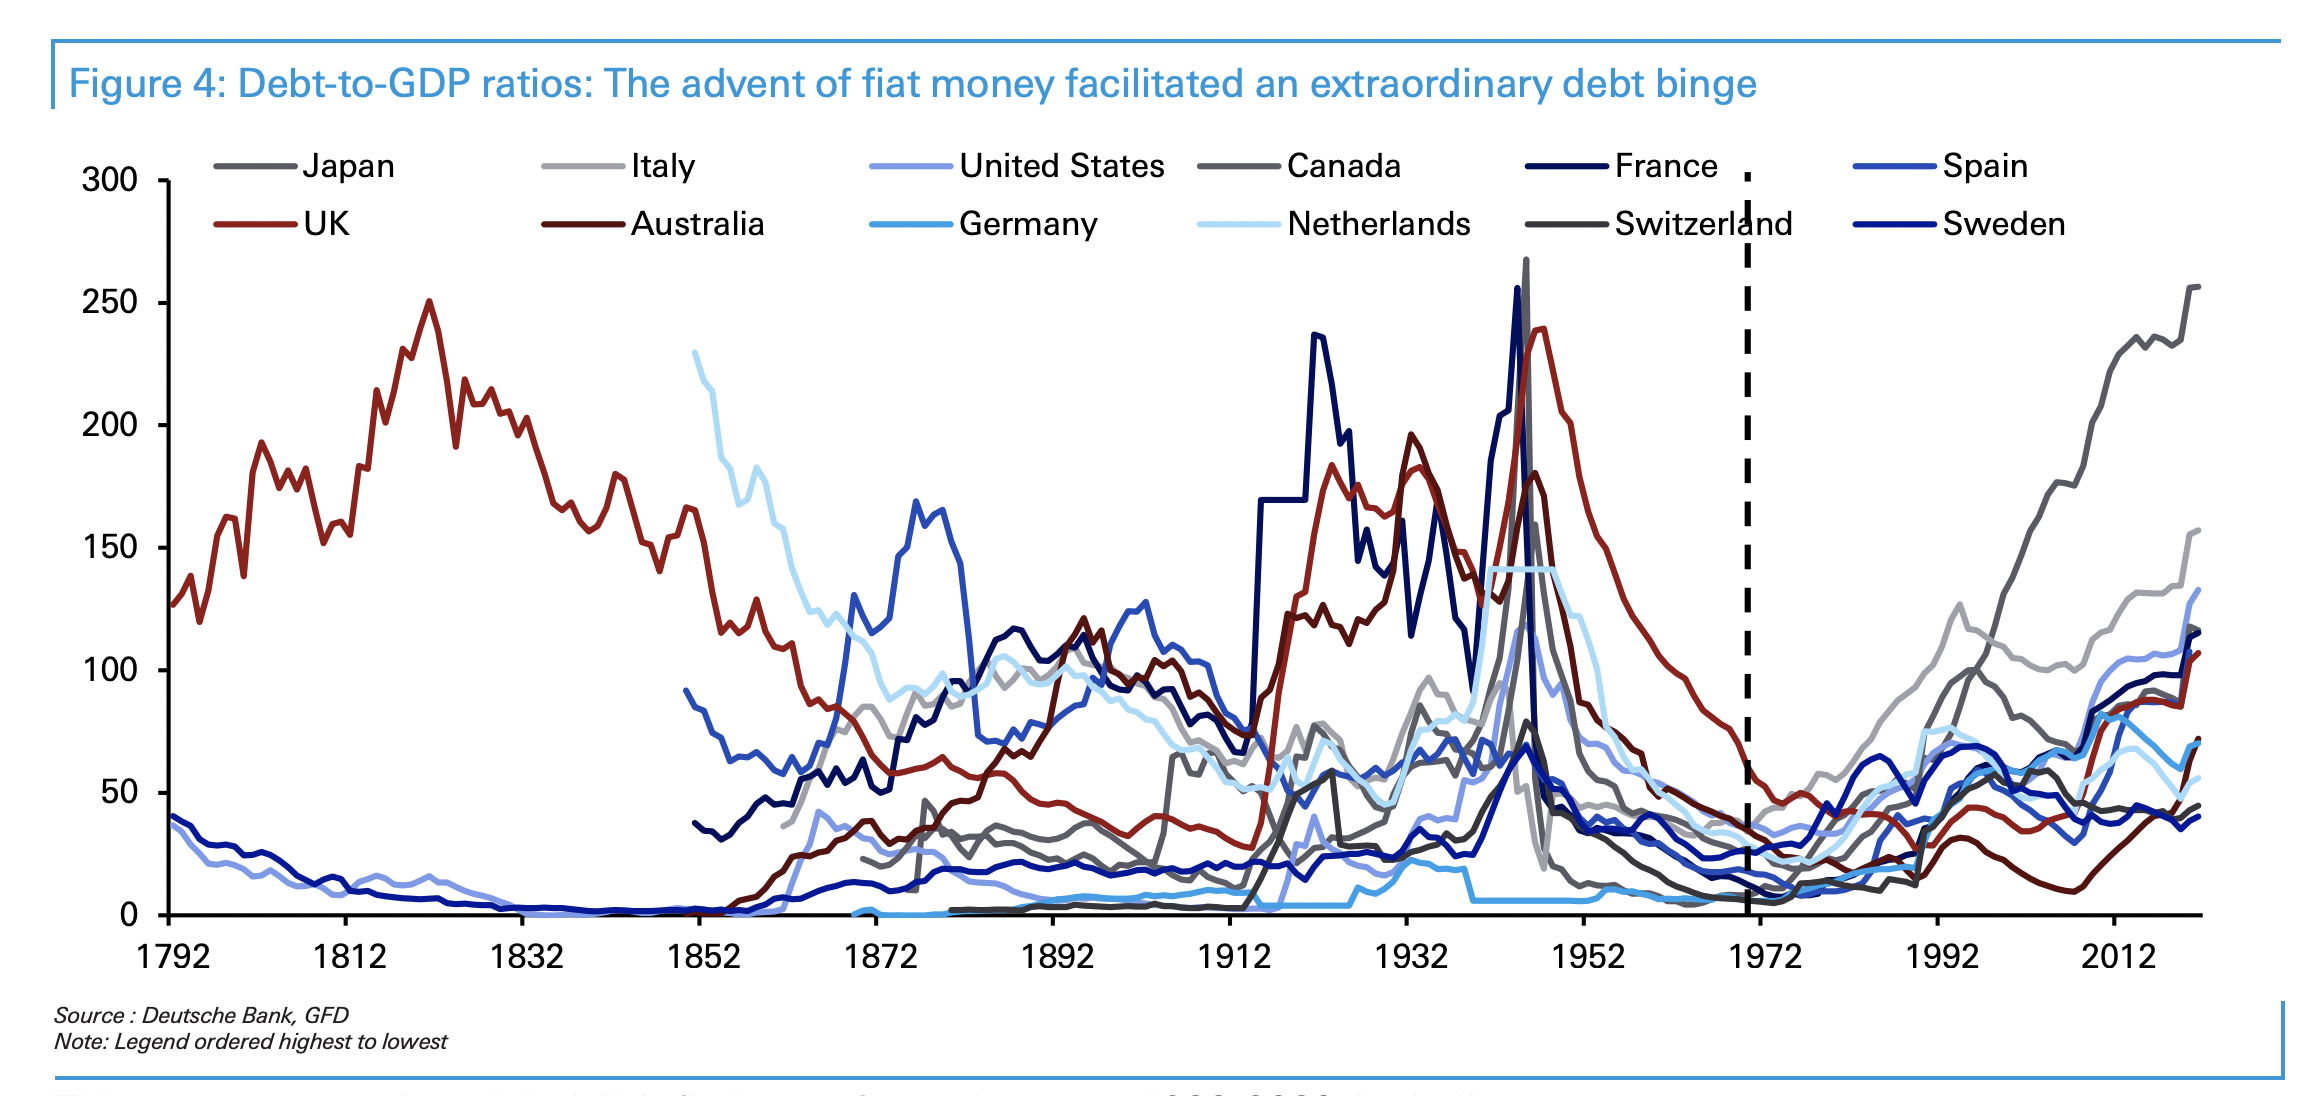
Debt Binge
- Fiat money era has led to a spectacular debt binge.
- A great long-term chart from Deutsche.
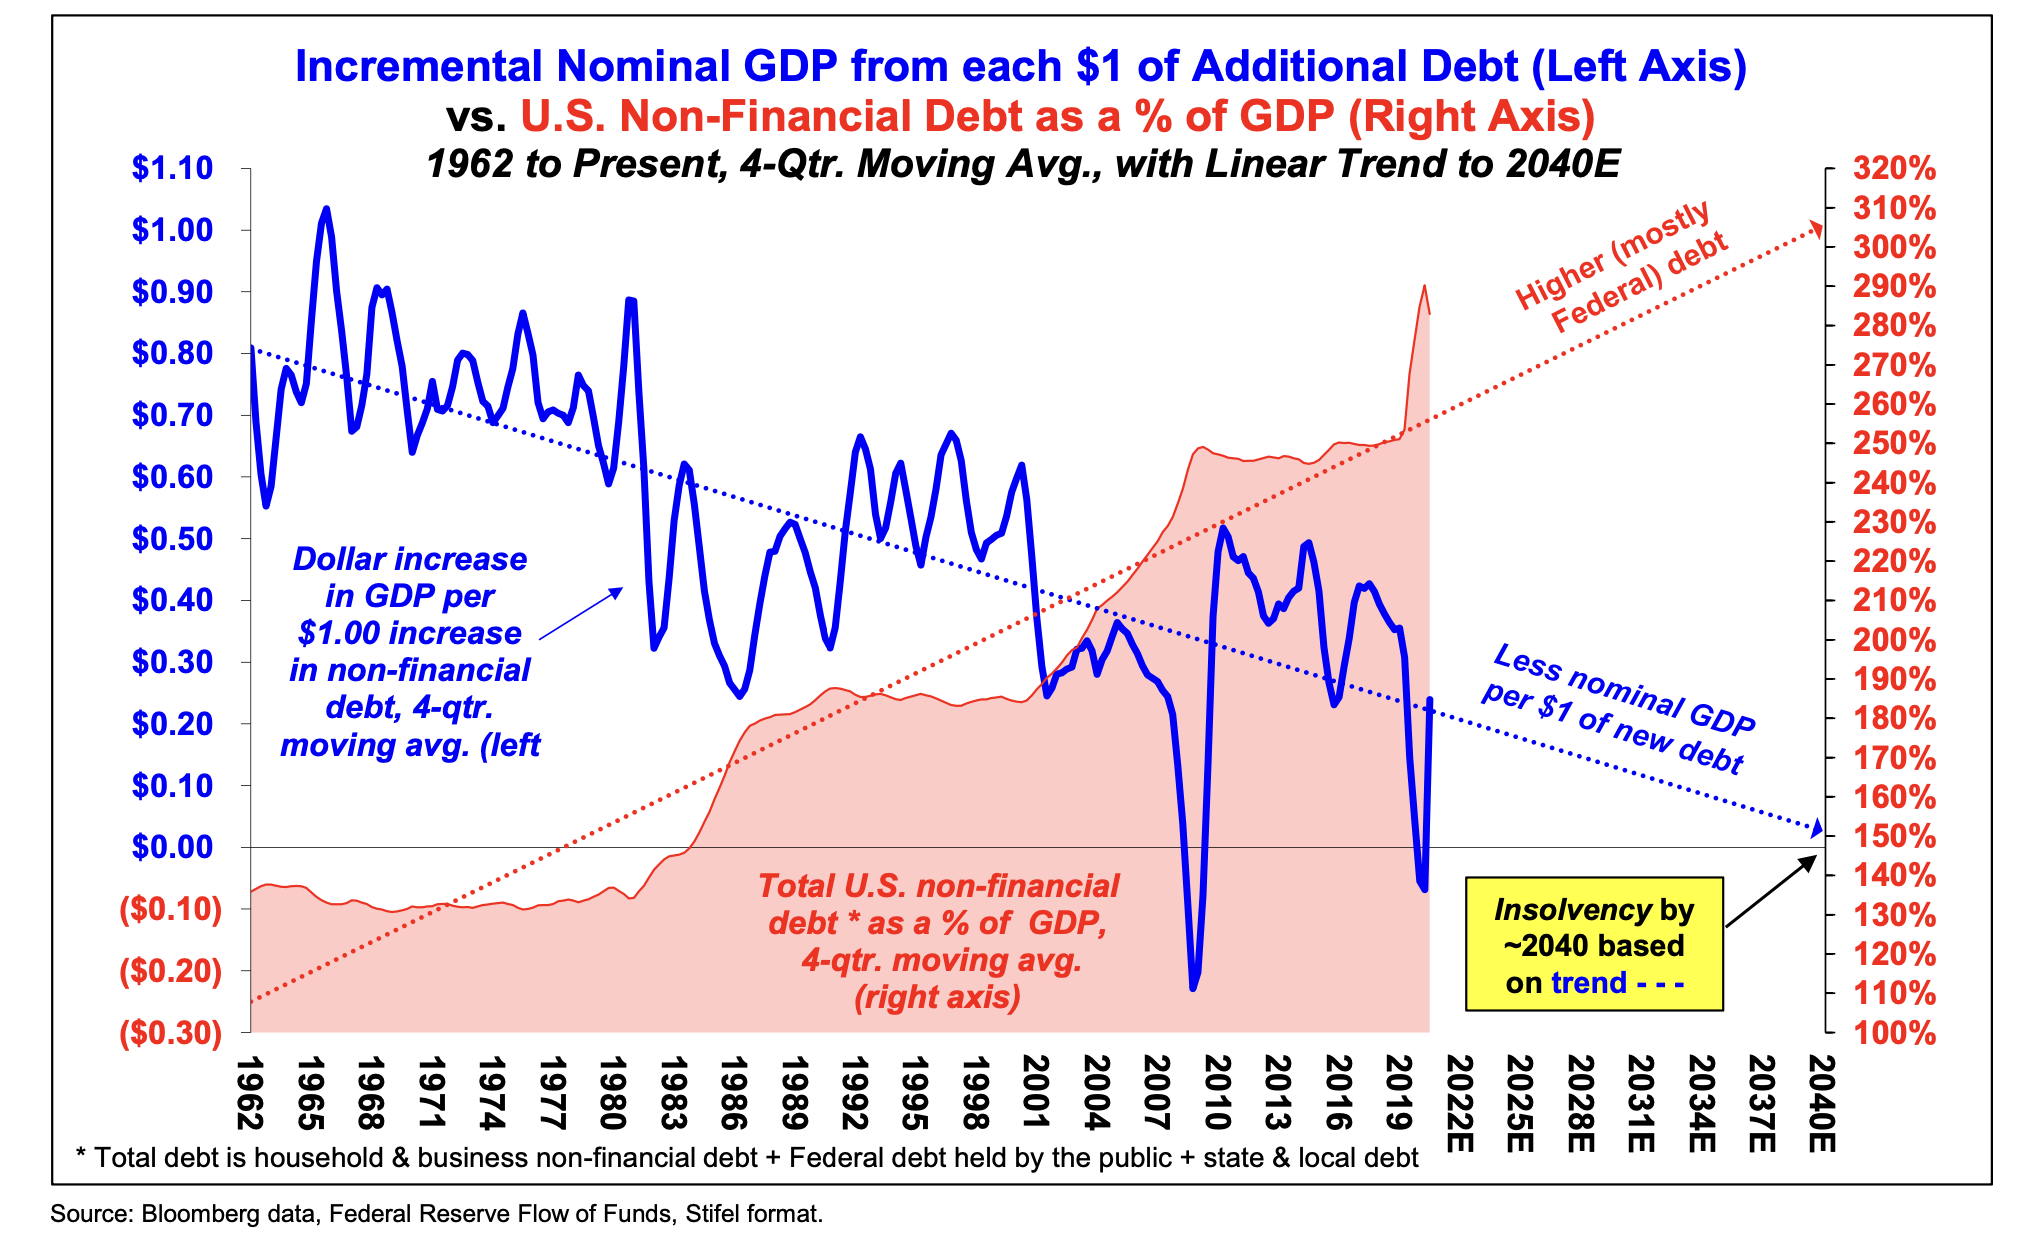
Debt Productivity
- Debt is becoming less and less productive, in terms of units of GDP added.
- Great analysis from Hoisington on the topic.
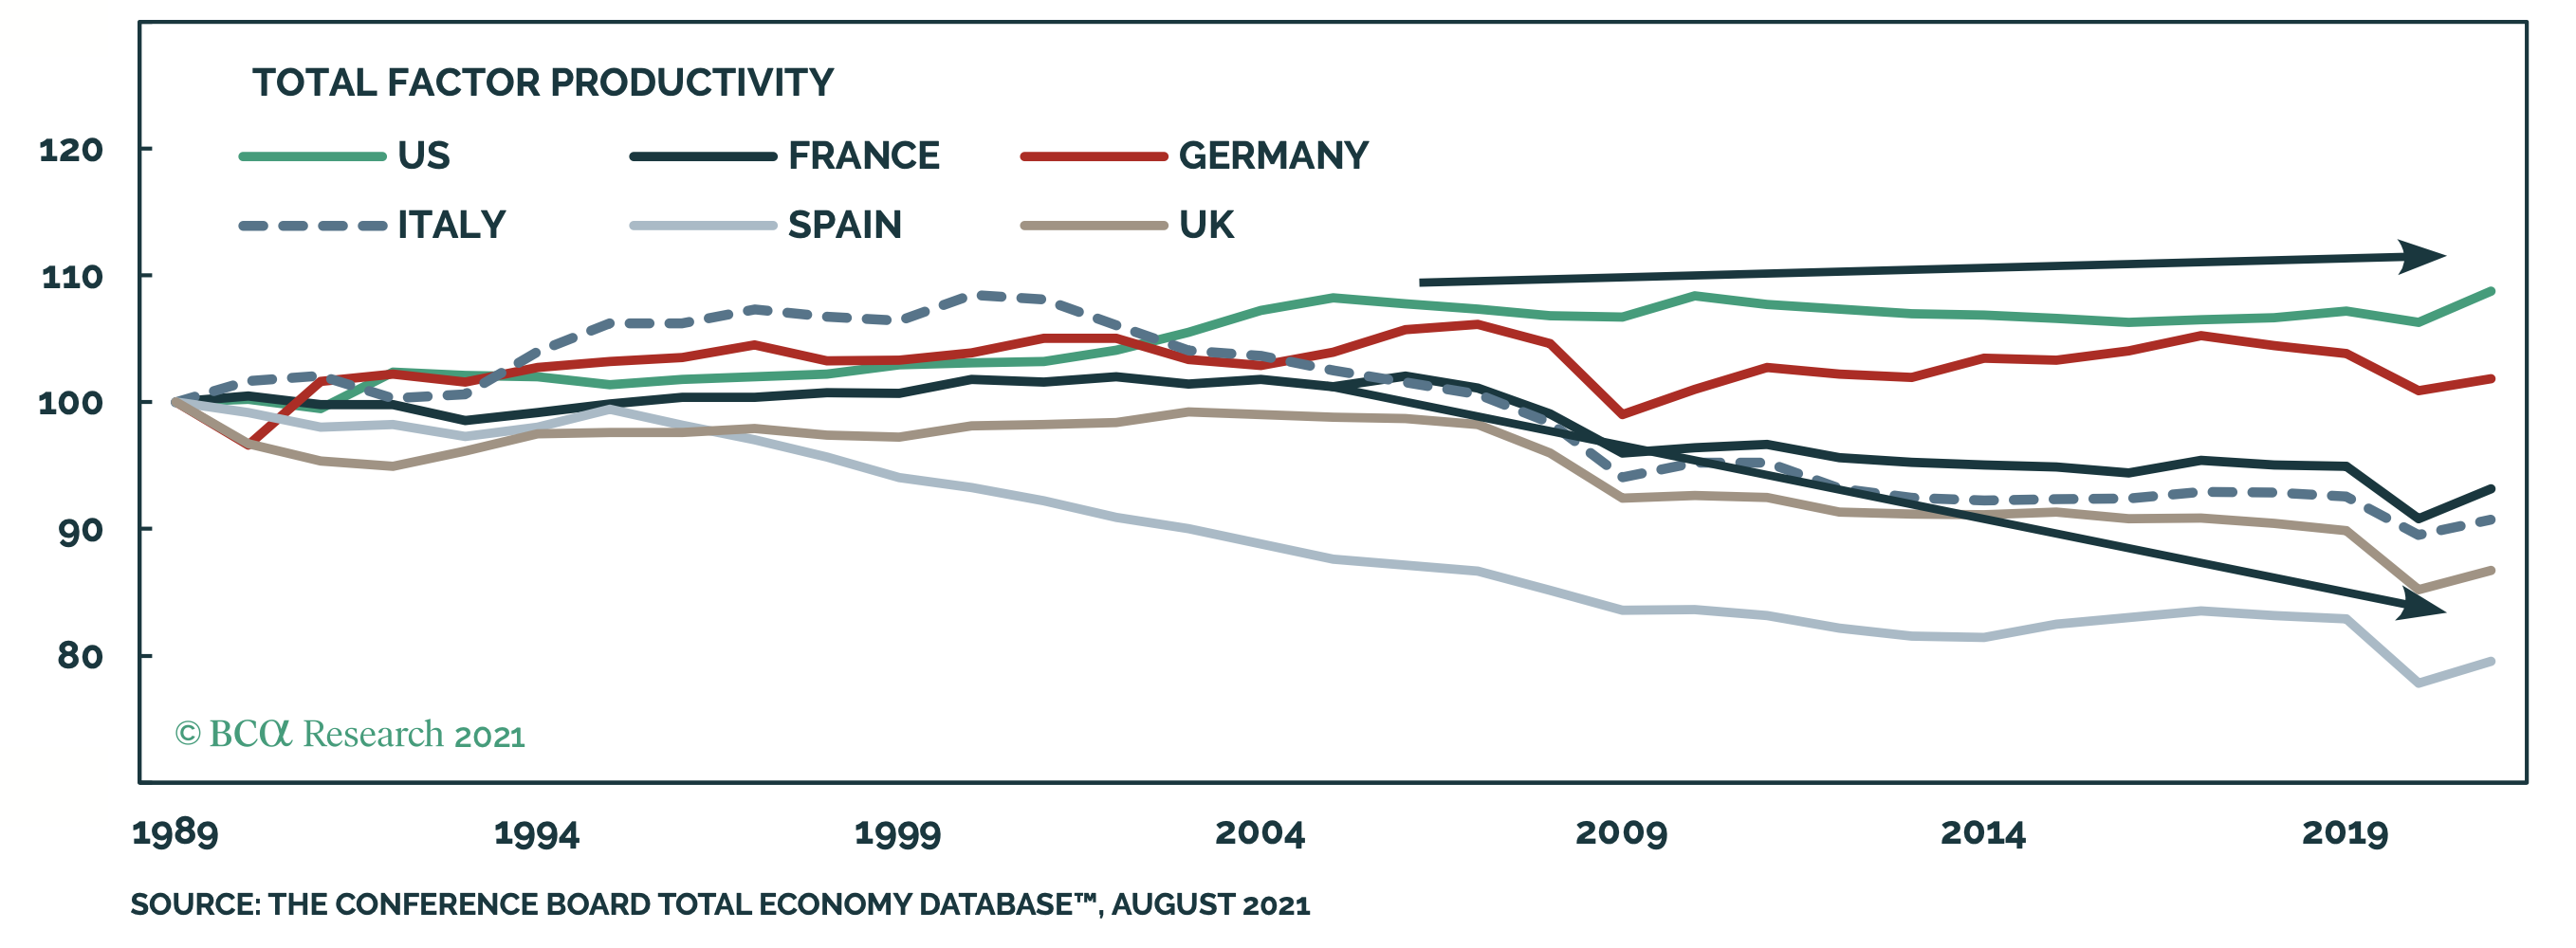
Total Factor Productivity
- Europe’s Total Factor Productivity (TFP), a key determinant of long term growth, has substantially lagged the US.
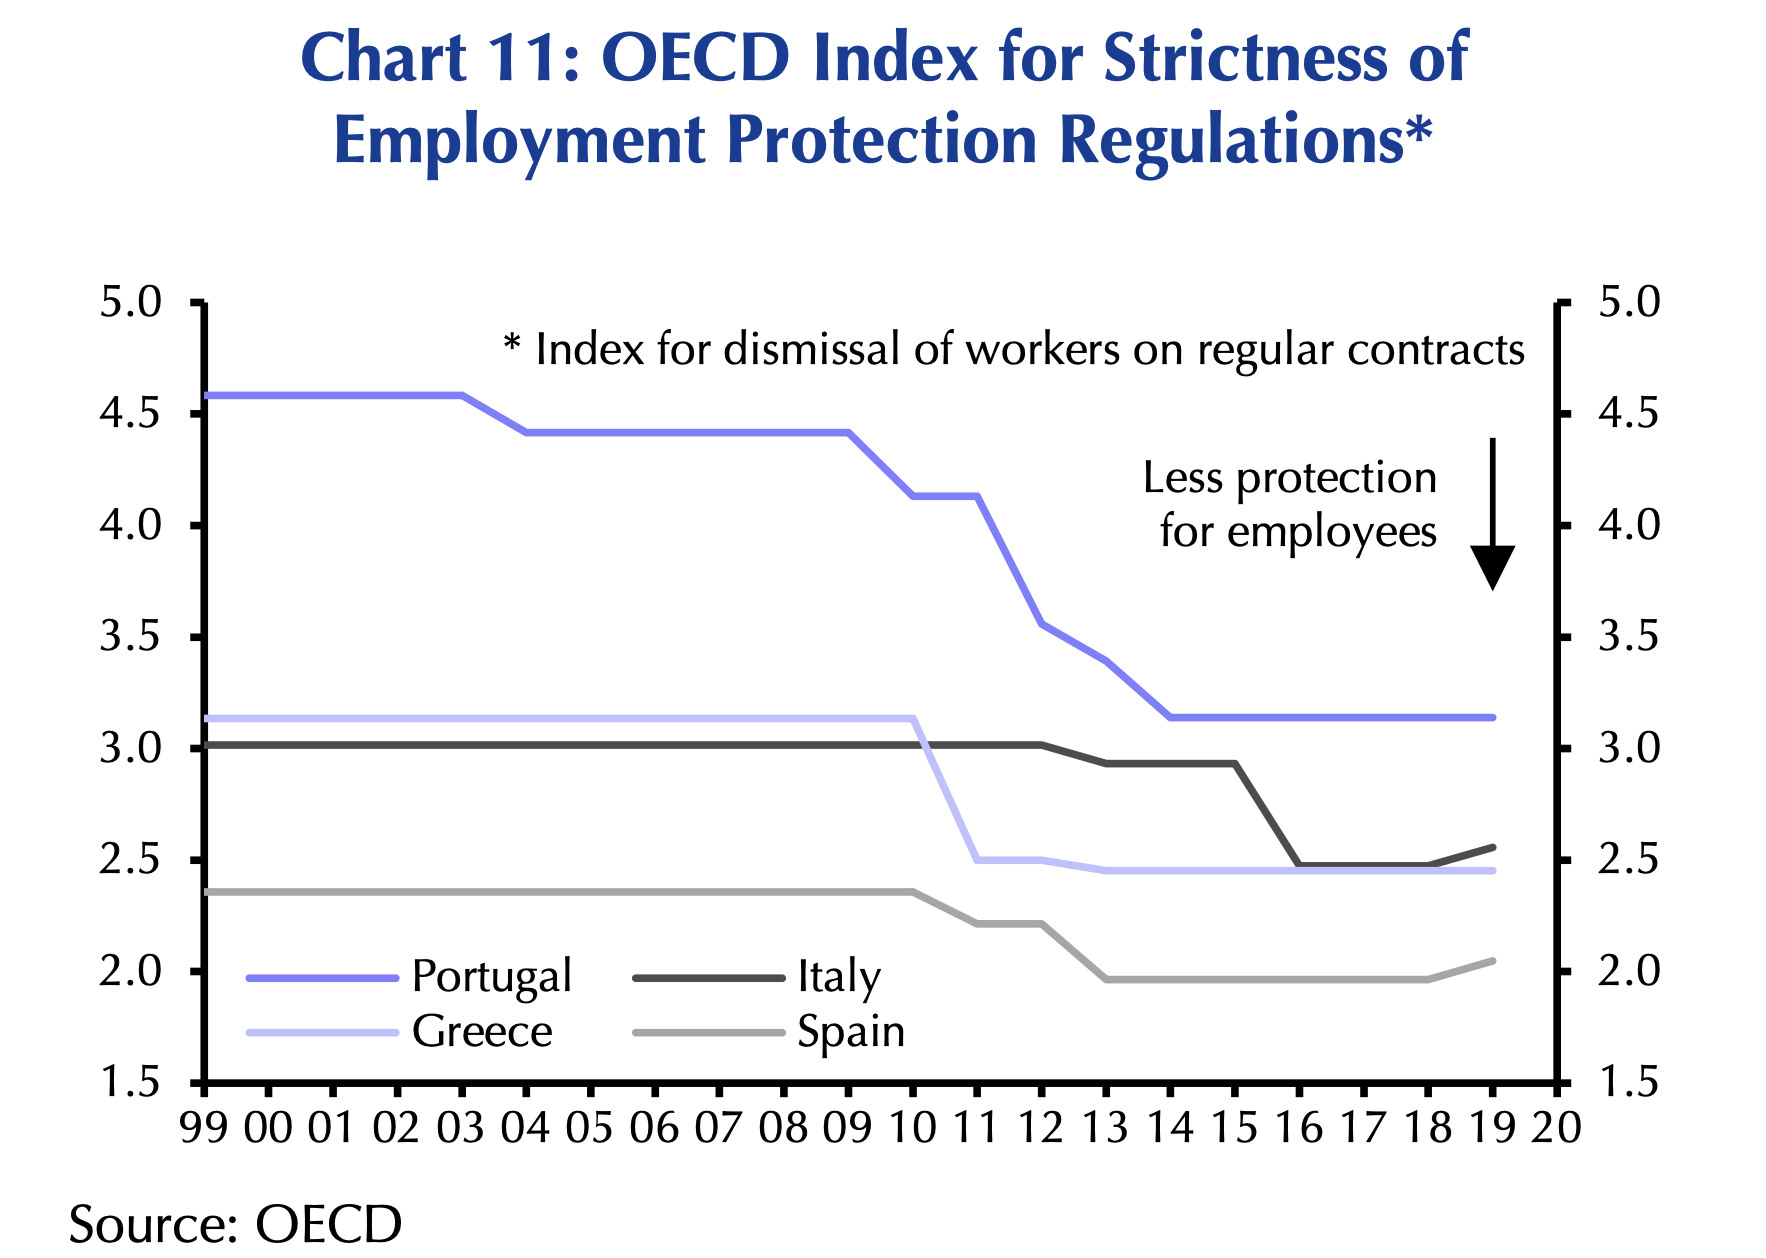
Southern Europe
- Southern Europe has been on a mission to loosen employment protection since the European crisis.
- h/t Capital Economics.
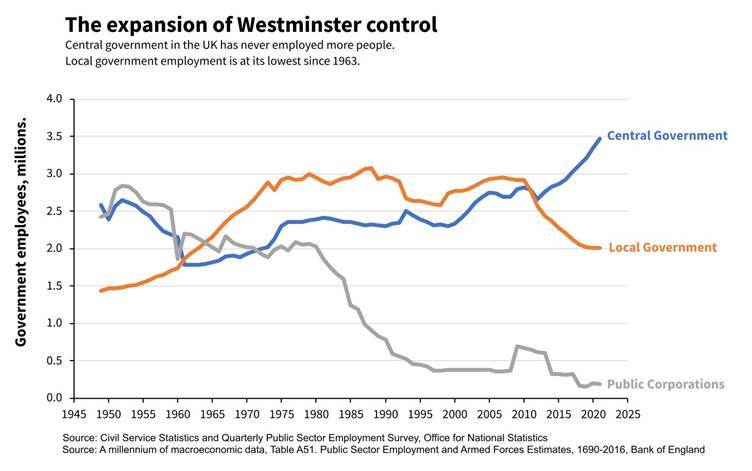
Central Government takes over
- Since the financial crisis the number of people employed in local government in the UK has been declining and currently stands at the lowest level since 1963.
- In contrast, central government employment is at a record high.
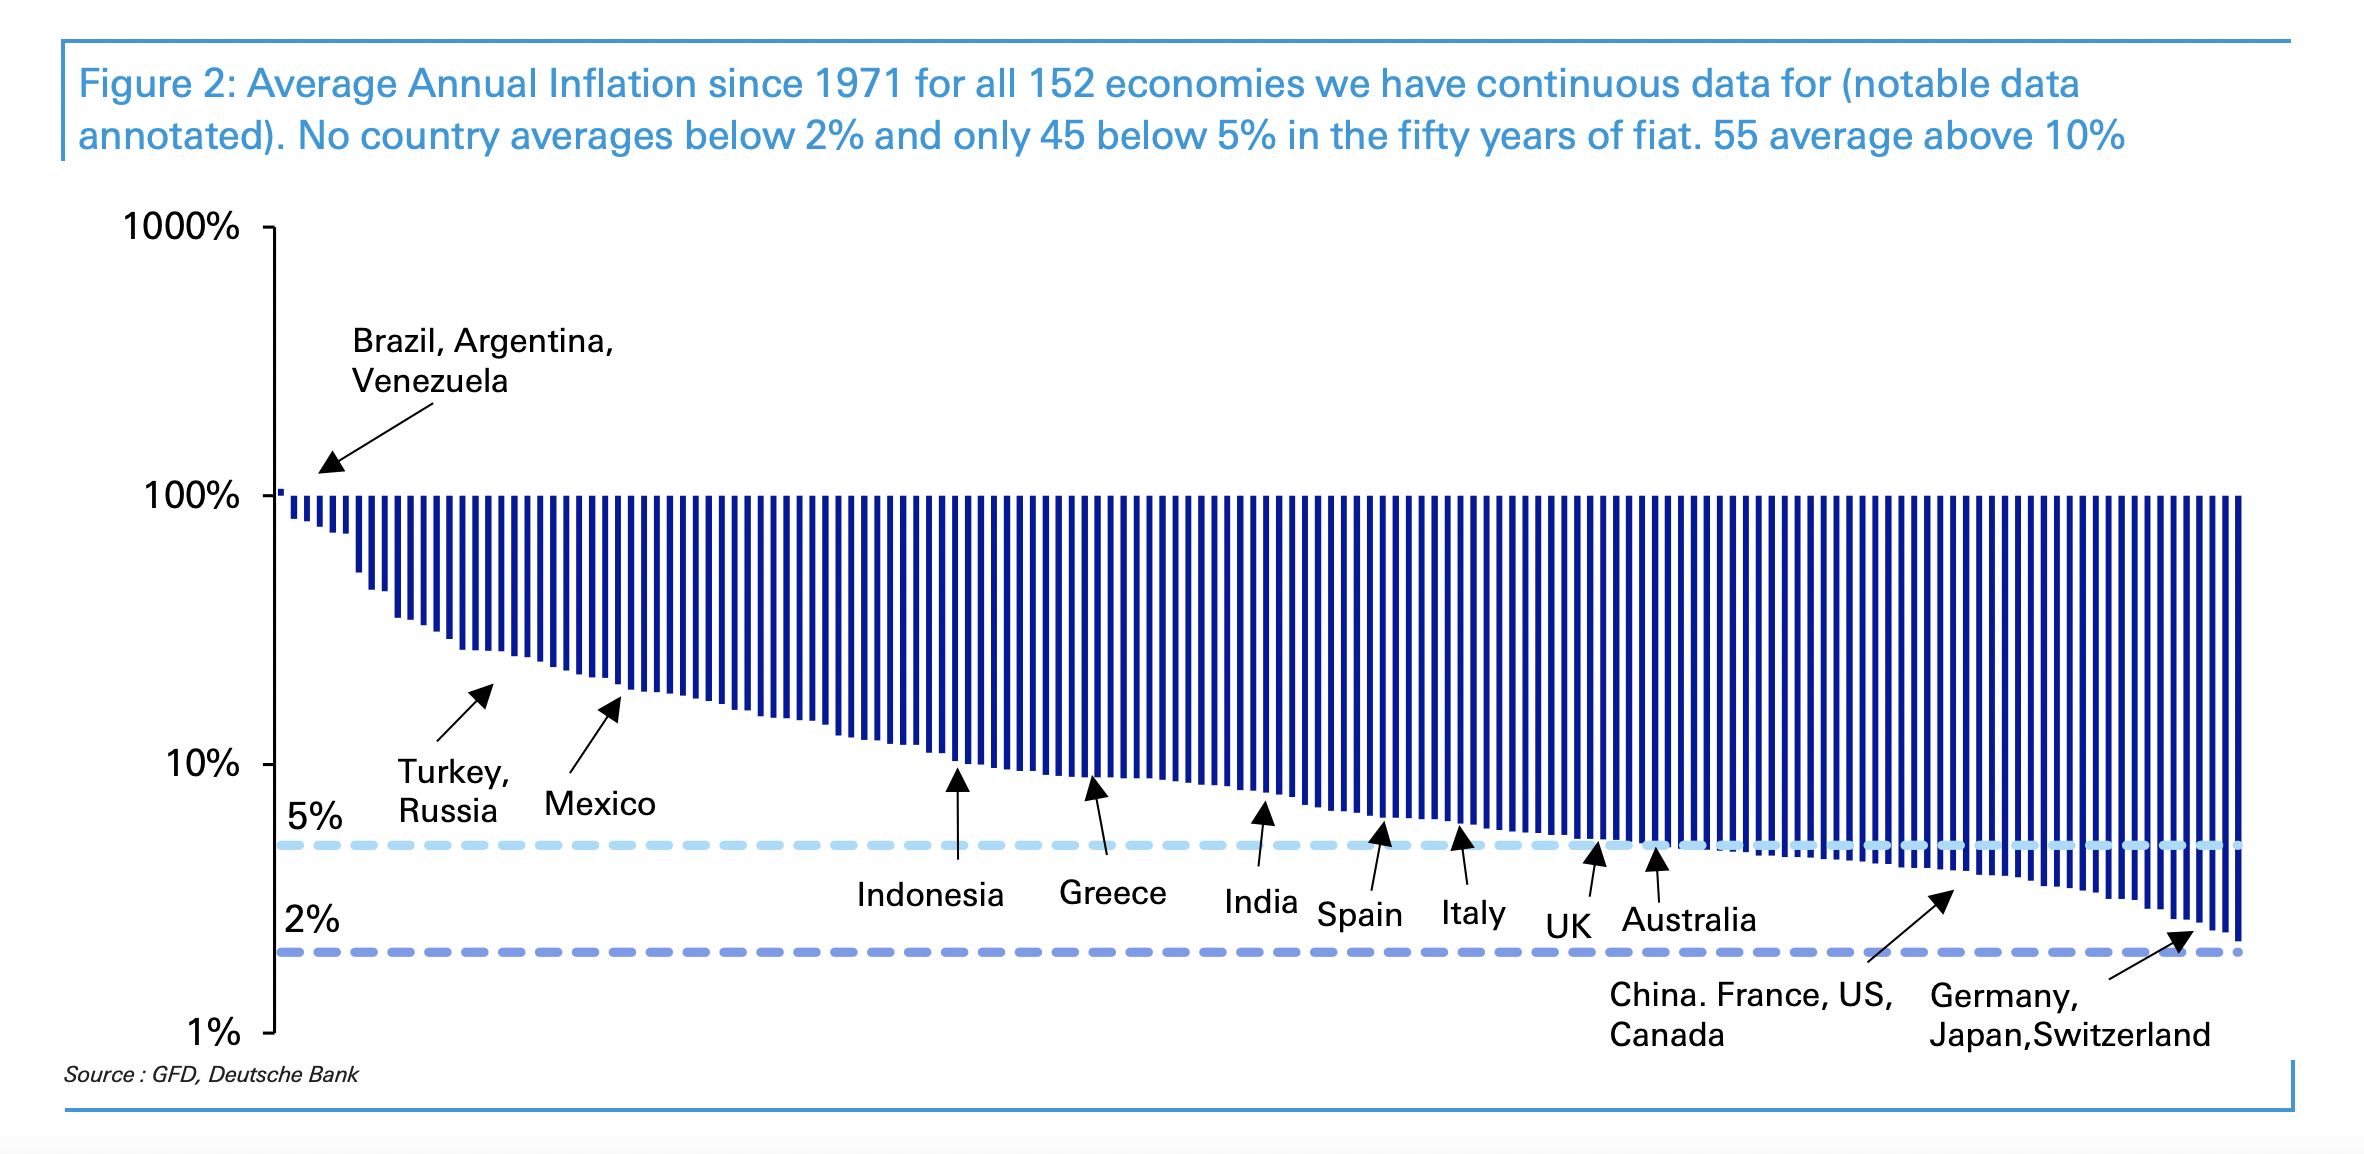
Average Long-Term Inflation
- Great chart showing average inflation since 1971 for 152 economies.
- There is no country that averaged below 2% in the period, and only 45 averaged below 5%.
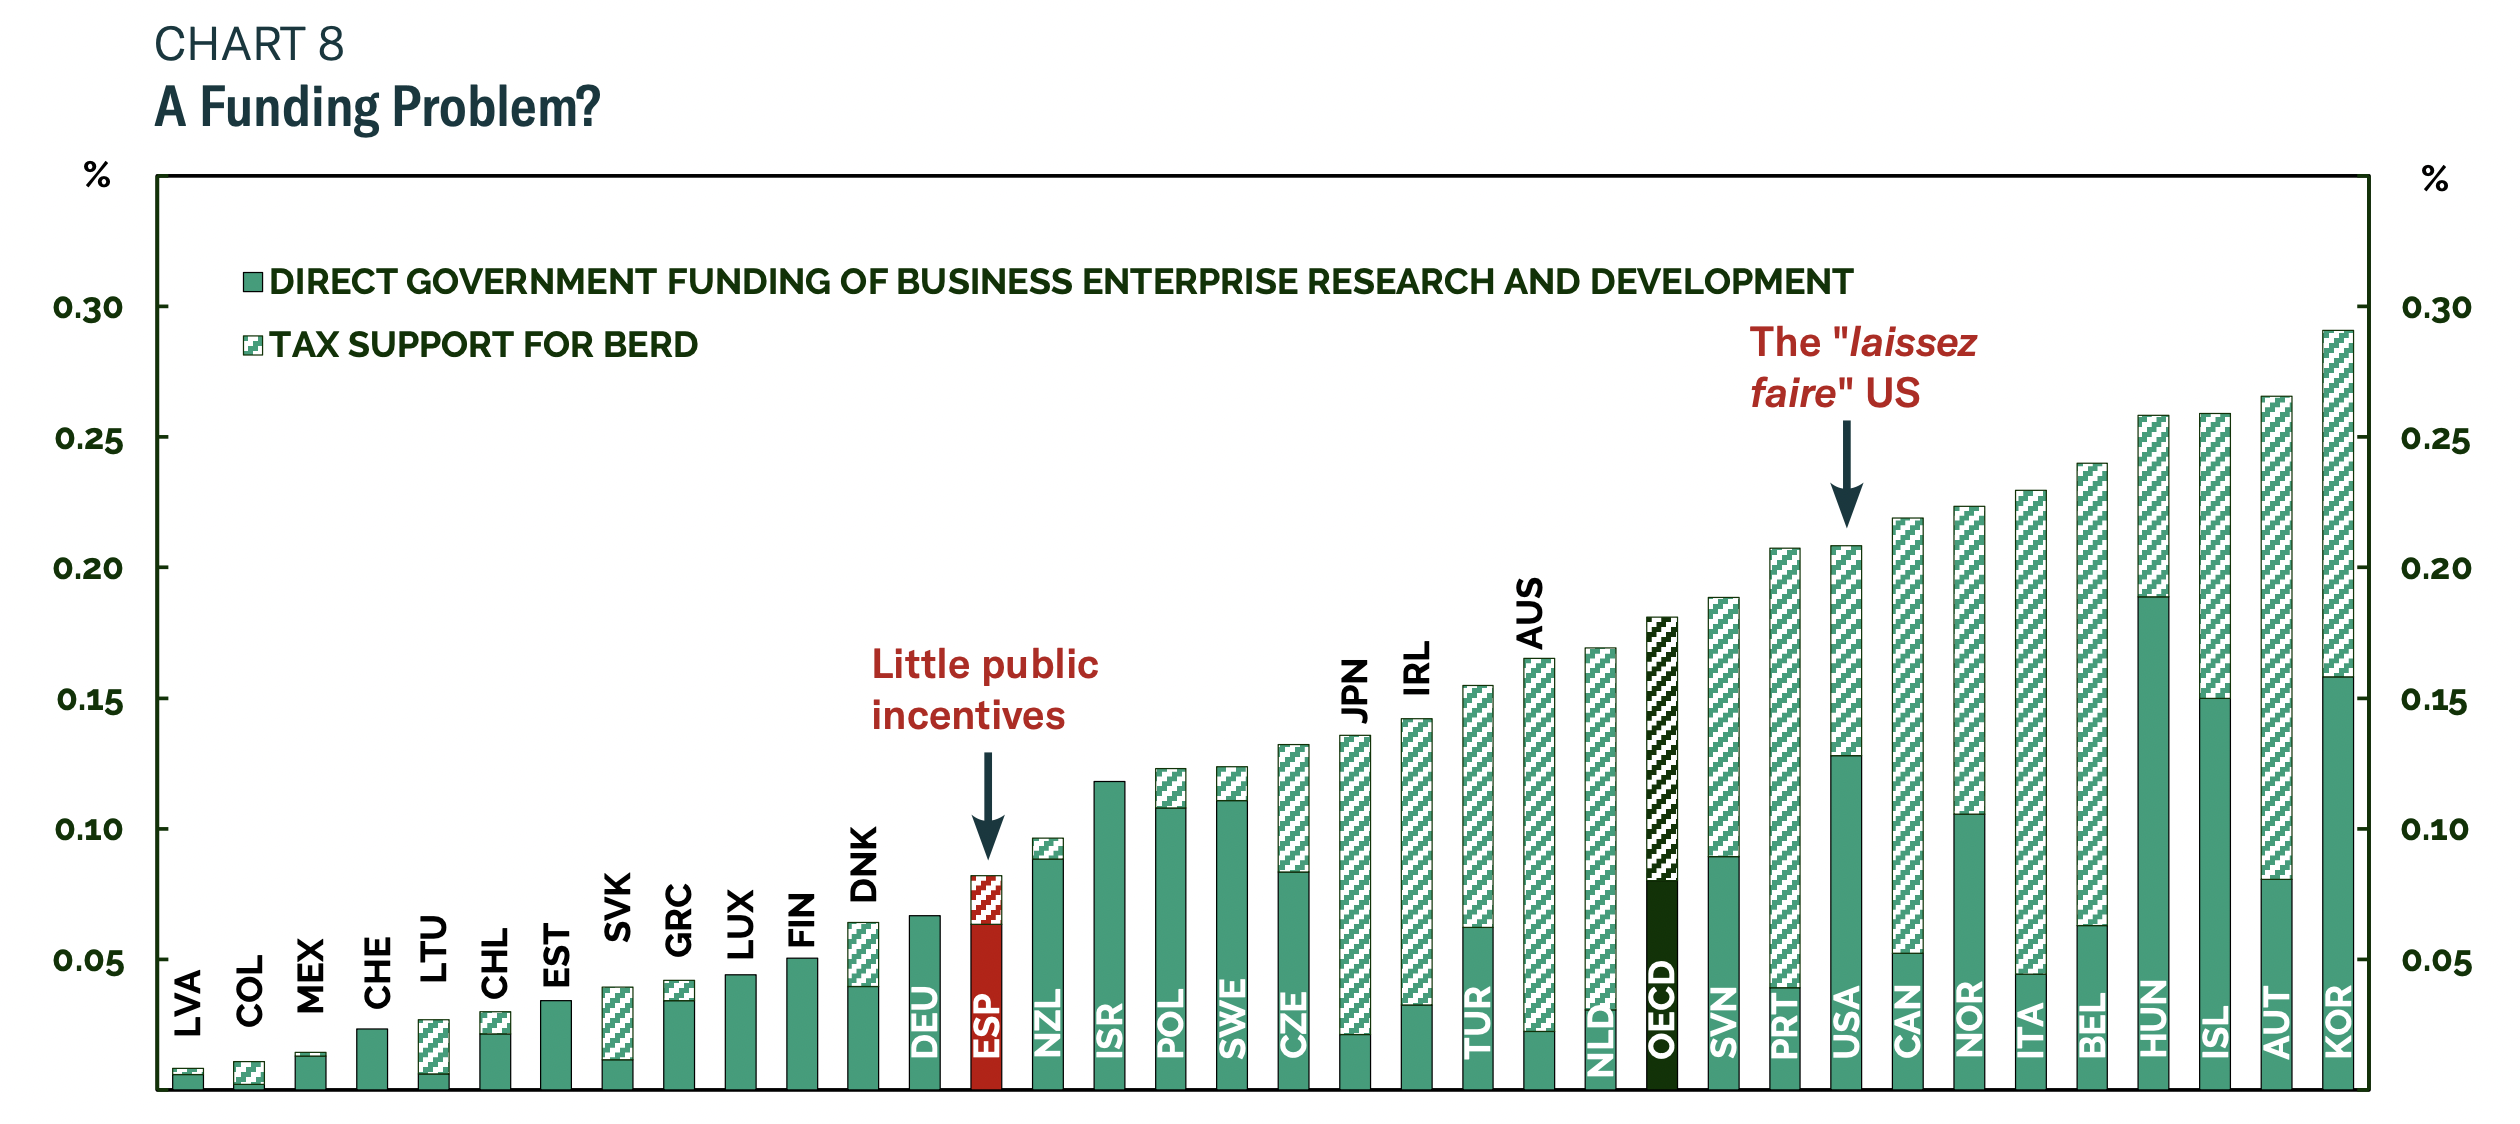
Government Funding
- Perhaps paradoxically, the US stands out as having a relatively high level of government funding for corporate R&D.
- Spain on the other hand is one of the worst in Europe.
- h/t BCA Research.
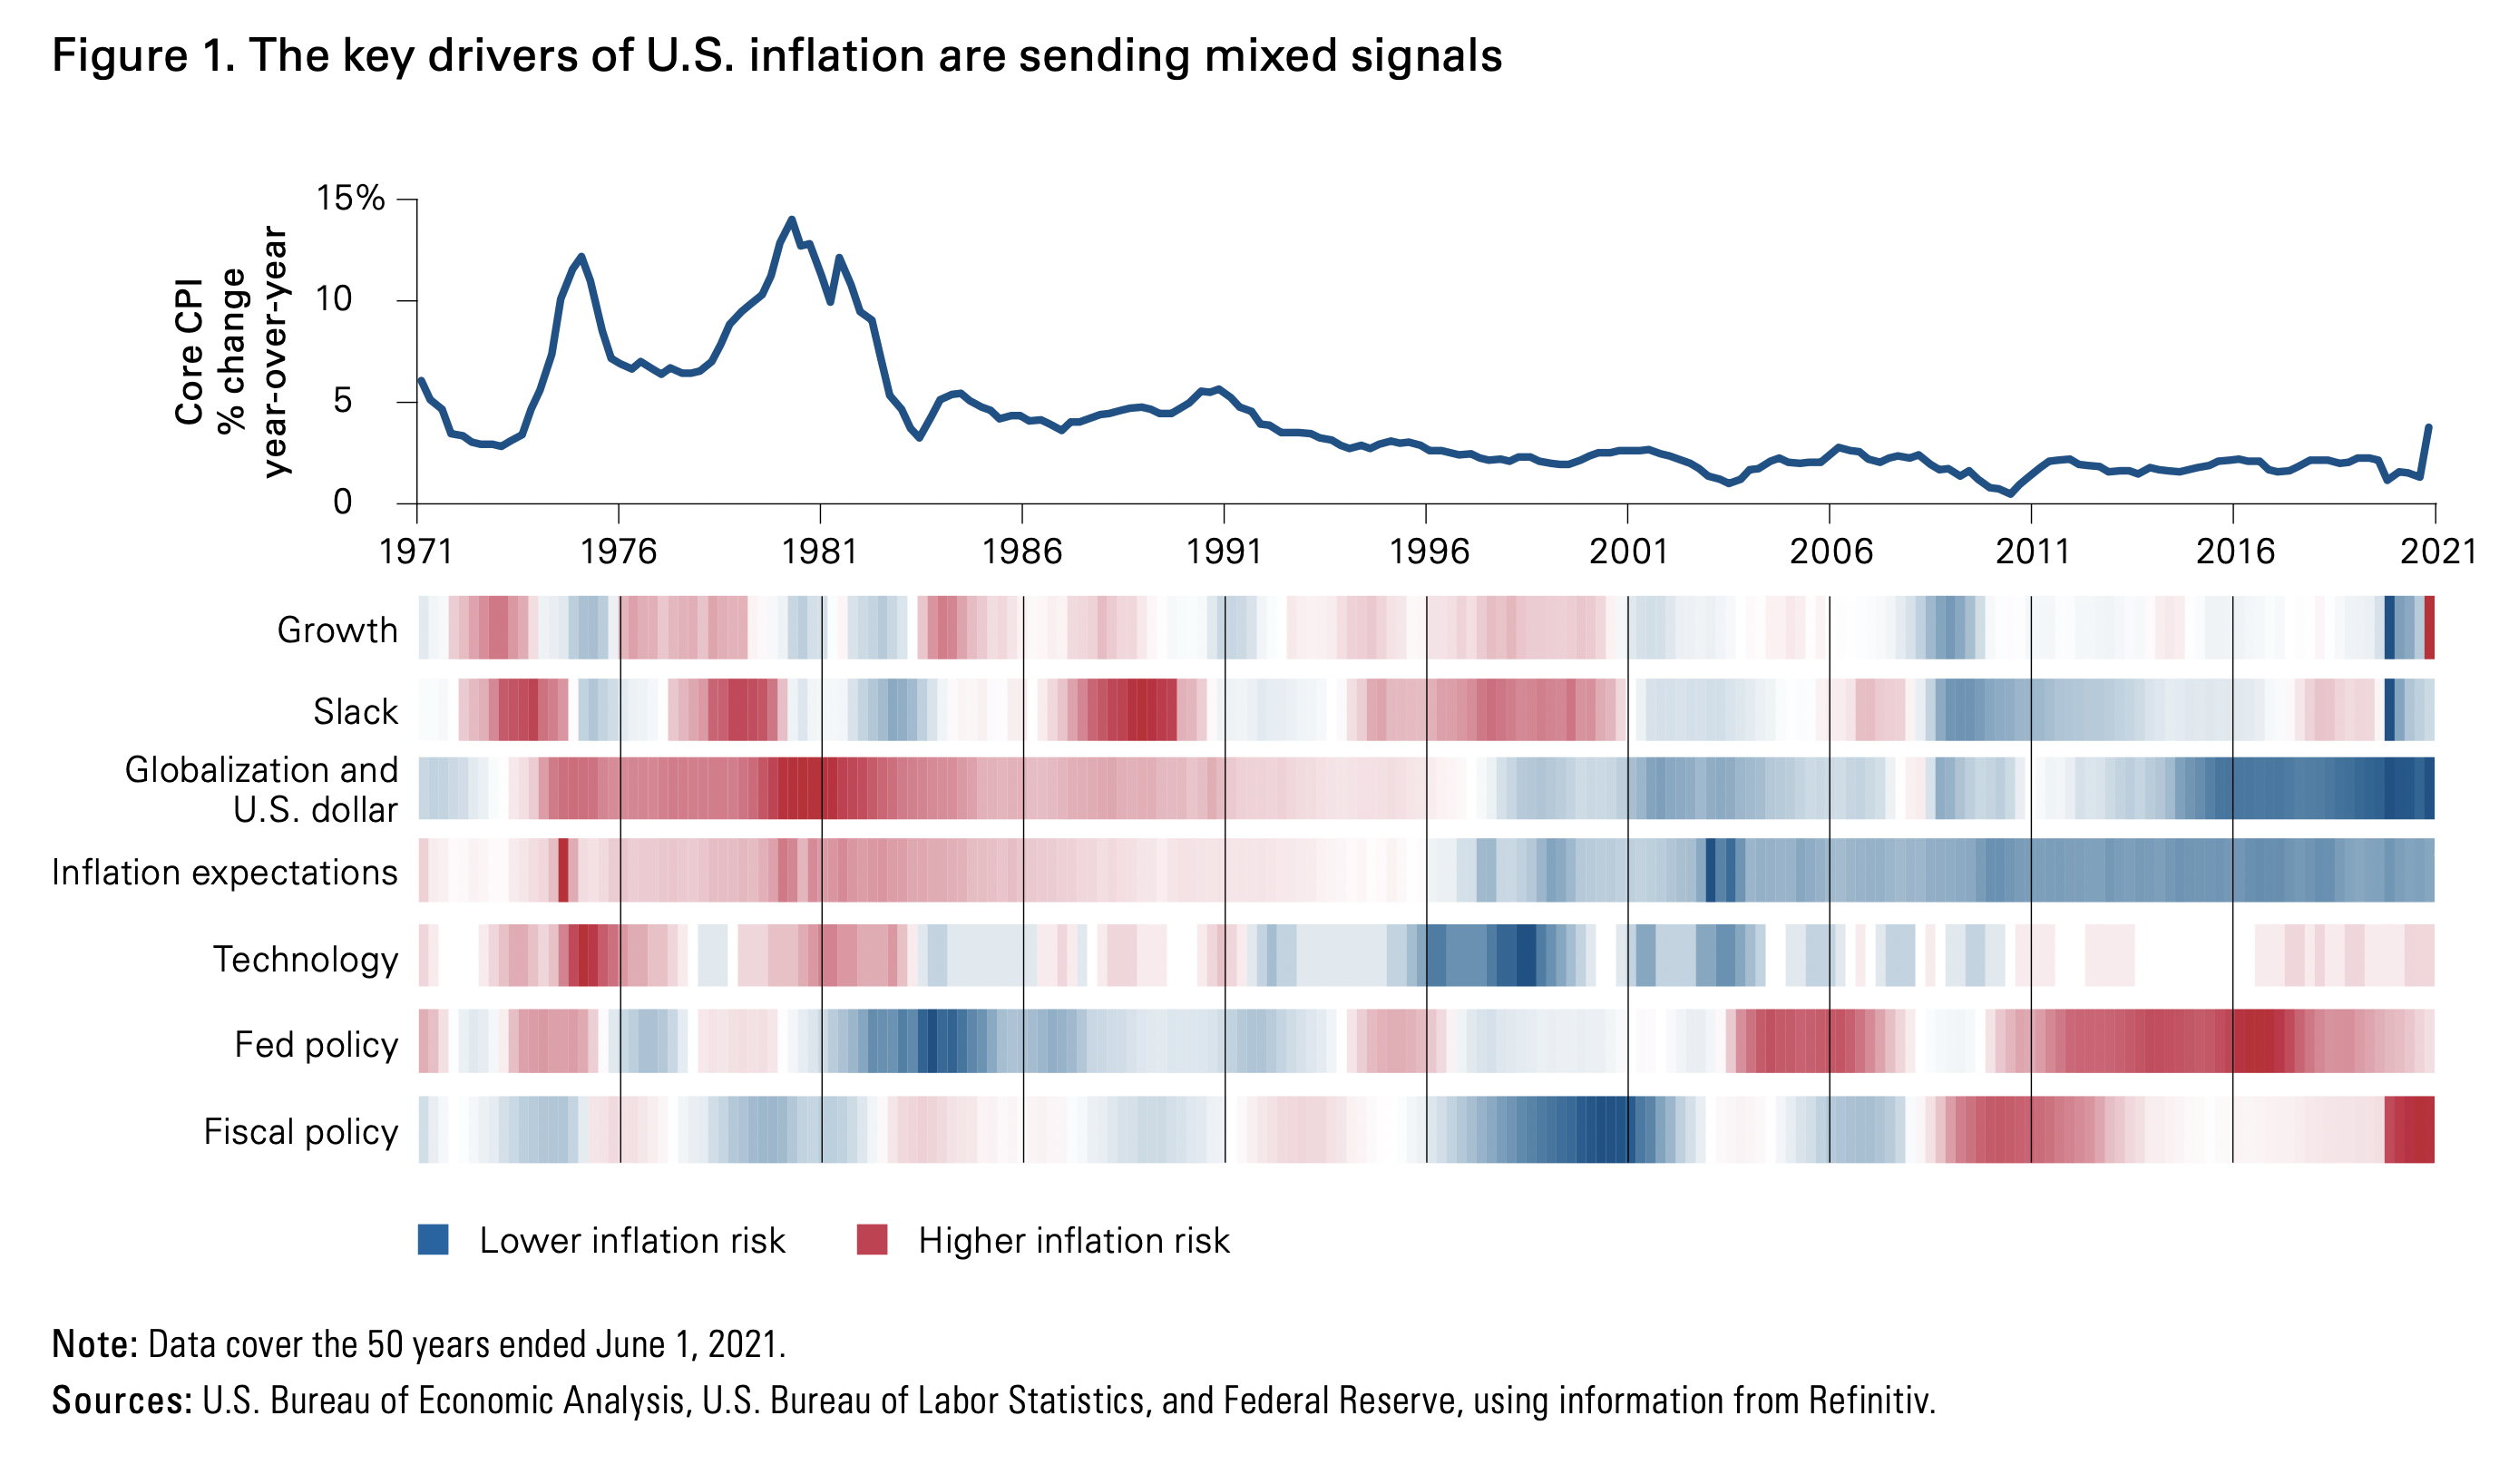
Inflation Tracker
- Vanguard produces a useful inflation tracker – highlighting key drivers.
- It is currently flashing mixed – growth and stimulative policy are pulling against deflationary technology and high unemployment.
- Interestingly, fiscal policy could continue to run strong driving 2022 inflation above 3%, an outcome not currently predicted by markets.
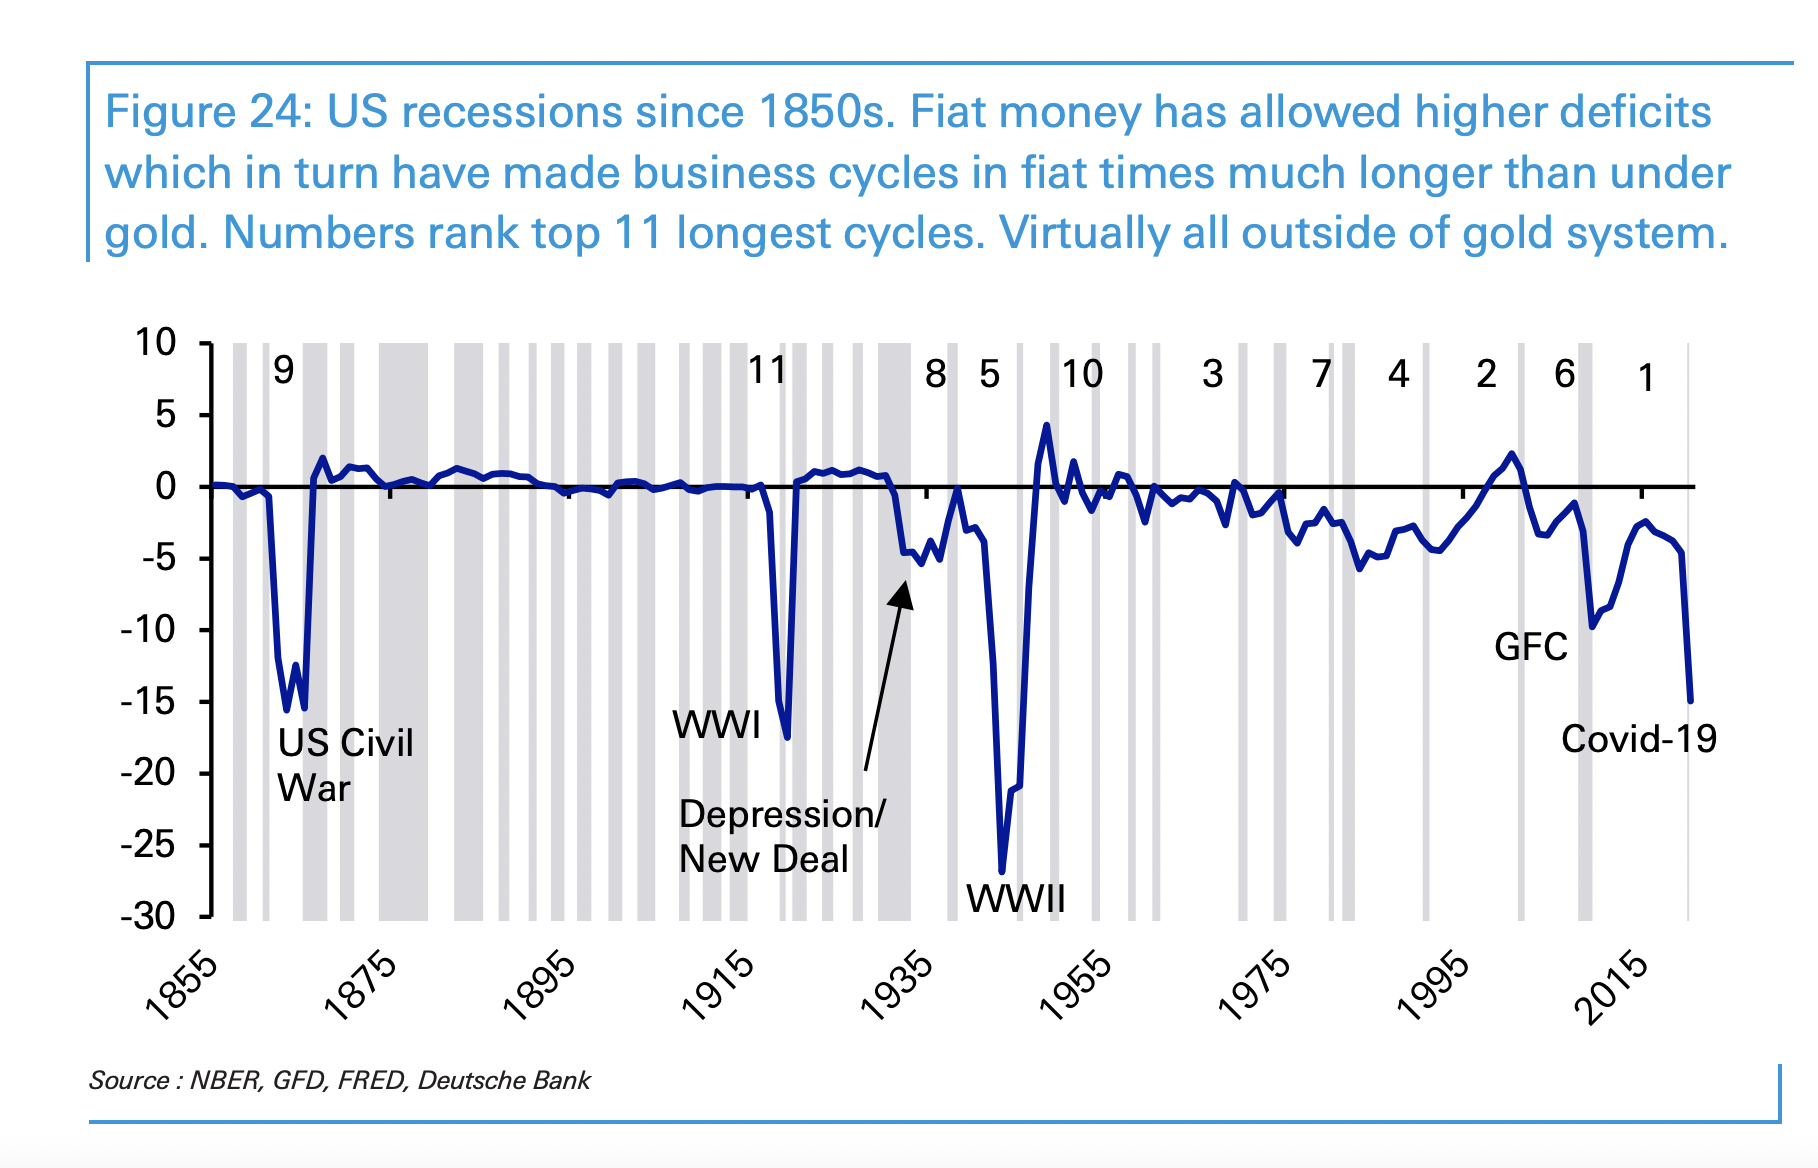
Fiat Money and Recessions
- Long-term chart from Deutsche Bank’s Annual Asset Return Study.
- It suggests that since the introduction of fiat money, cycles have become a lot longer.
- Of the top 11 longest cycles since 1850, all but two are post the abandonment of gold standards.
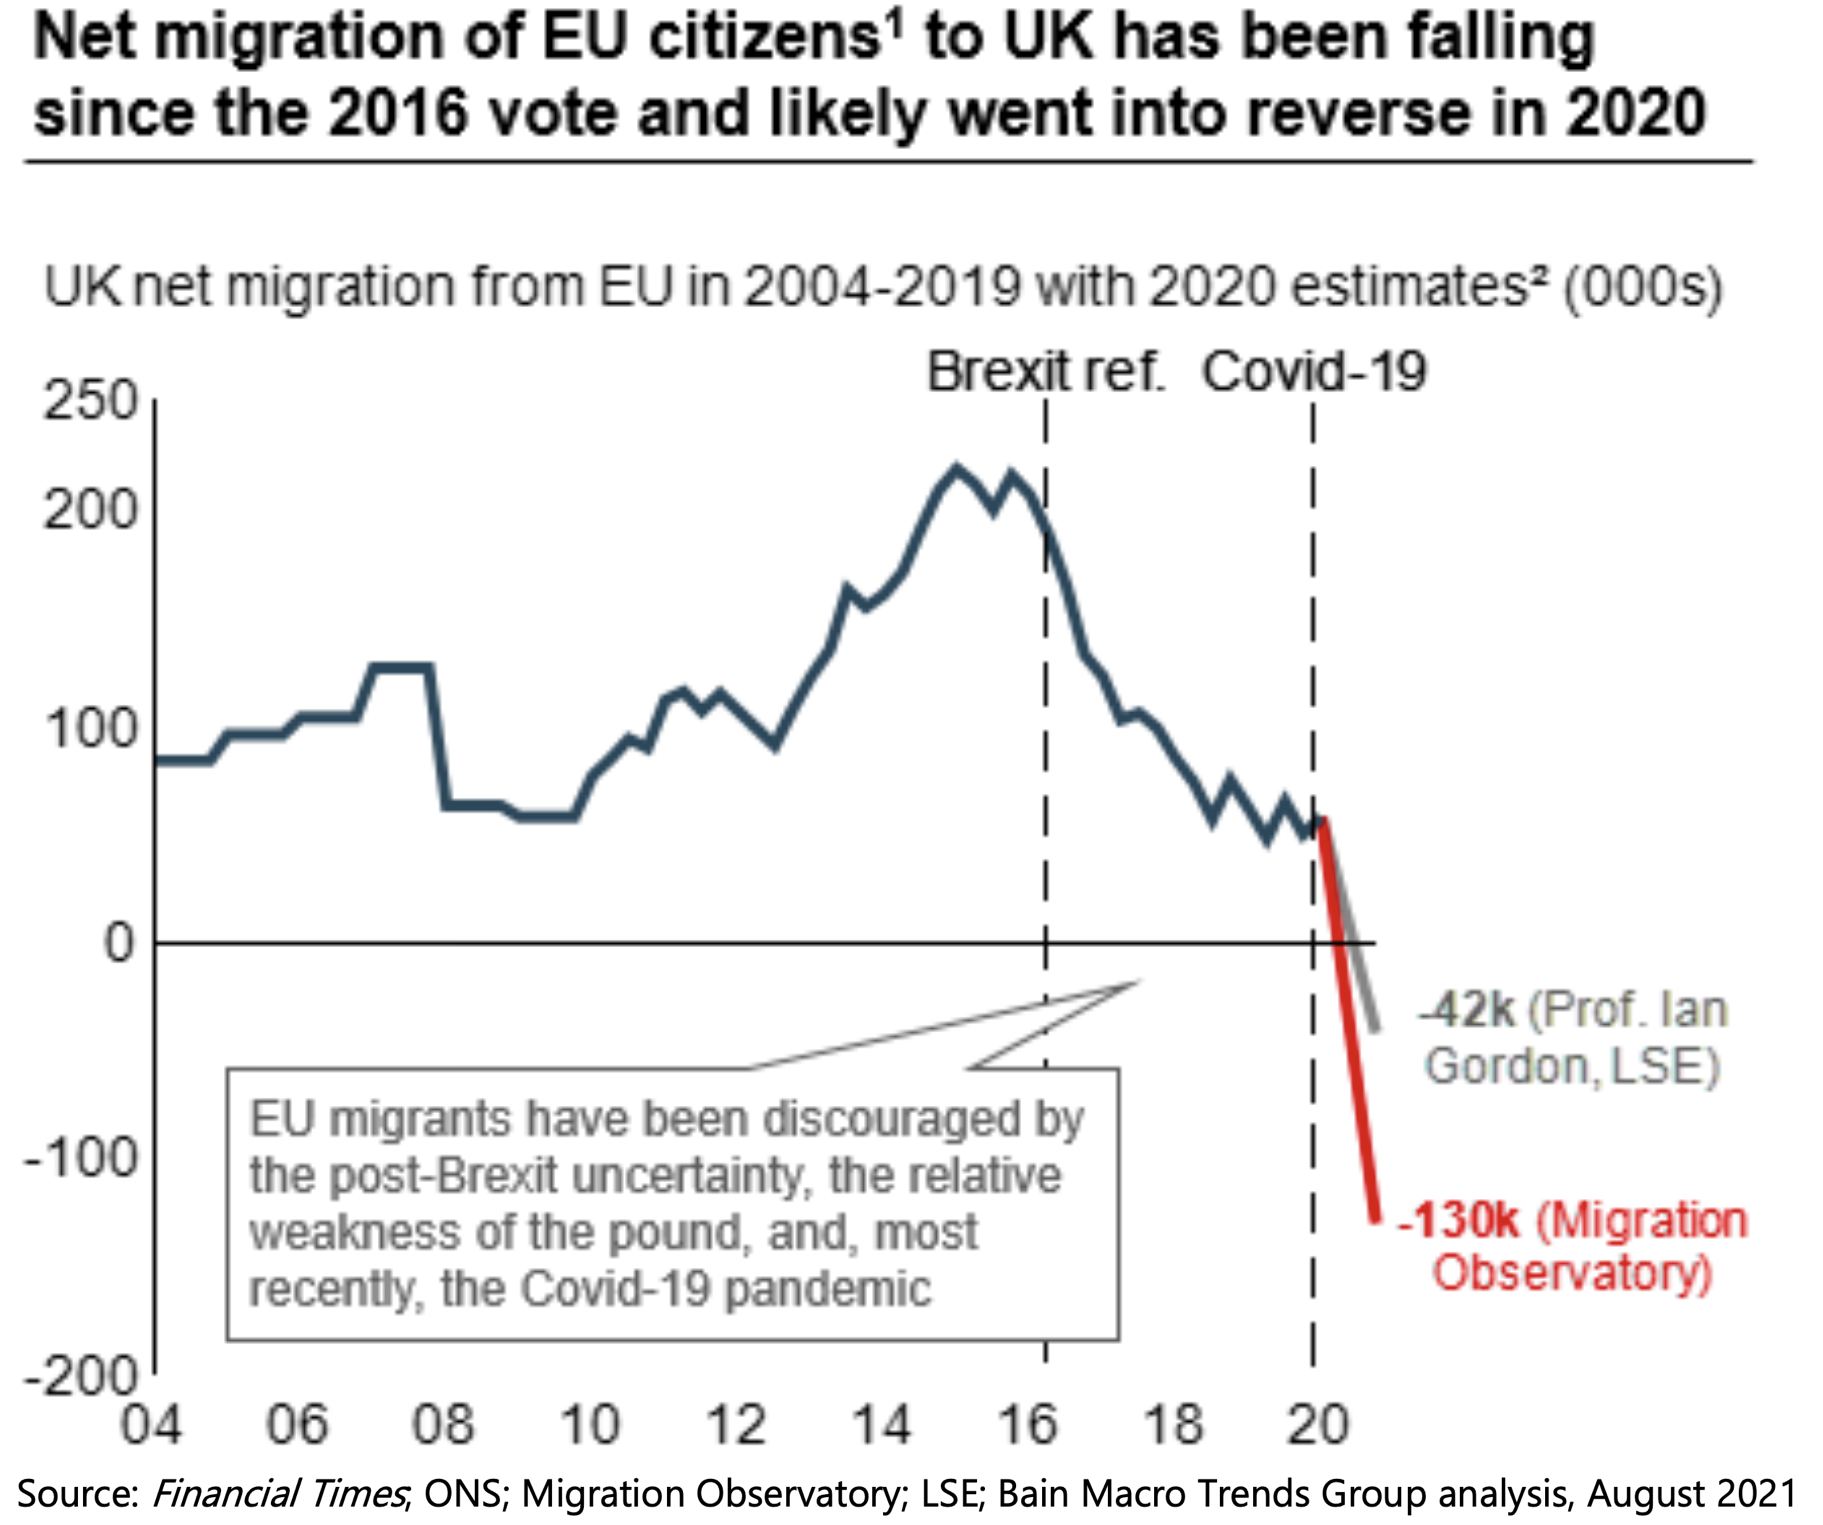
Net Migration EU to UK
- Since 2016 net migration from the EU to the UK has fallen.
- The pandemic has likely pushed it into negative territory.
- Certain sectors – like hospitality, transport, manufacturing, administration and construction – will be hit the hardest as they rely on EU labour for 10-15% of their work force.
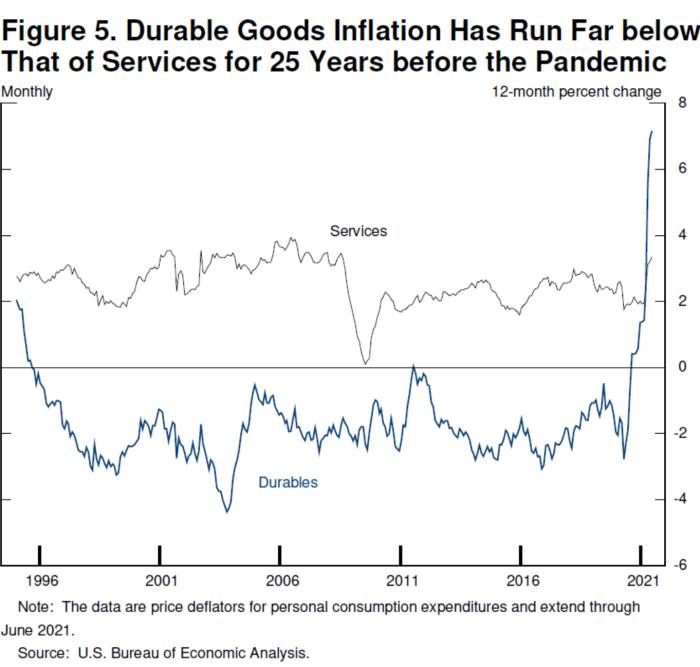
Inflation Goods and Services
- Nice way of showing how service inflation has outpaced goods inflation for largely all of the last 25 years.
Current Situation
- Great chart showing how extreme the current situation is.
- Global survey data points to a record gap between order backlogs and inventory levels.
- h/t Daily Shot.

European Capital Stock
- Europe has too much capital stock when compared to other regions.
- This bodes poorly for future bank lending growth.

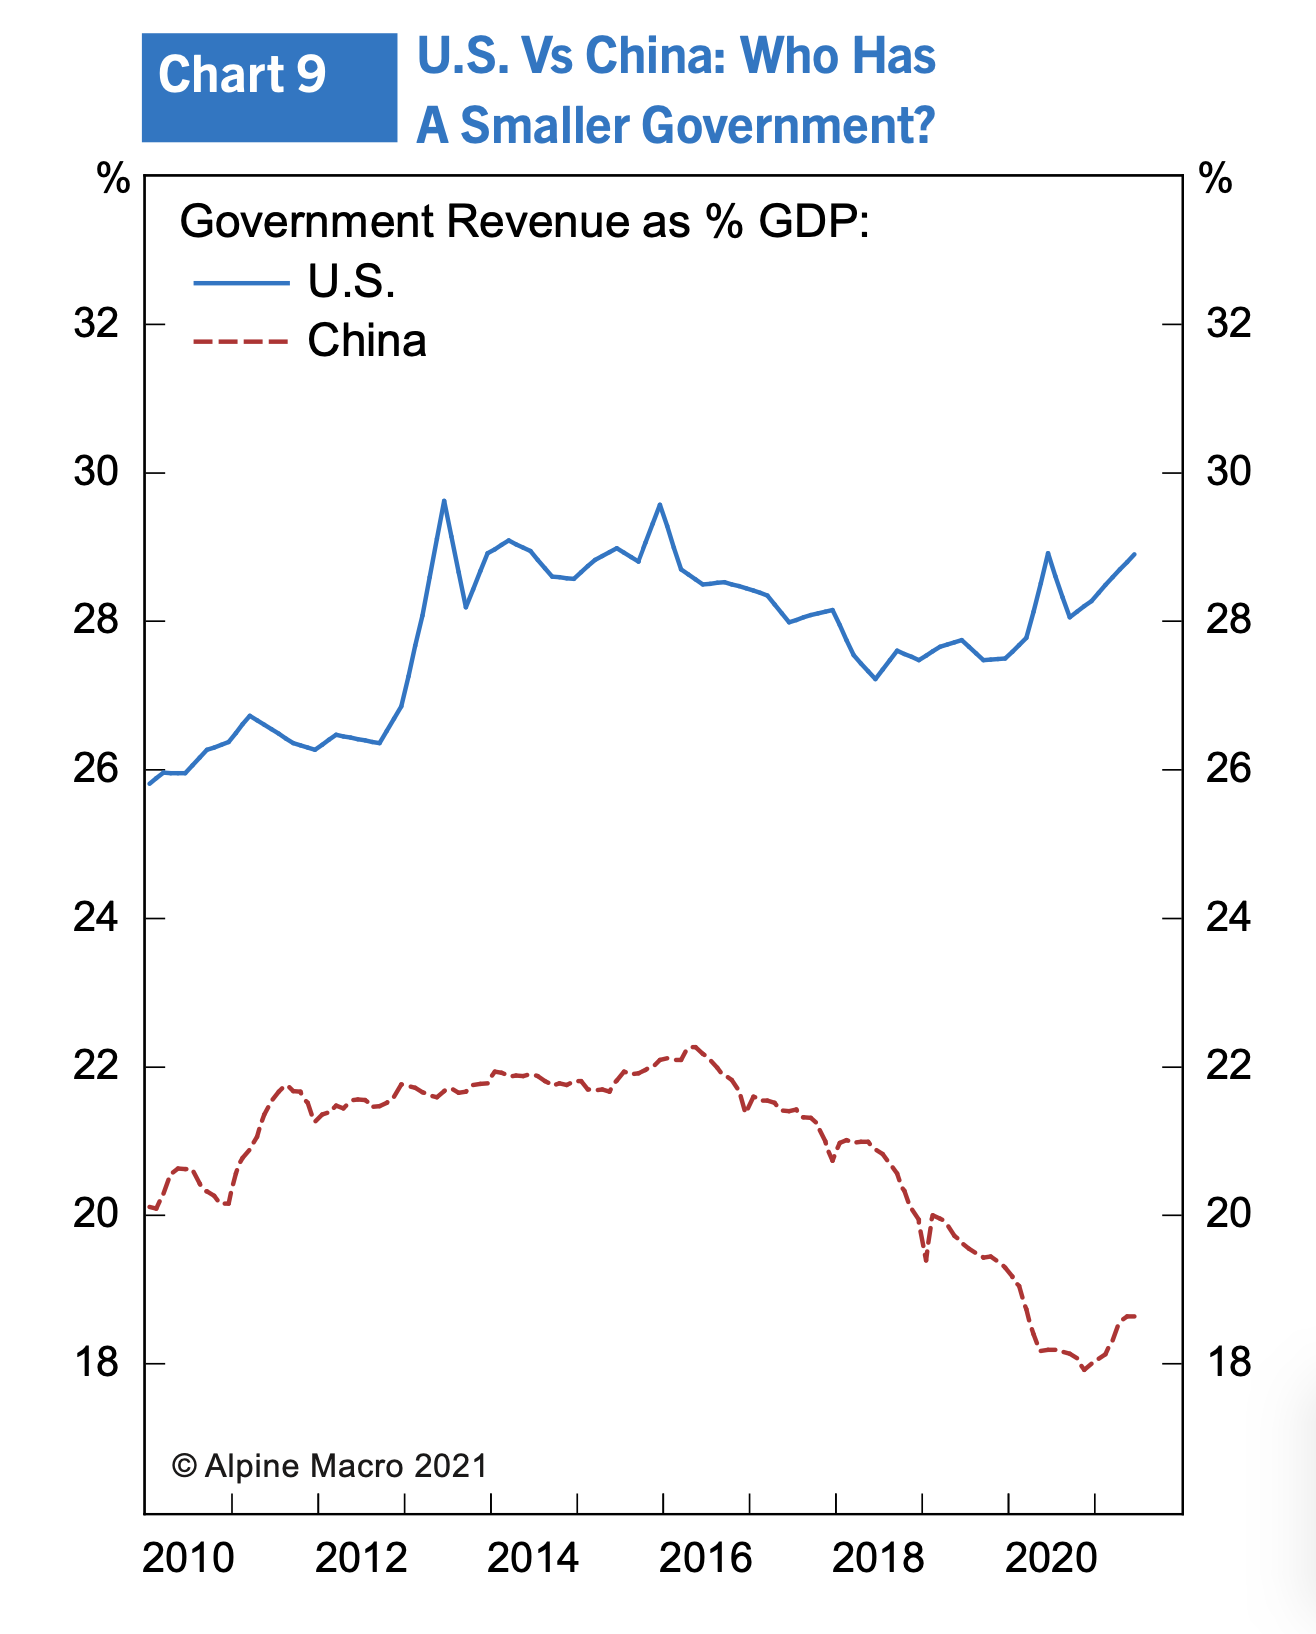
Chinese Government
- Interestingly the government sector in China is actually smaller than in the US.
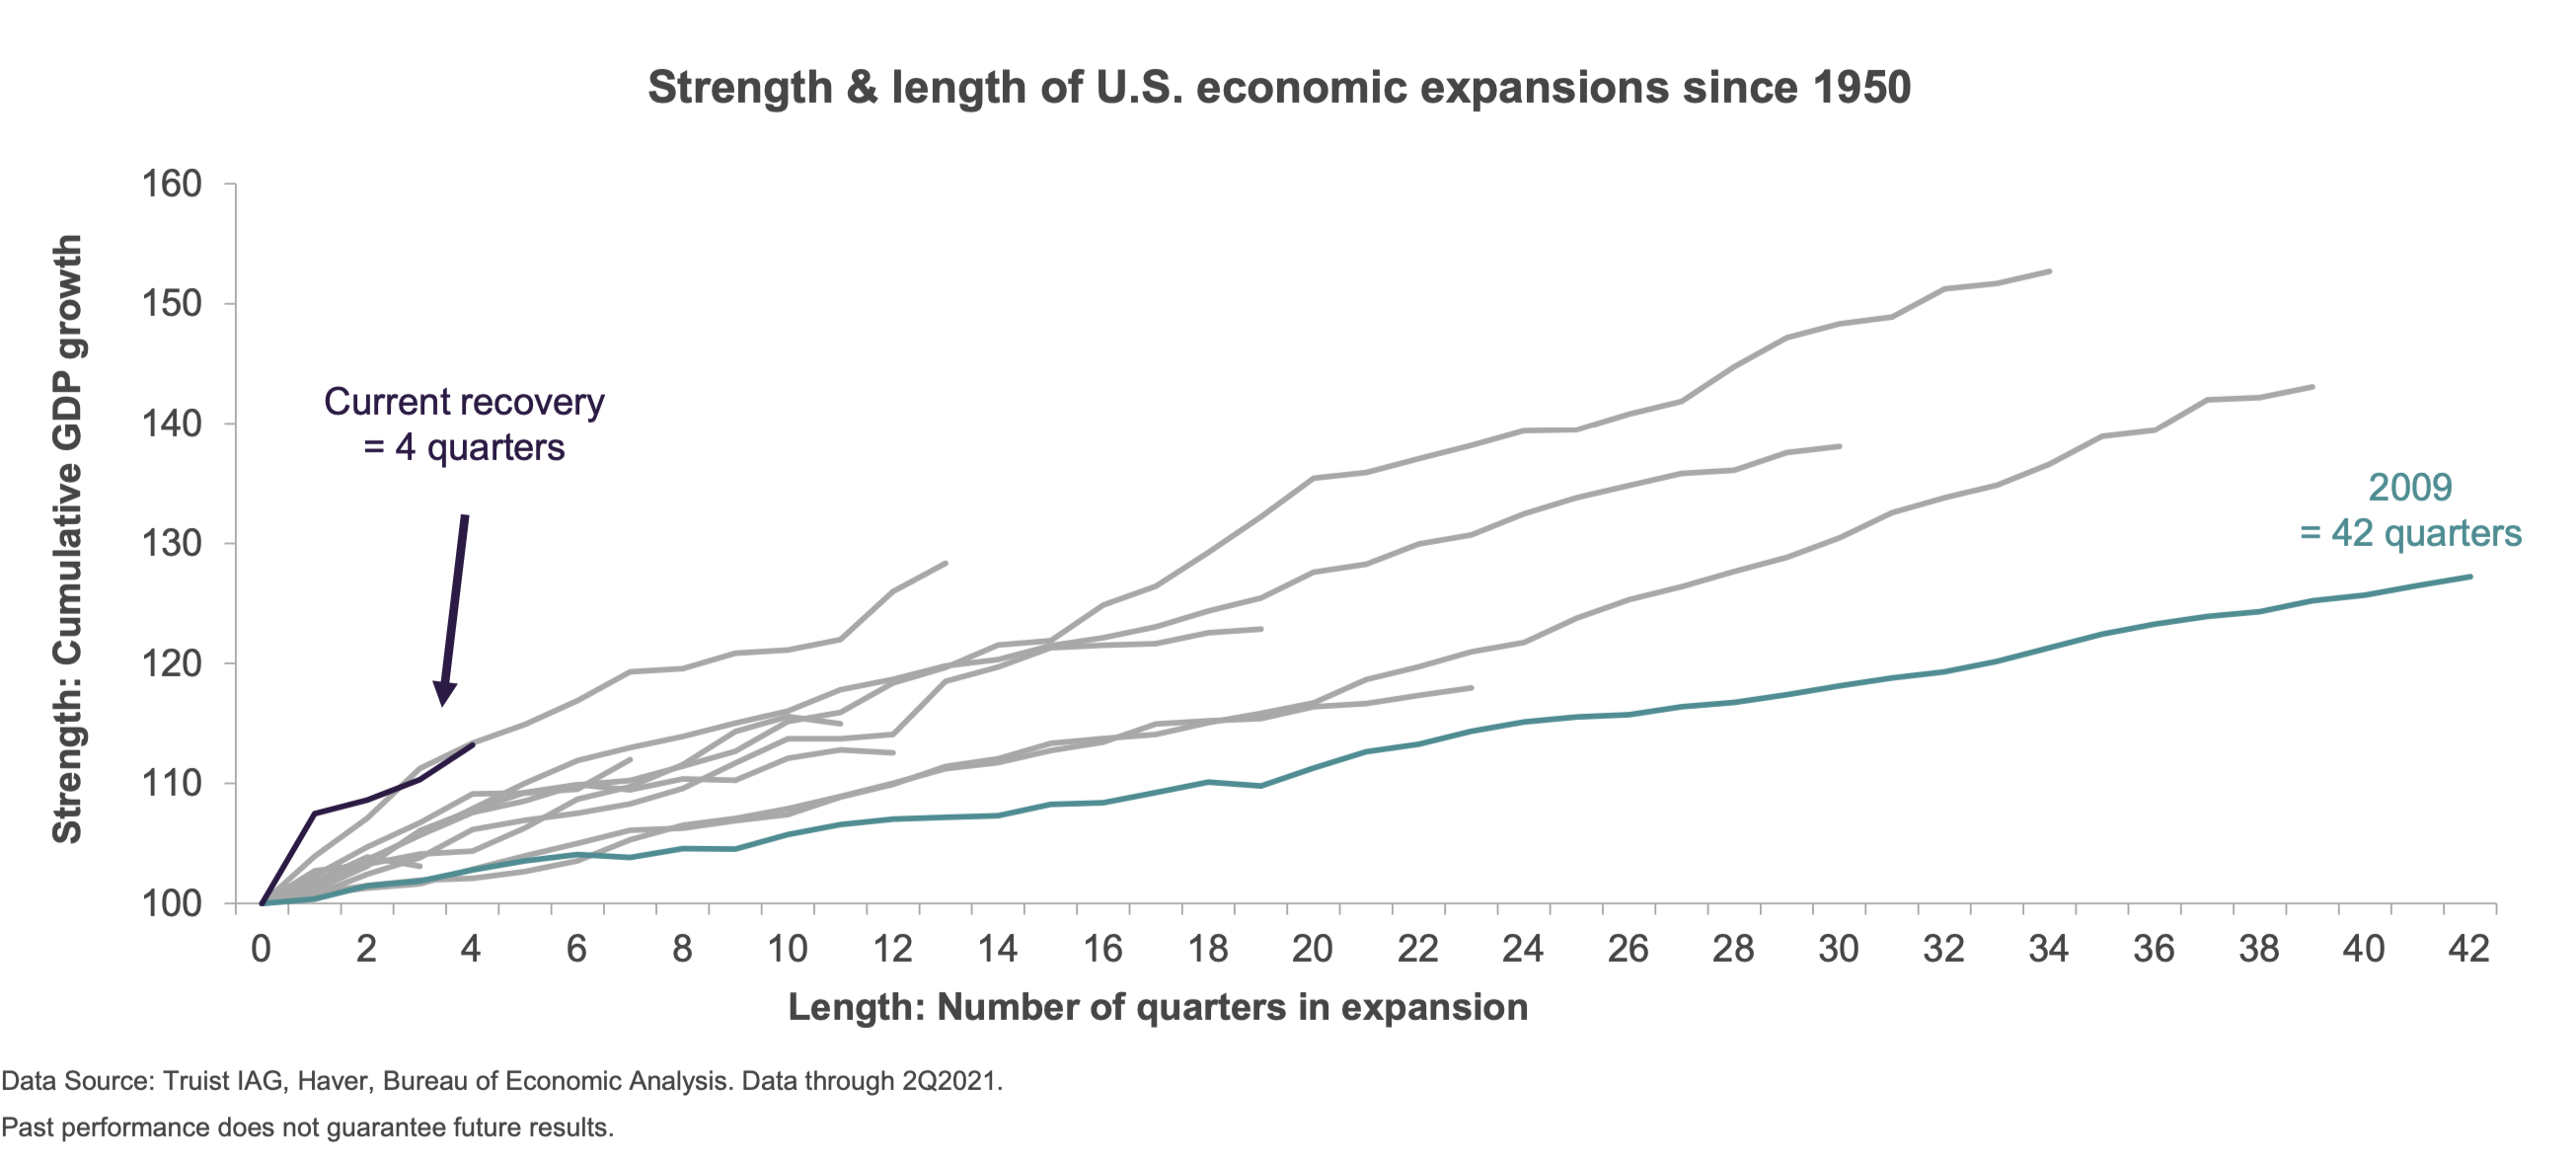
Recovery Timlines
- If history is any guide recoveries tend to last a lot longer than the current four quarters.
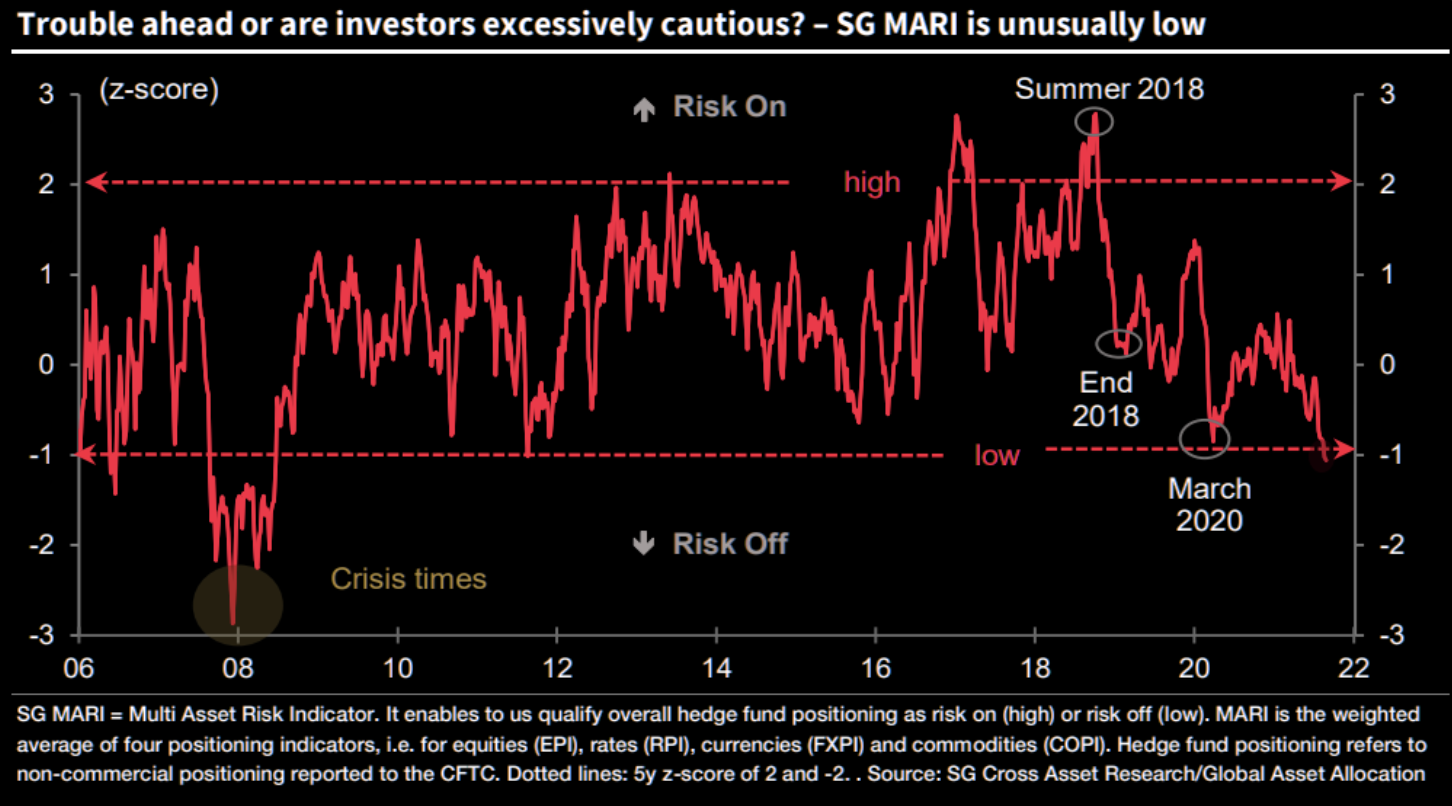
Sentiment
- Despite equities at all time highs Societe Generale’s multi-asset risk indicator is flashing risk-off like it did in March 2020.
- h/t The Market Ear.