- China has one of the worst Gini coefficients, a measure of inequality, in the world.
- More importantly, it has also seen the highest deterioration in this coefficient since 1990.
- Data sourced from this IMF paper (2018) via Hayden Capital Q2.
Macroeconomics
Snippets on the big picture.

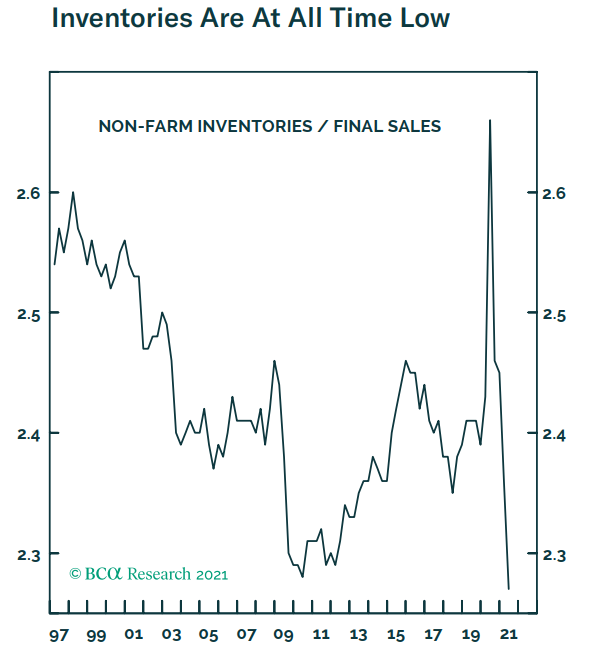
Inventories
- Inventory to sales ratio in the US is at an all time low, even lower than during 08/09.
- Source: BCA Research.
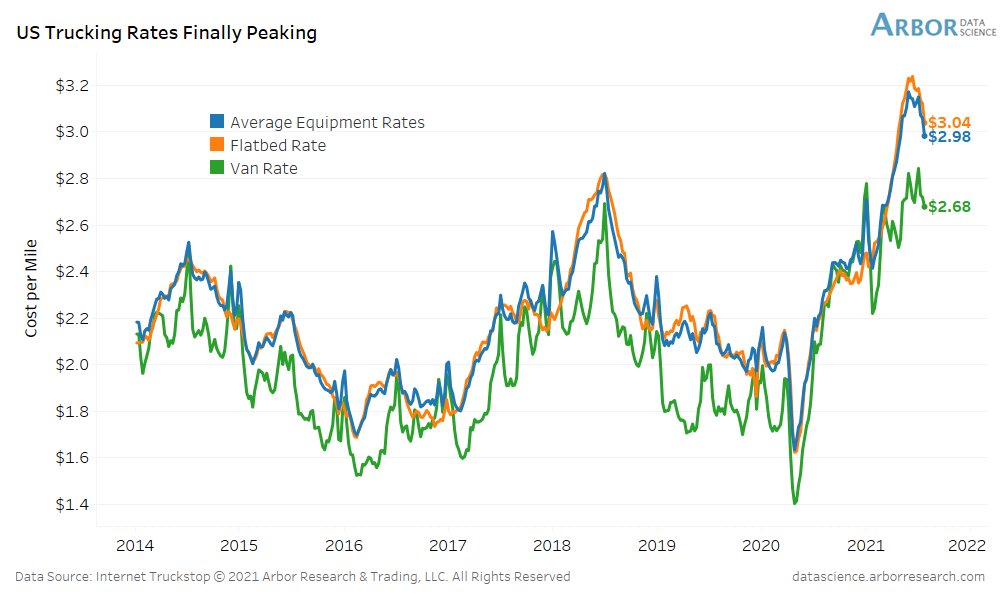
Trucking Rates Aug 2021
- Trucking rates in the US are looking like they are peaking.
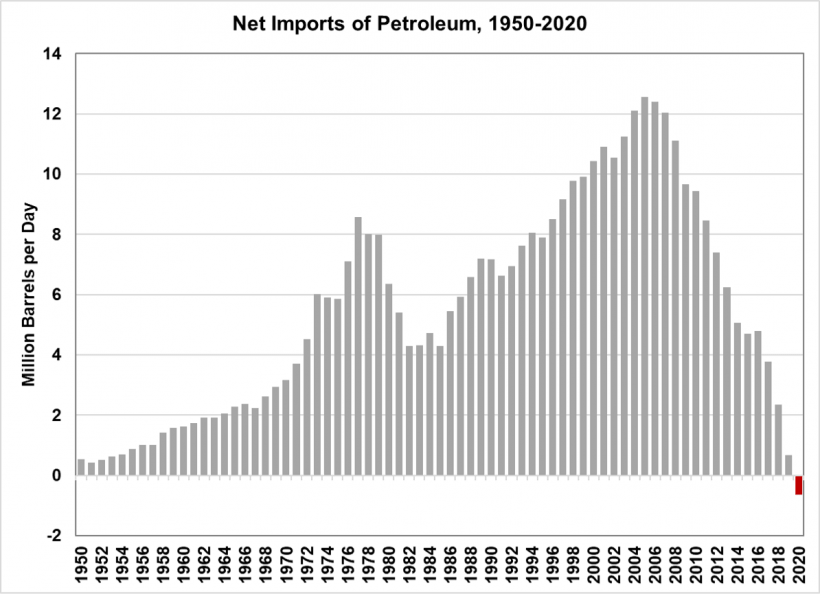
US Petroleum Net Imports
- This is perhaps the most important chart, that has profound implications for the world.
- Source.
Realtors Confidence Survey
- June 2021 survey paints a less than perfect picture.
- “Several metrics indicate that demand is softening although the market is still broadly strong.“
- “The REALTORS® Buyer Traffic Index decreased from 77 in May 2021 to 71 (moderately strong conditions) in June 2021.”
- “On average, a home sold had more than 4 offers, slightly lower than the average of 5 offers in last month’s survey.”
- On top of this inventory (the most important variable for house prices) is starting to bottom seasonally.
- h/t Calculated Risk.
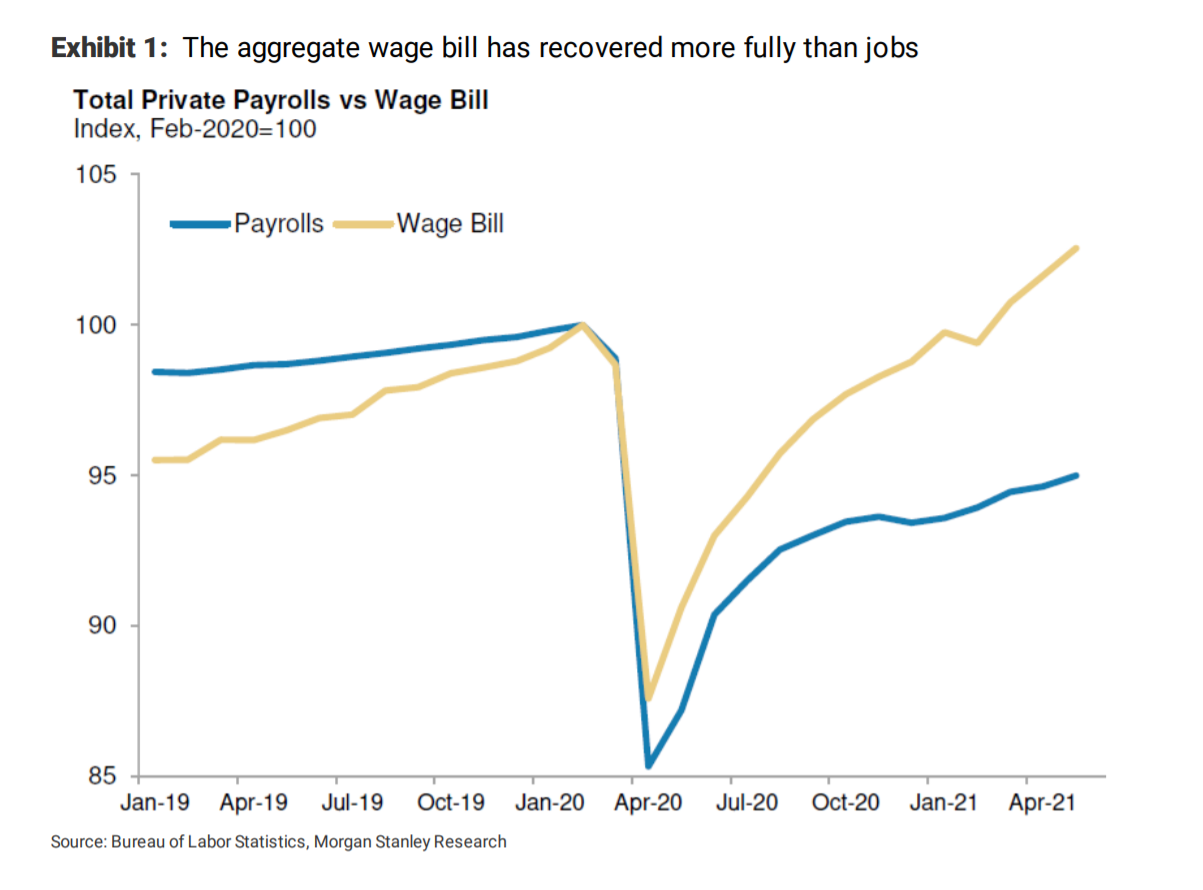
Wages vs. Jobs
- Indexing to pre-pandemic, wages have recovered more than jobs.
- NB a lot of the wage growth has been driven by low-skilled sectors.
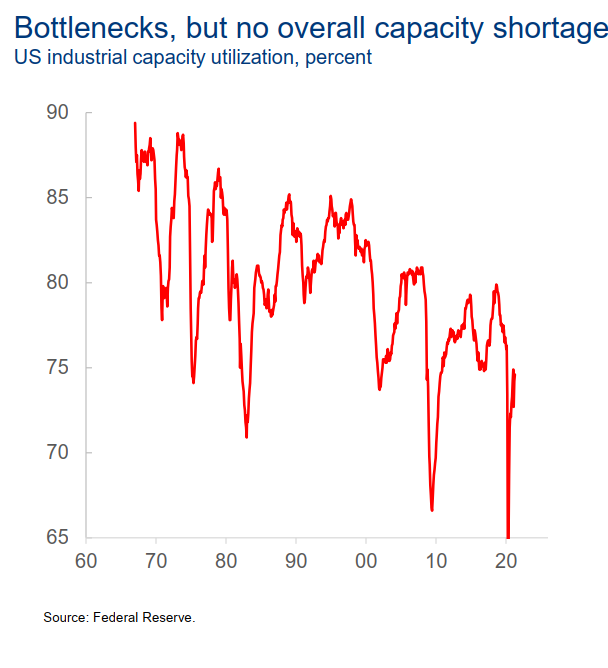
Capacity Utilisation
- Although there are clearly bottlenecks right now, there is no overall shortage of capacity.
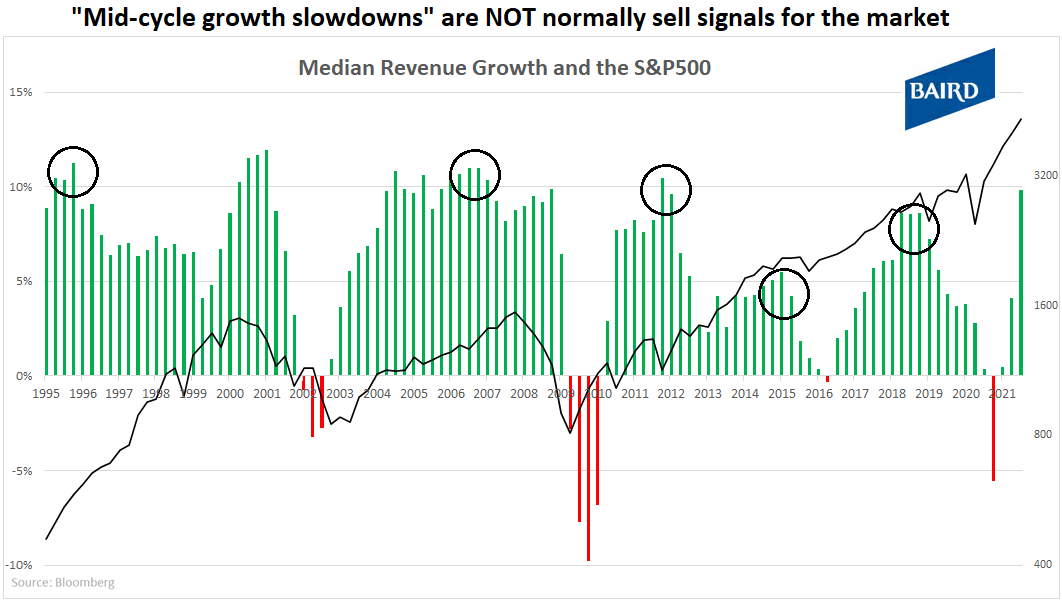
Mid Cycle Growth Slowdown
- We are likely entering the mid-cycle where growth is slowing, though it will remain at a high level.
- This is a nice chart showing that such slowdowns historically haven’t meant that stocks sell-off.
- Source.
Government Involvement
- Americans increasingly favour more government involvement than less. Lots of implications flow from this.
- Source: GS Research.

Savings by Wealth Level
- This chart disaggregates bank deposit data, using it as a proxy for household savings.
- The wealthiest 10% of households account for 70% of the increase in savings between Q1 2020 and Q1 2021.
- Wealthy households have a much lower marginal propensity to consume.
- This effect, however, is likely to be overpowered by the sheer magnitude of the increase in savings.
- Source: BCA Research.

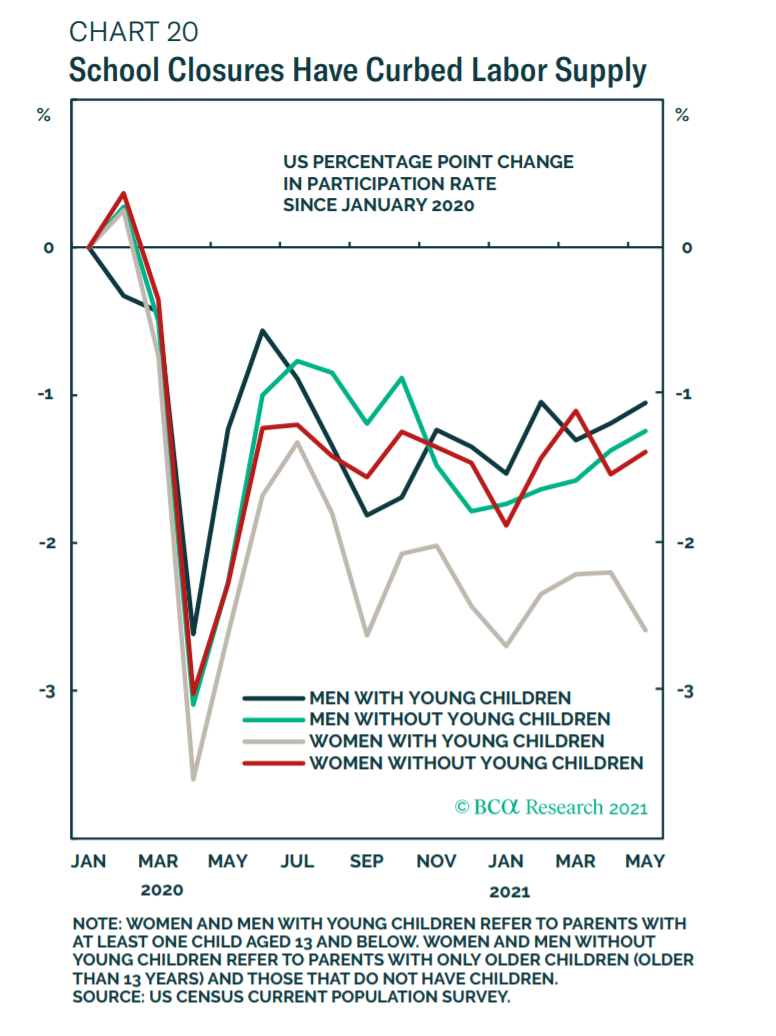
Schools and Labour Force Participation
- Labour force participation by women with young children (younger than 13 years old) has been noticeably impacted by pandemic related school closures.
- Normalisation here in the autumn could bring this segment back into the labour force.
- Source: BCA Research.
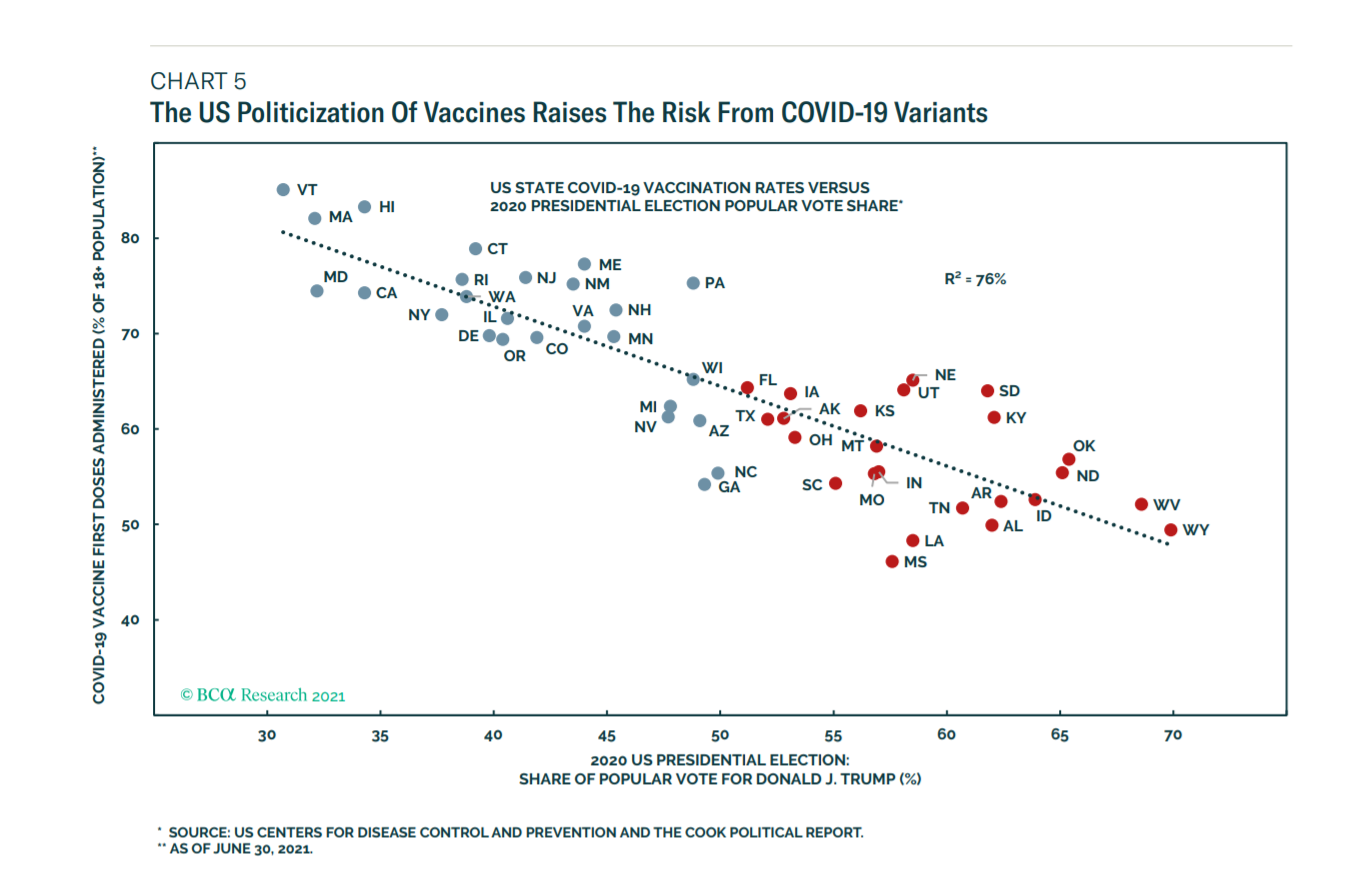
Vaccination and Politics
- US Vaccination rates by state follow the political divide.
- Many Republican-leaning states have more than half of the population still unvaccinated.
- Source: BCA Research.
EM vs. DM PMIs diverging
- “It is not just Asia which is seeing renewed weakness of manufacturing performance, however, with output in Russia coming close to stagnation again in June as rising virus numbers disrupted the economy, and a further steep fall in output was recorded in Mexico.
- As a result, while developed world production continued to grow at a rate close to decade-highs in June, emerging market output growth came close to stalling, its lowest since June 2020.“
- Source.

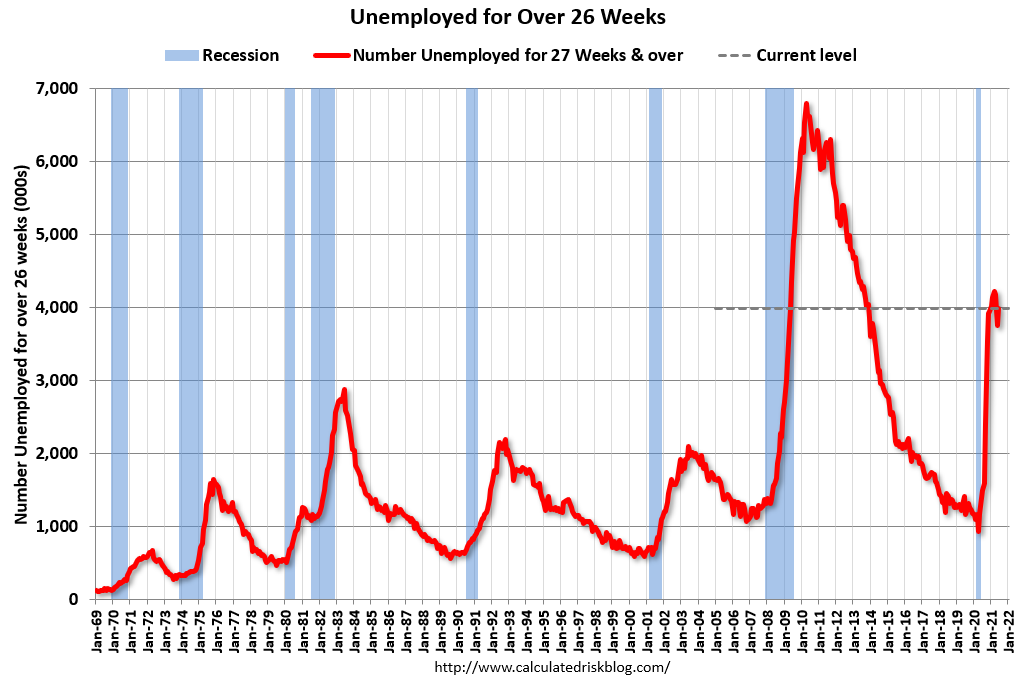
Long Term Unemployed
- The number of long-term (26 weeks or more) unemployed in the US hasn’t budged this recovery.
- There are still nearly 4m people in this category.
- Source.
Africa
- Starting with cliches is a good way to start this fantastic piece on Africa.
- It covers everything from demographics to key venture players to opportunities.
- Well worth a read for those interested in this continent.
- Let this map just sink in.
- There are 1.2bn people in Africa, a number that will double in 30 years to 2.4bn.
- Roughly 50% will be under 25 years old. The staggering stats go on.

PMI Heat Map (June 2021)
- Quarterly composite (service and manufacturing) PMIs from around the world – as good as it gets?
- Sourced from the always excellent JPM Guide to Markets (Q2 2021).

UK Housing Affordability Pt 2
- “However, house prices are close to a record high relative to average incomes. This is important because it makes it even harder for prospective first time buyers to raise a deposit. For example, a 10% deposit is over 50% of typical first time buyer’s income. A potential buyer earning the average wage and saving 15% of take home pay would now take five years to raise a 10% deposit.”
- Nationwide House Price Index June 2021.

UK Housing Affordability Pt 1
- “Despite the increase in house prices to new all-time highs, the typical mortgage payment is not high by historic standards compared to take home pay, largely because mortgage rates remain close to all-time lows – in fact, on this measure affordability remains broadly in line with its long run average, as shown in the chart“
- Nationwide House Price Index June 2021.

Demographics and Housing
- The 2020s will see the 30 – 39 age population group (chart) increase.
- This group is key for home buying.
- This is likely met with a pick up in selling by ageing Boomers in the second half of the 2020s.
- Demographics matter for housing – all details here.

Rosenberg Slides
- Good slide deck from David Rosenberg.
- It is interesting because it goes against a lot of consensus views.
- (1) The demand boost is largely temporary (fiscal stimulus) and will start to subside e.g. consumer discretionary was actually up last year.
- (2) Supply will eventually catch up (lumber production +20%, booming semiconductor exports Taiwan/Korea, lots of full container ships at US ports).
- Inflation depends largely on the labour market and that still has considerable slack (U-6 rate is 11% vs. 8% pre-Covid, slide 79 Atlanta Fed Wage Tracker is benign).
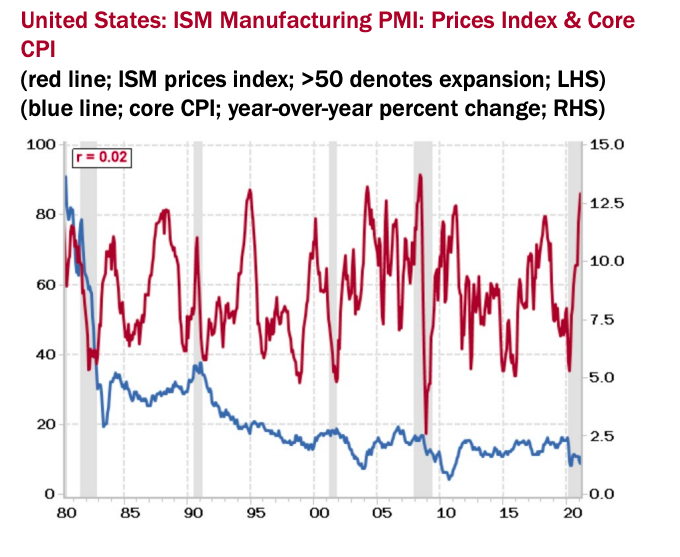
- Things like commodities (China is delevering anyway) and ISM diffusion indices (see chart) don’t drive inflation.
- Have a look and make up your own mind.