- A useful inflation tracking index (consisting of seven measures of inflation) that is both more timely and overcomes the challenges of each individual measure.
- The latest update (7th June) – pictured – suggests inflation could be peaking.
- For the first time this year the mean and median are holding steady.
Macroeconomics
Snippets on the big picture.

US Labour Market
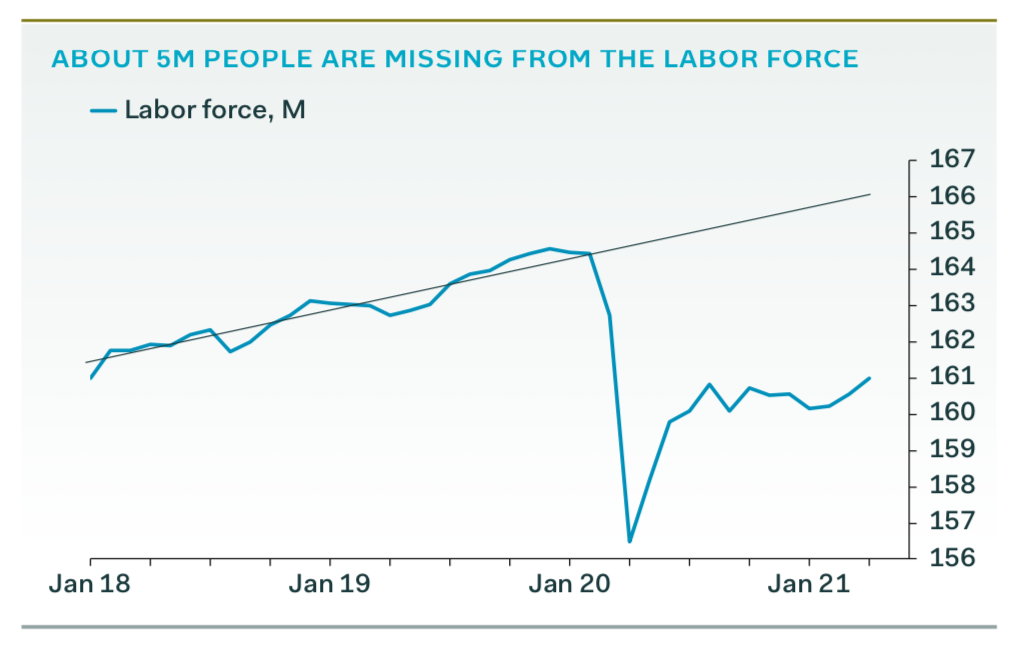
- A big debate is going on about the tightness of labour markets in the US.
- This chart from Pantheon Macro is instructive – 5 million people are missing from the labour force.
- By Q3 factors holding individuals back will fade – enhanced unemployment benefit will expire (6th Sep) and all childcare/schools will likely be open.
- Near term however we have lots of evidence of tightness (signing bonuses, rising wages) and the Fed is taking notice.
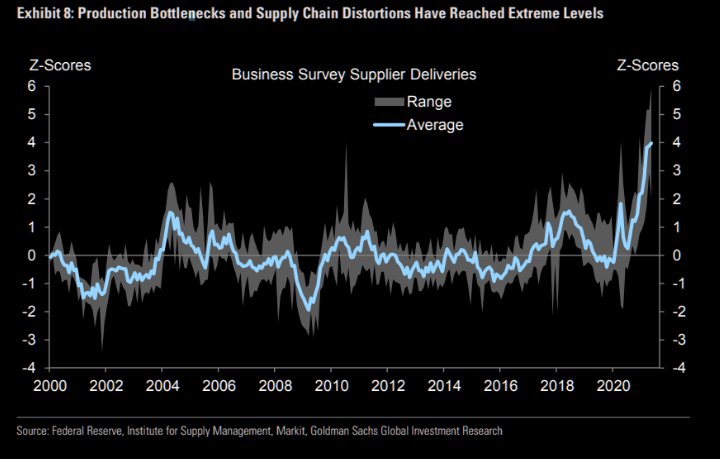
Production Bottlenecks
- Bottlenecks and supply chain disruptions are reaching extreme levels – is this temporary?
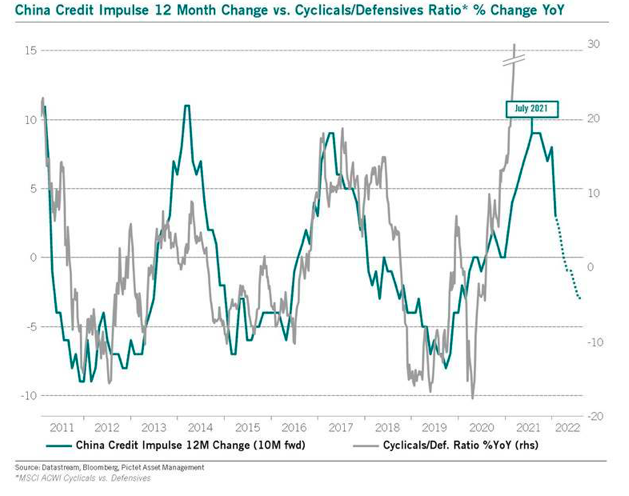
China Credit Impulse and Cyclicals
Inflation Debate
- There is a considerable debate raging right now on the future level of inflation, exacerbated by the consensus busting April CPI print (here, here and here).
- This piece, written by economists, is worth reading.
- It proposes looking at median CPI to construct the Phillips curve, as it better reflects macroeconomic conditions.
- The resulting relationship is stable pre- and post-pandemic and suggests, under bullish unemployment scenarios, that implied core PCE could hit 1.8-2.3% by 2023, “broadly consistent with the Fed’s average inflation targeting strategy with inflation modestly overshooting its long-term level following a number of years of undershooting it.“
- They also don’t see, unlike others, temporary government spending causing an unanchored inflationary spiral given a better communication framework from the Fed and positive supply side effects of infrastructure spending.
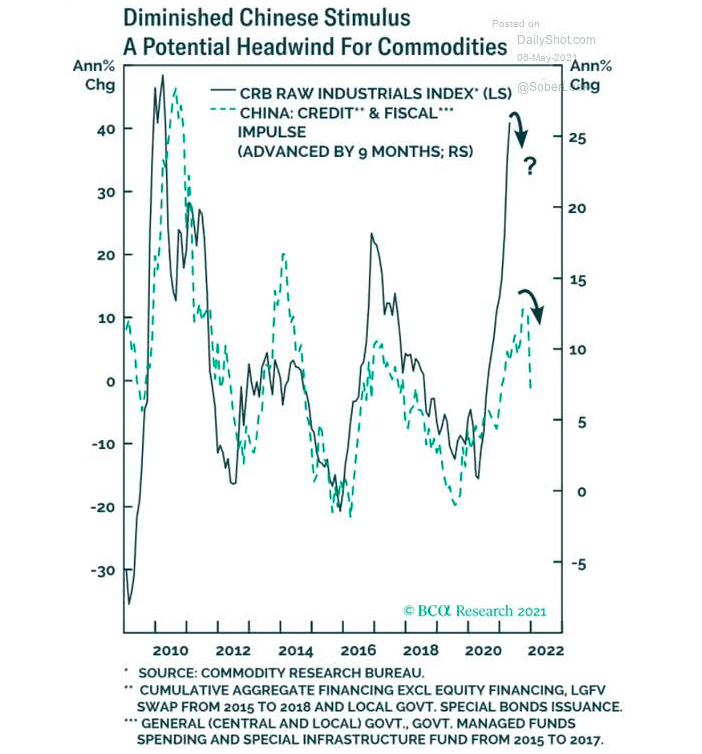
China Credit Impulse and Commodities
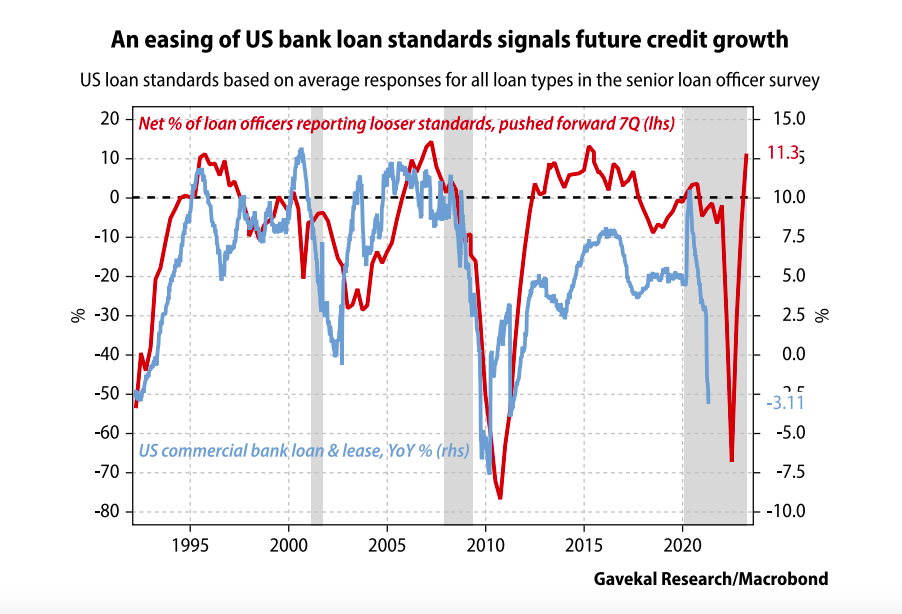
Bank Lending
- US loan officers continue to ease standards and this tends to lead bank lending.
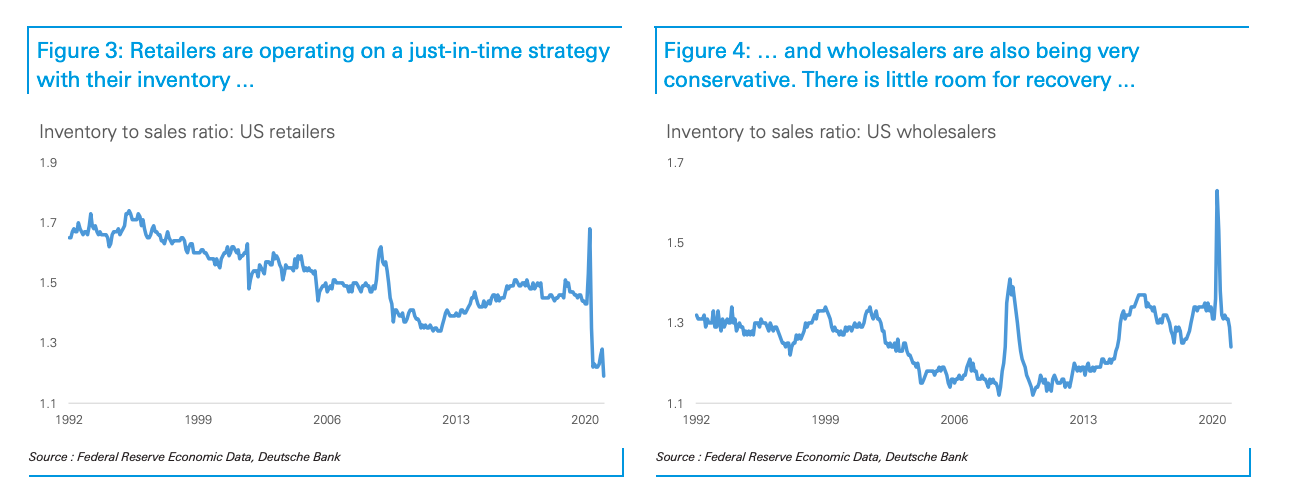
Just in Time Inventories
- Inventories at retailers have been falling for years (left hand chart).
- Wholesalers have also been conservative (right hand chart).
- This has led to trouble in the big demand rebound of 2021.
Hoisington Q1
- If you want to read something that is totally in the face of current market expectations of inflation this is the piece.
- It comes from Hoisington Investment Management – long time bulls on long term treasuries.
- “Contrary to the conventional wisdom, disinflation is more likely than accelerating inflation. Since prices deflated in the second quarter of 2020, the annual inflation rate will move transitorily higher. Once these base effects are exhausted, cyclical, structural, and monetary considerations suggest that the inflation rate will moderate lower by year end and will undershoot the Fed Reserve’s target of 2%. The inflationary psychosis that has gripped the bond market will fade away in the face of such persistent disinflation.“
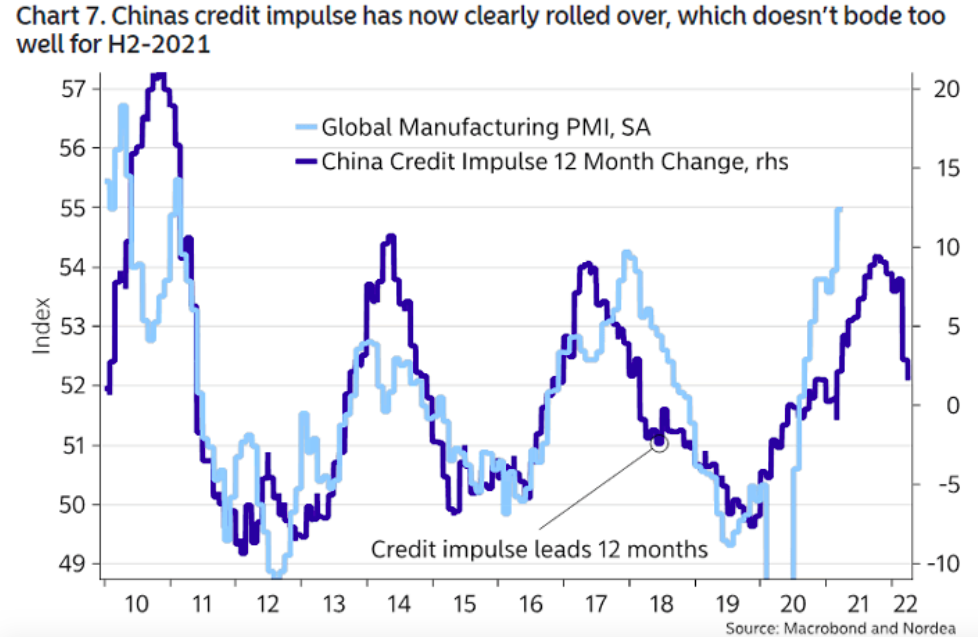
China Credit Impulse
- China’s credit impulse leads global manufacturing PMIs by 12 months.
- It just rolled over.
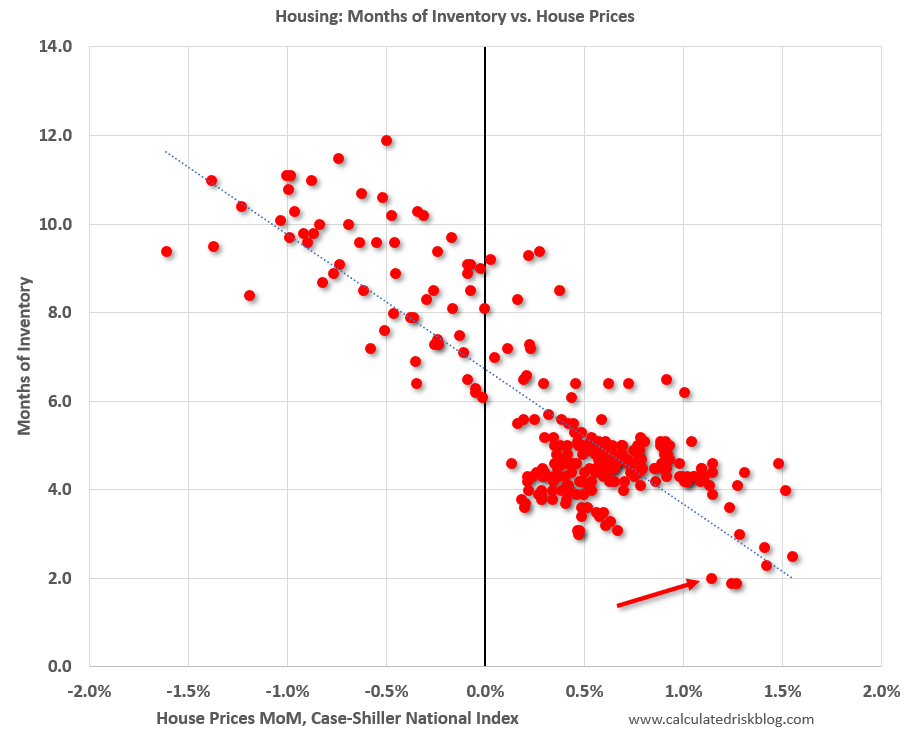
House Prices and Inventory
- Useful chart from the excellent Calculated Risk blog.
- “This graph shows existing home months-of-supply (from the NAR) vs. the seasonally adjusted month-to-month price change in the Case-Shiller National Index (both since January 1999 through February 2021).“
- Simply put if inventory is high prices decline, if months of supply is low they rise.
- Months of supply in March is 2.1. Prices are rising strongly.
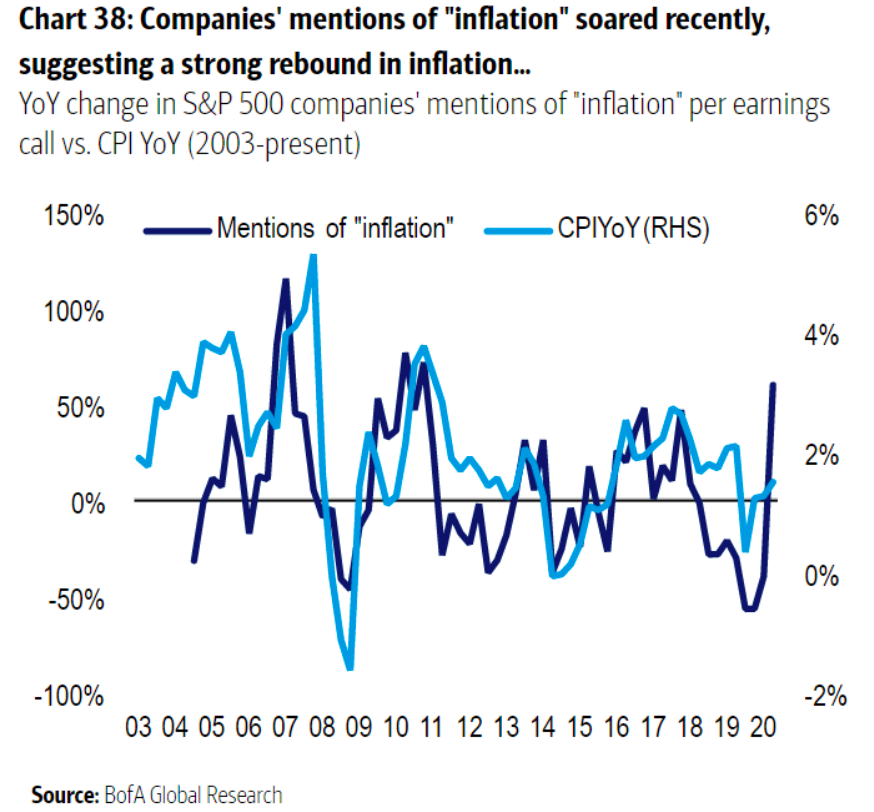
Inflation Mentions
- Companies are mentioning inflation an awful lot.
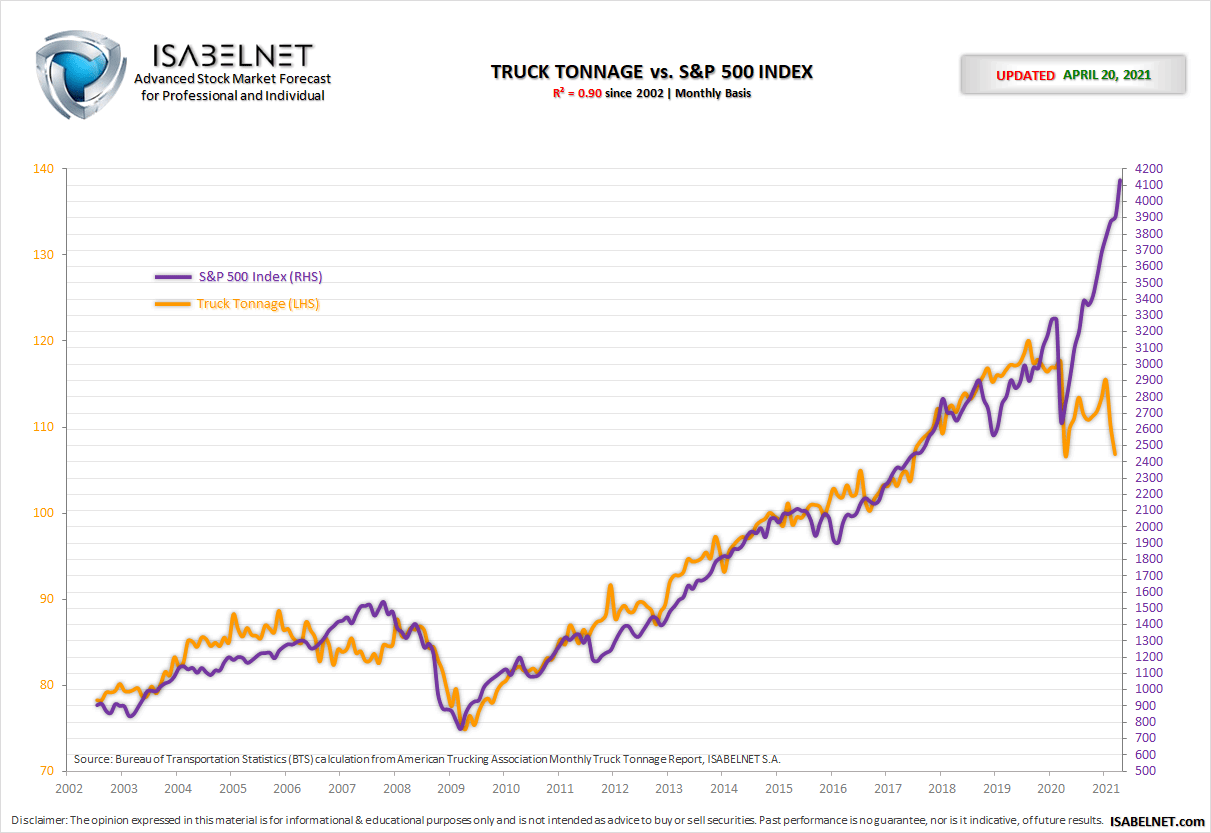
Truck Tonnage
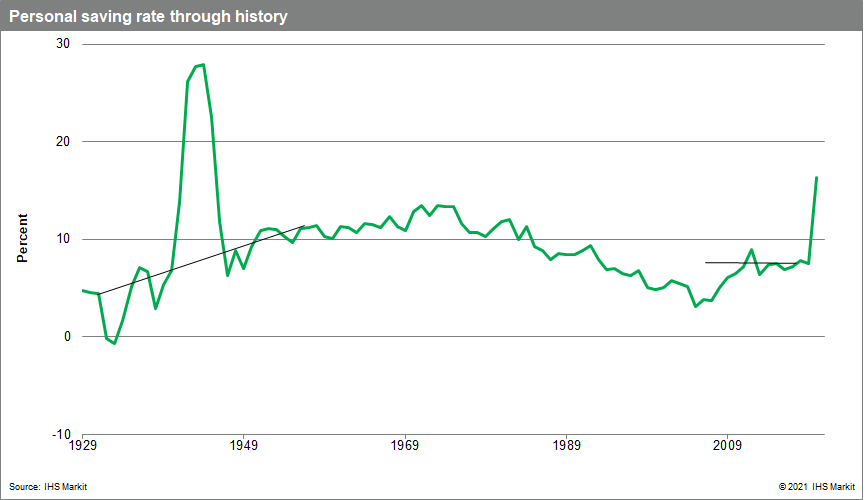
Savings Rate
- “Observation of history also supports the notion that the saving rate is unlikely to sharply undershoot its pre-pandemic value. Consider the experience around World War II. During the war, the saving rate spiked as production and purchases of consumer goods and spending on leisure services were curtailed. At the conclusion of the war, despite the release of pent-up demand as returning service members married and started families, the saving rate declined to a level above its pre-war average and then trended higher for several years. Our forecast features a broadly similar result. The return of the normal relationship between spending, income, and wealth does not imply an undershoot of the saving rate. Without such an undershoot, the path of consumer spending, while strong, does not launch the economy into an inflationary boom.“
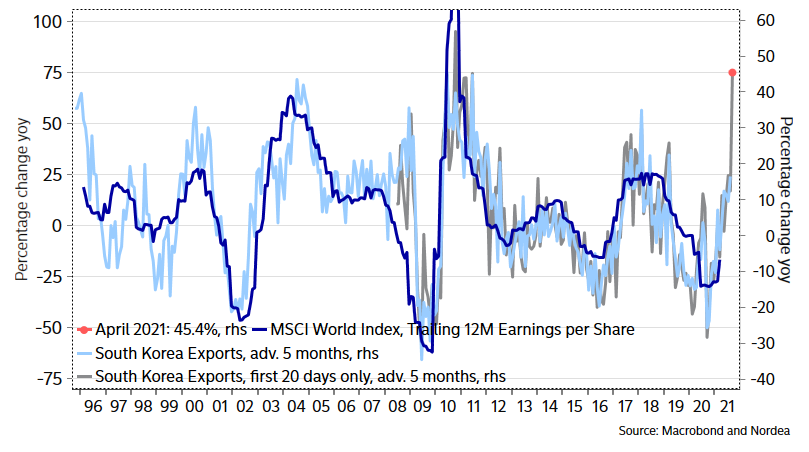
Korean Exports
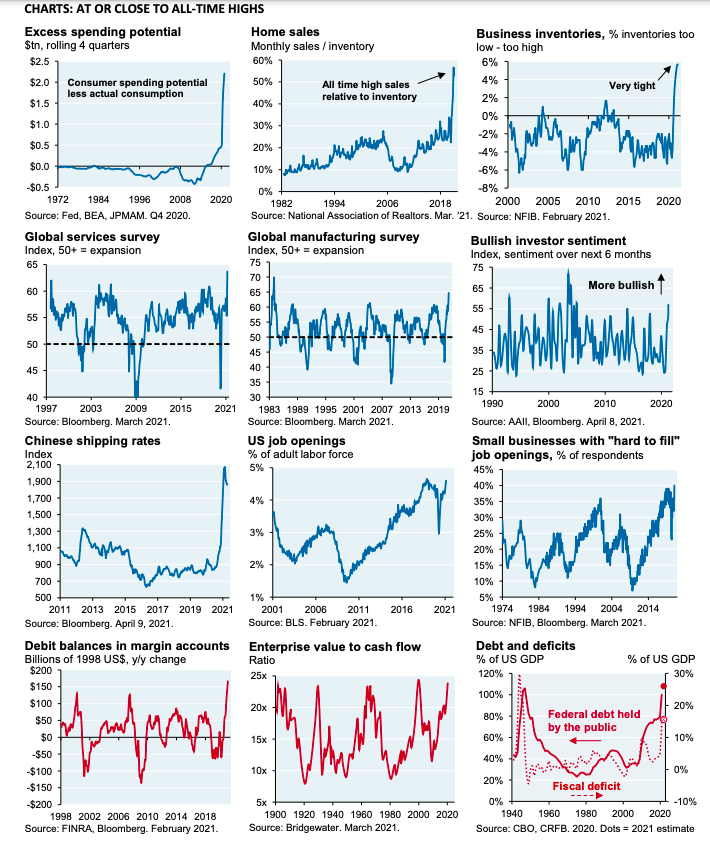
Indicators
- Coincident and leading indicators are at or near all time highs.
- Most are positive while others (debt, deficits, equity valuations, margin debt and supply shortages) are worrying.
- Source.
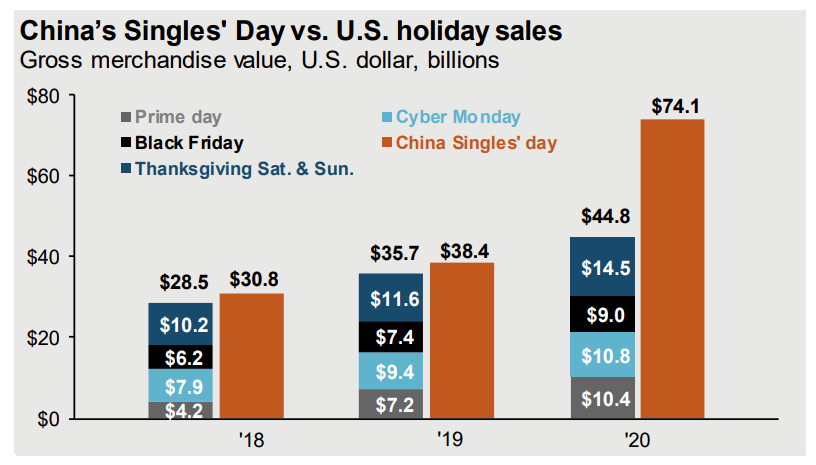
China Singles’ Day
- Singles’ day GMV in China dwarfs all US holiday retail events combined.
- Source.
Future of Cities
- A really brilliant interview with Enrico Moretti, a researcher in labour and urban economics.
- He makes two points on the future of post-pandemic cities, which, due to agglomeration effects he sees as bright.
- There will be two forces – the first as employers accept some working from home, workers will accept a longer commute if it is less frequent, thereby growing the size of cities and hence the amenities they support.
- This process will also lighten the load on the urban core – thereby making it more attractive.
- Which force will win out is yet to be seen.
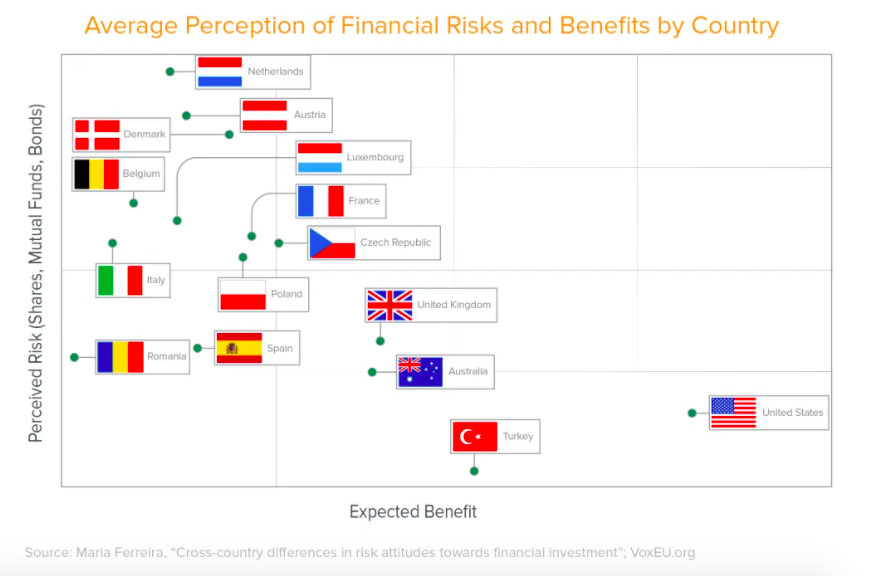
Financial Risk Perception by Country
- US stands out from other countries when it comes to perception of the benefit/risk from financial investing.
UK Retail
- Nearly 11,000 stores (defined as retail, restaurant and leisure premises) permanently disappeared from UK retail landscape last year.
- This is largely coming from chain stores (-9,877) with the independent market shrinking only (-1,442).
- The article does say that many more remain temporarily closed so the full impact is not clear.