- Interesting landscape of sector PMIs in Europe – March compared to Feb.
- Even pharmaceuticals and biotech are not immune.
- Source: IHS Markit.
Macroeconomics
Snippets on the big picture.

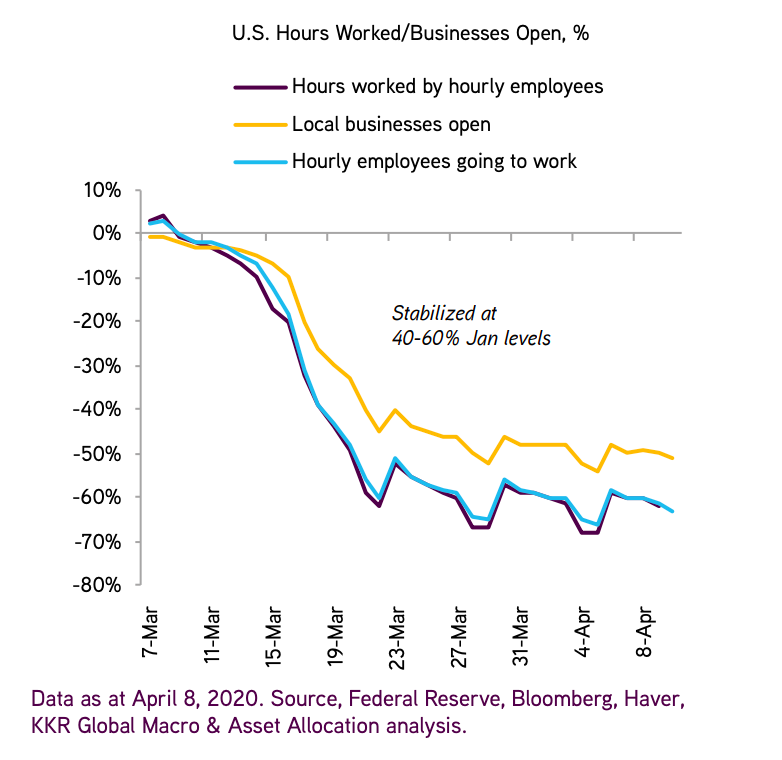
US Economic Activity
- Interesting economic series from KKR.
- Shows activity across business openings and employees.
- Activity is -40-60% from January levels.
Global Consumer Pulse
- Nice table from McKinsey on the global consumer.
- It shows net intent to purchase a particular category by country.
- Net intent = % who said they would increase purchases in the next two weeks compared to usual minus % who said they wouldn’t.
- Interesting to see China/Korea recovering somewhat but not in all areas.

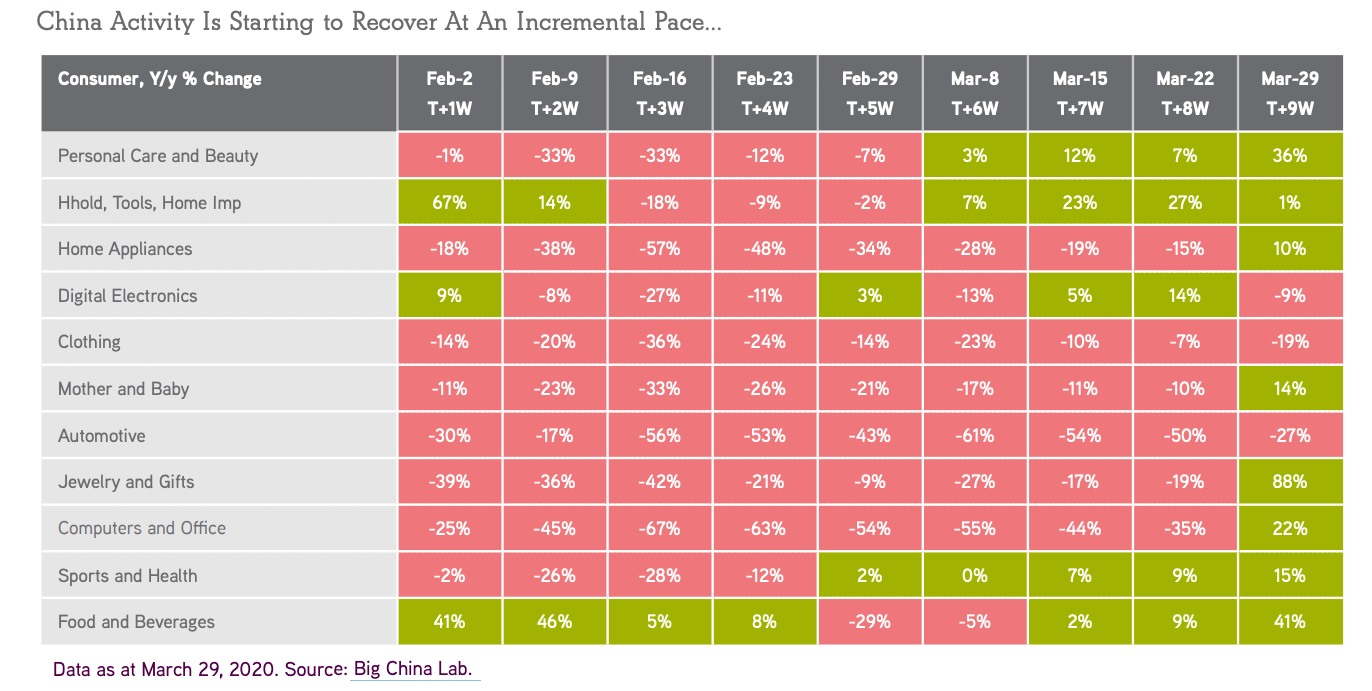
China Economic Activity 2
- Good chart from KKR’s Global Macro Insight.
- Shows activity in China across various consumption categories.
- It is starting to recover at an incremental pace.
- A previous snippet pointed to a shallow recovery in China and has negative read across to other countries.
Chinese Economic Activity
- Interestingly surveys suggest Chinese consumers are cautious despite lifting of the lockdown.
- “A Morgan Stanley online survey of 2019 consumers in 19 provinces last week found that while most respondents—86%—were leaving the house for work, most were still reluctant to go out to shop, eat or socialize. And 69% said they would go out for essentials only, down from 75% in early March—still extremely high.” (Source: WSJ).
- The chart below is also interesting showing how activity across a set of indicators has fared so far in China post the lunar new year as the country opens up.
- In short – activity will take some time to recover.
- Could the same be the case in other countries?

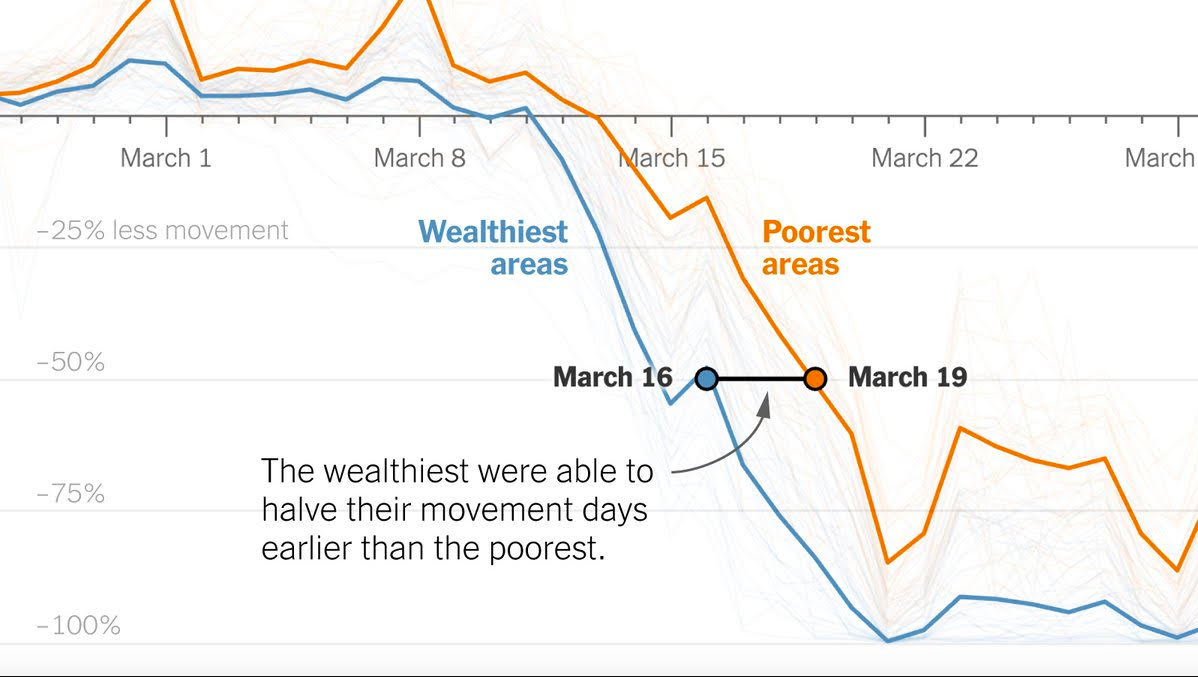
Income inequality and Covid
- Mobility data has allowed New York Times to do some analysis.
- They have found that wealthier areas saw movement halve earlier than poorer areas.
- Covid is likely to expose further inequalities.
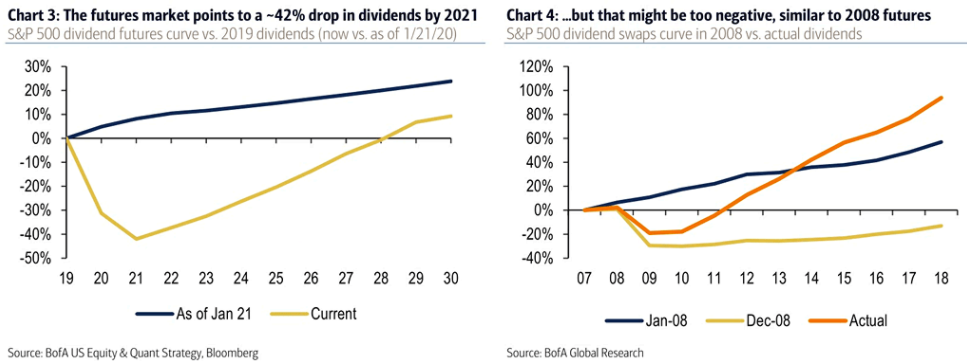
Dividend Futures
- The dividend futures market has been crushed.
- This chart (from ML) on the left shows the futures curve for S&P 500 dividends compared to 2019.
- The blue line is how the market looked at the top (21st Jan 2020) and the orange how it looks today.
- The market is pricing in -42% in dividends by 2021.
- The right hand side shows the situation in 2008 – the actual reality (dark orange line) was far better.
Average daily cause of death in US
- Stark visualisation showing how the daily cause of death in USA has changed from the start of the year.
- Covid has risen to the top.
- Source: Flourish h/t The Big Picture.
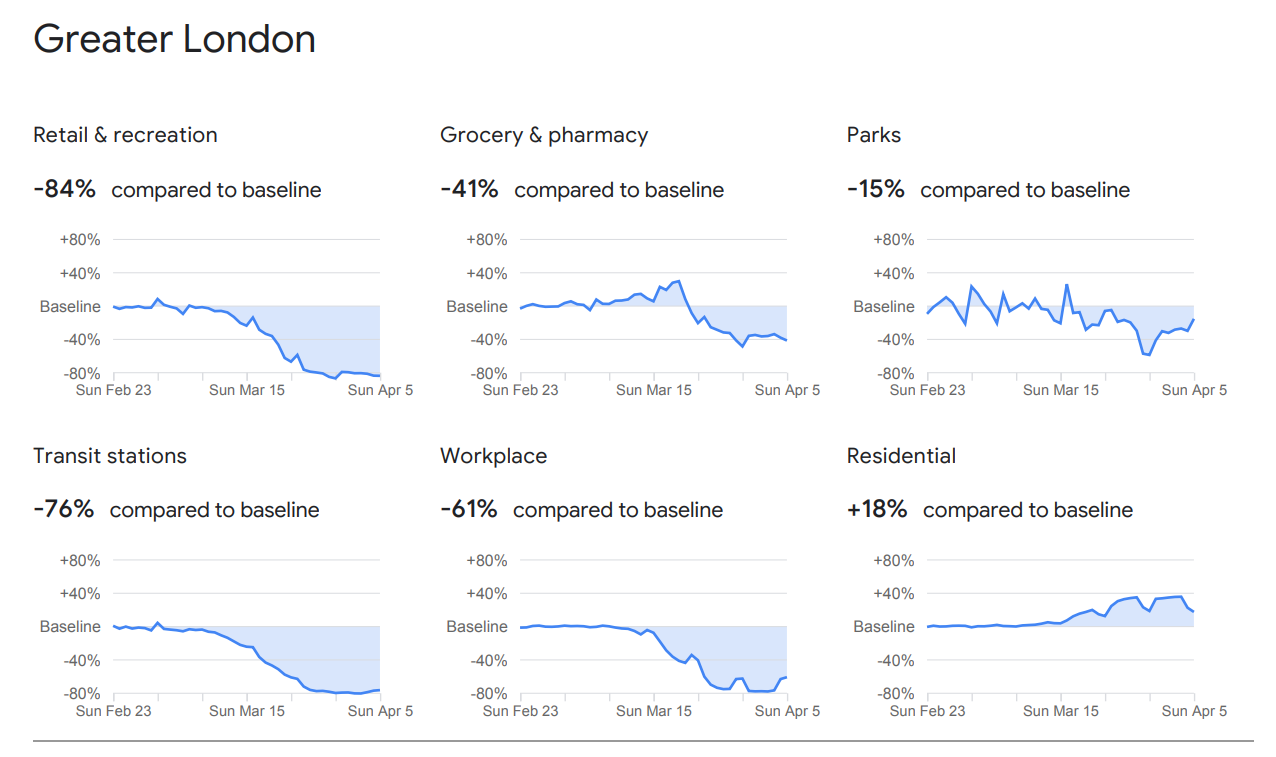
Covid Impact 7 – Mobility
- A cool dataset from Google on community mobility due to COVID-19.
- Just type in your country.
- Similar to Foursquare data.
- The one for UK is interesting. Figure shows Greater London.
- Probably the starting point for this.
- In the end Covid could prove to be a huge boon for analysis. The level of data generated is unprecedented.
- It is also arguably the closest we have come to macro-level natural experiment – an economists dream.
Covid Impact 5 – Citizens Advice
- This website tracks traffic to Citizens Advice in the US.
- Shows traffic in the past 24 hours incl the peak and current traffic.
- It also shows the trending searches (on site and google) as well as content.
Covid Impact 3 – Internet Traffic
- Another great set of data on traffic to specific websites.
- Interesting to see peaking in covid website traffic (e.g. WHO.int and worldometers.info) while travel website traffic declines have bottomed.
Covid Forecasts
- Interesting survey of infectious disease experts and their views on various outcomes of the Covid crisis.
- This chart taken from last week’s survey asks when the peak in hospitalisations will be in the US – most think May.

Covid Impacts
- Interesting data from Foursquare regarding foot traffic (up to 27th March) in the US.
- As expected Airports -66%, Hotels -61%, Bars -60%, Gyms -64%, Malls -61%, Clothing Stores -72%, Movie Theatres -75%, Restaurants -73%.
- There are some interesting observations though.
- Despite restaurant traffic being down 73%, fast food is only -17% – likely due to take away.
- Interestingly after the initial stocking spike traffic to supply stores, grocery stores (pictured) and liquor stores is now well down from the peak (but still up overall).
- Drug stores on the other hand are seeing a +28% and hardware stores continue to see strong traffic (+27%).
- Gas station traffic initially ticked up but are now seeing -7-8% decline.
- Outdoors is booming with visits to trails +34% and parks +10%.

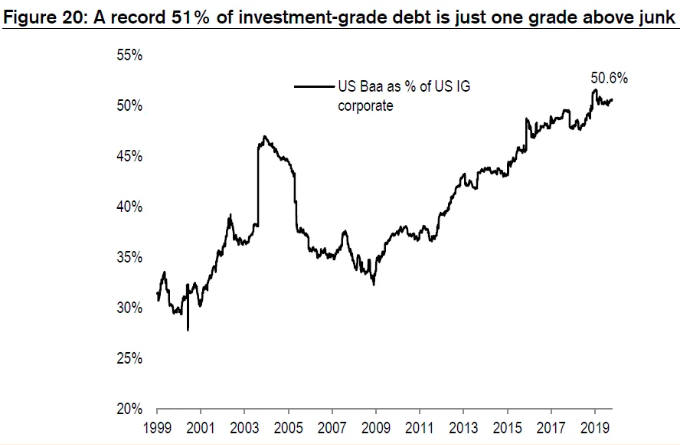
Bond Downgrades Coming
- Chart showing that a record 51% of US Investment Grade debt is rated Baa i.e. one notch above junk.
- Source: Credit Suisse.
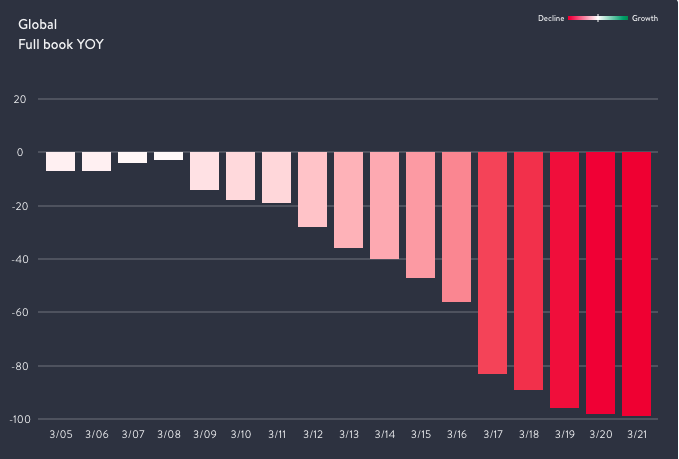
Open Table Traffic
- Open Table has 60,000 restaurants as customers.
- Bookings globally are -99% as of 21st of March.
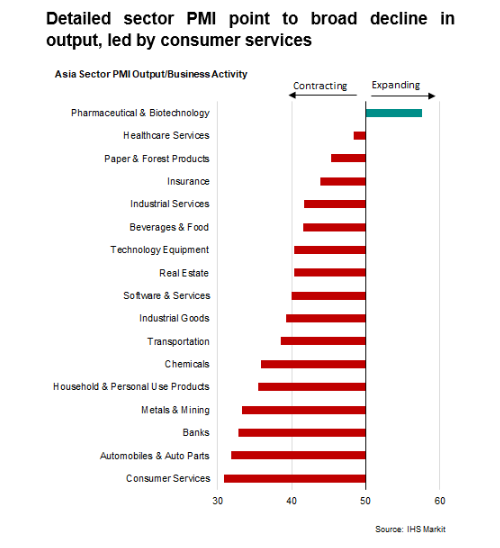
Sector PMIs
- Interesting chart of sector PMI in Asia.
- Output fell in all but one sector – Biotech.
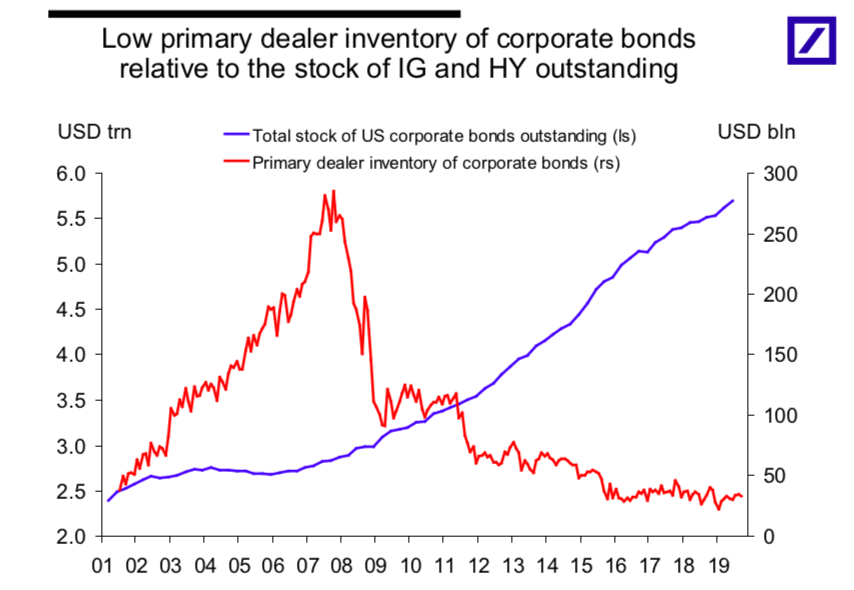
Dealer Inventory (repost)
- US Bonds outstanding continues to grow.
- However, inventory of bonds at primary dealers has stayed low since the financial crisis.
- This doesn’t however capture turnover of inventory – which has risen.
- Overall this still creates a very risky situation in terms of liquidity.
- Especially problematic now that Bond ETFs have hit $1 trillion.
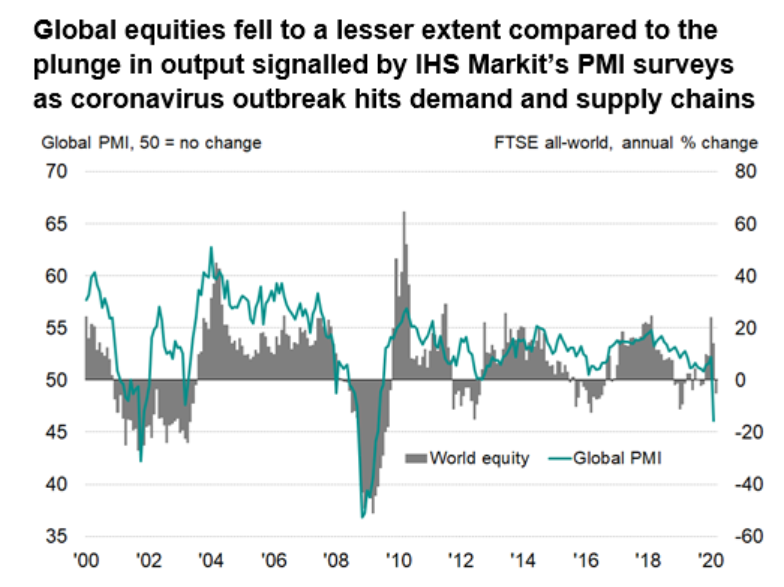
PMI and Equities
- Nice chart from IHS Markit showing PMIs against equities YoY change.
- Suggests equities not yet reflecting weak PMIs.
- World Index P/E is about 15x and earnings still need to come down.
Covid
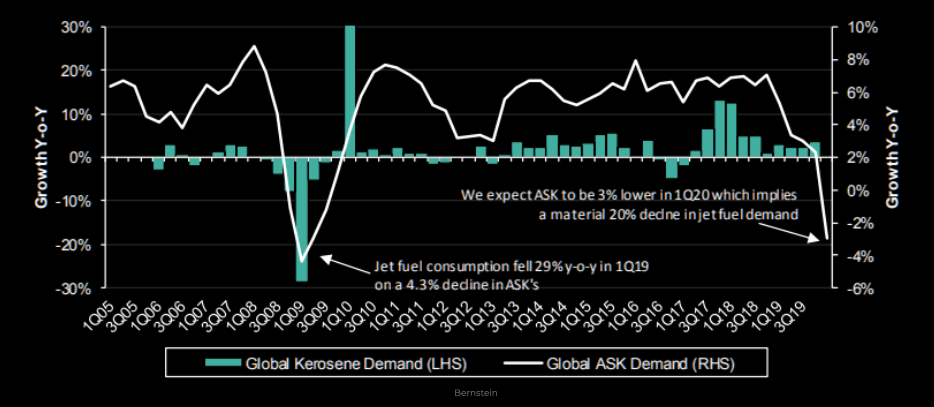
Oil Demand
- Q1 2020 decline in air travel demand is similar to Q1 2009.
- Kerosene demand is going to suffer strongly.