- Many investors look at the headline PMI number (46.3) but some of the guts of the release are well worth reading.
- FXmacro newsletter pulls the main quotes and categorises them into positive and negative.
- Very useful and worth subscribing.
Macroeconomics
Snippets on the big picture.

Conversation on China
- Conversation between Tyler Cowen and Yasheng Huang on China.
- Wide ranging and in-depth, especially understanding the cultural, historic and sociological drivers that help understand China and turbulence ahead.
- “One reason is the charisma power of individual leaders, Mao and Xiaoping … they could do whatever they wanted while being able to contain the spillover effects of their mistakes. The big uncertain issue now is whether Xi Jinping has that kind of charisma to contain future spillover effects of succession failure.”
- “This is a remarkable statistic: Since 1976, there have been six leaders of the CCP. Of these six leaders, five of them were managed either by Mao or by Deng Xiaoping. Essentially, the vast majority of the successions were handled by these two giants who had oversized charisma, oversized prestige, and unshakeable political capital”.
- Also a super interesting discussion on “why Chinese and Chinese Americans have done less well becoming top CEOs of American companies compared to Indians and Indian Americans”.
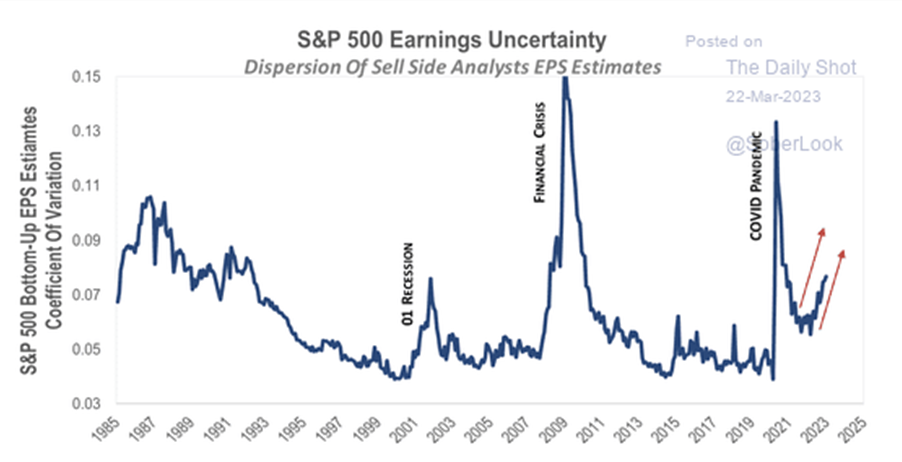
Dispersion of Sell-Side Estimates on the Rise
- Typically a sign of economic turbulence.
- Source: Daily Shot.
Persistent Inflation?
- Core inflation is taking much longer to cool than in previous historic periods.
- Source: KKR.

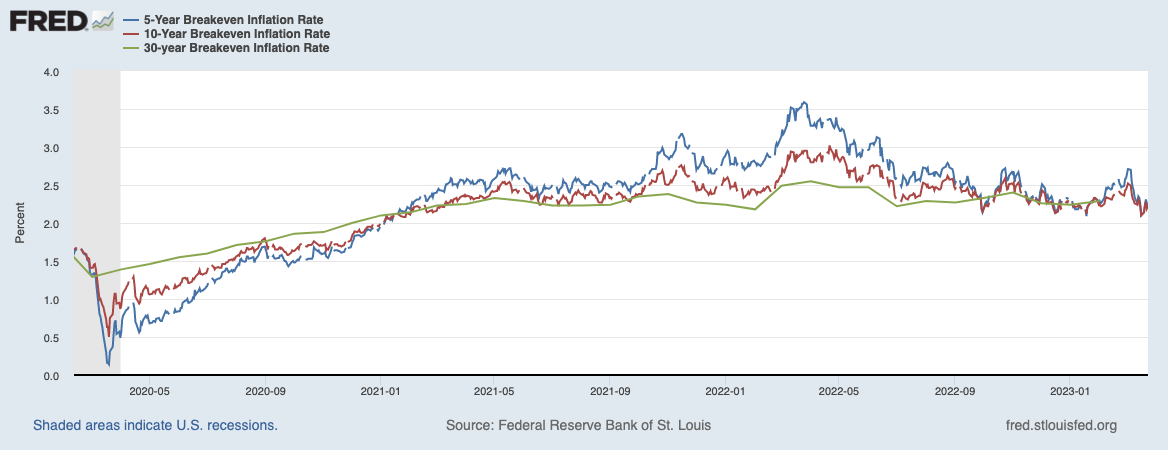
Breakeven Inflation Rates
- Although up this past week, this crucial market rate continues to drift down after peaking in mid-2022.
- Source: The comprehensive and ever-useful FX macro newsletter. Check it out here.
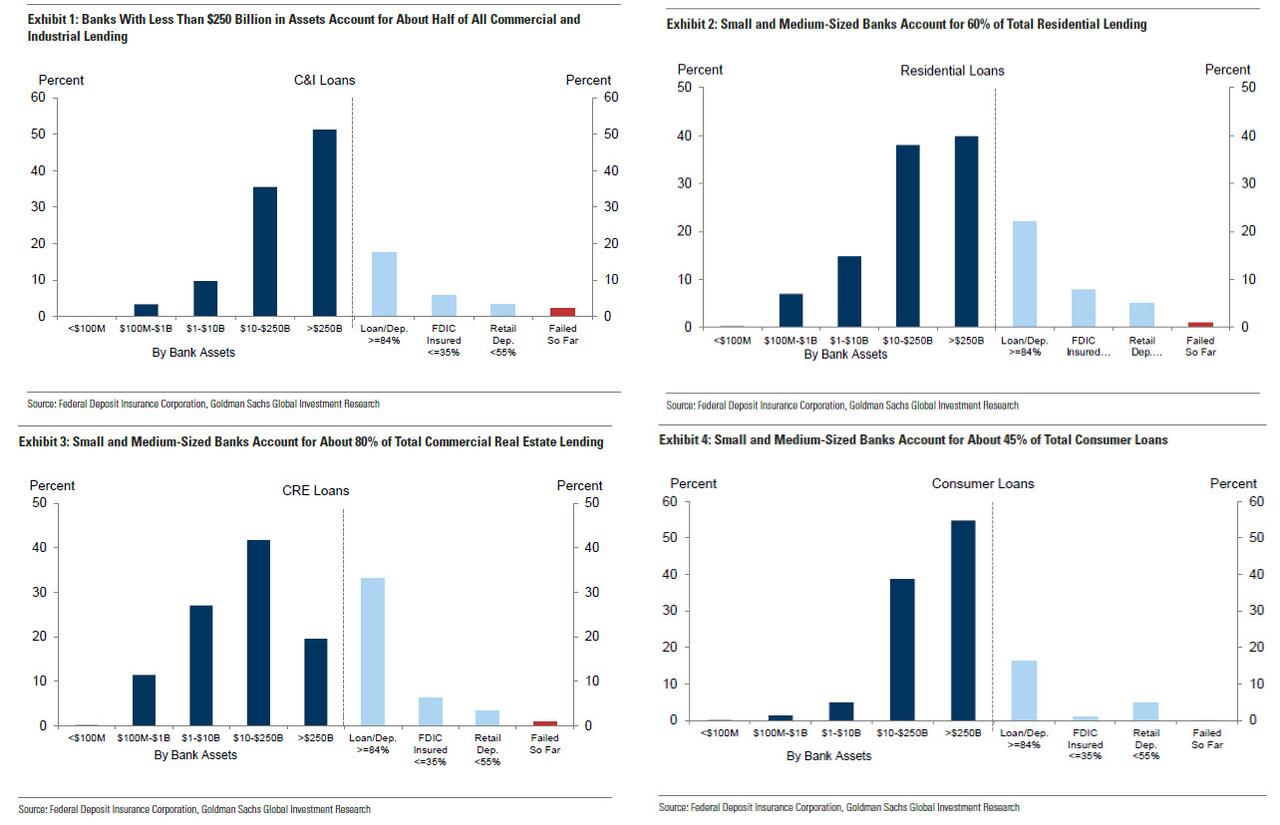
Small Banks are Vital for Lending
- As you think through the second-order effects of recent bank failures, these charts are worth keeping in mind.
- Small banks account for 50% of commercial and industrial (C&I), 45% of consumer and 80% of commercial real estate (CRE) lending in the US.
- Source.
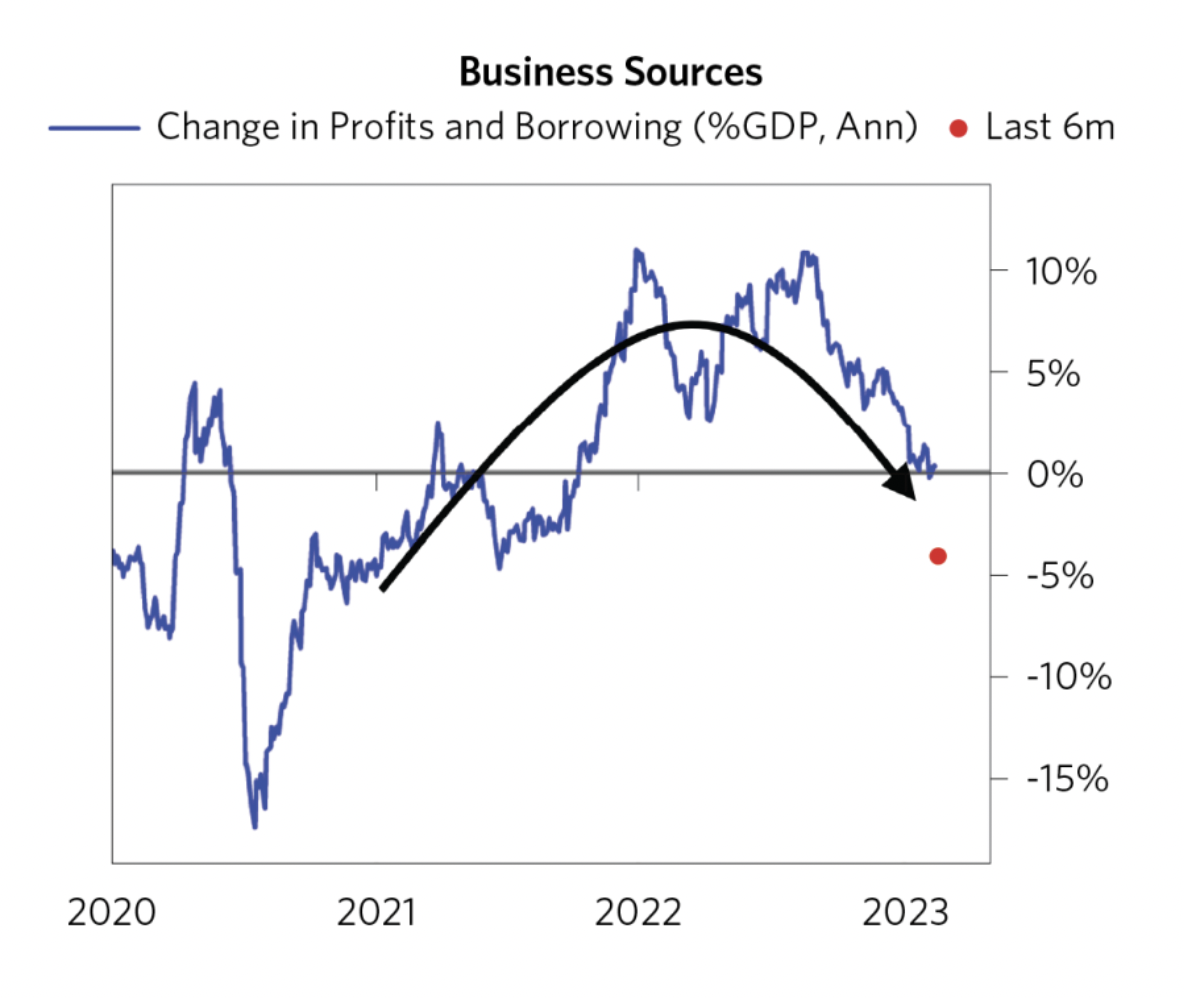
Sources of Funds
- Businesses have seen sources of funds (profits and credit) start to fall according to this Bridgewater analysis.
- “As you would expect, when this happens, they cut back first on buybacks and M&A, then on capex, and last of all hiring.”
- Once the latter happens consumer spending suffers and contraction ensues.
- Though they do point out that earnings have yet to fall the required amount for this to start properly.
PMI Global Heatmap
- U.K. and US are seeing some improvement, while Germany continues deeper in the red.
- Taken from this comprehensive and user friendly newsletter – a veritable tour of everything macro. Well worth subscribing.

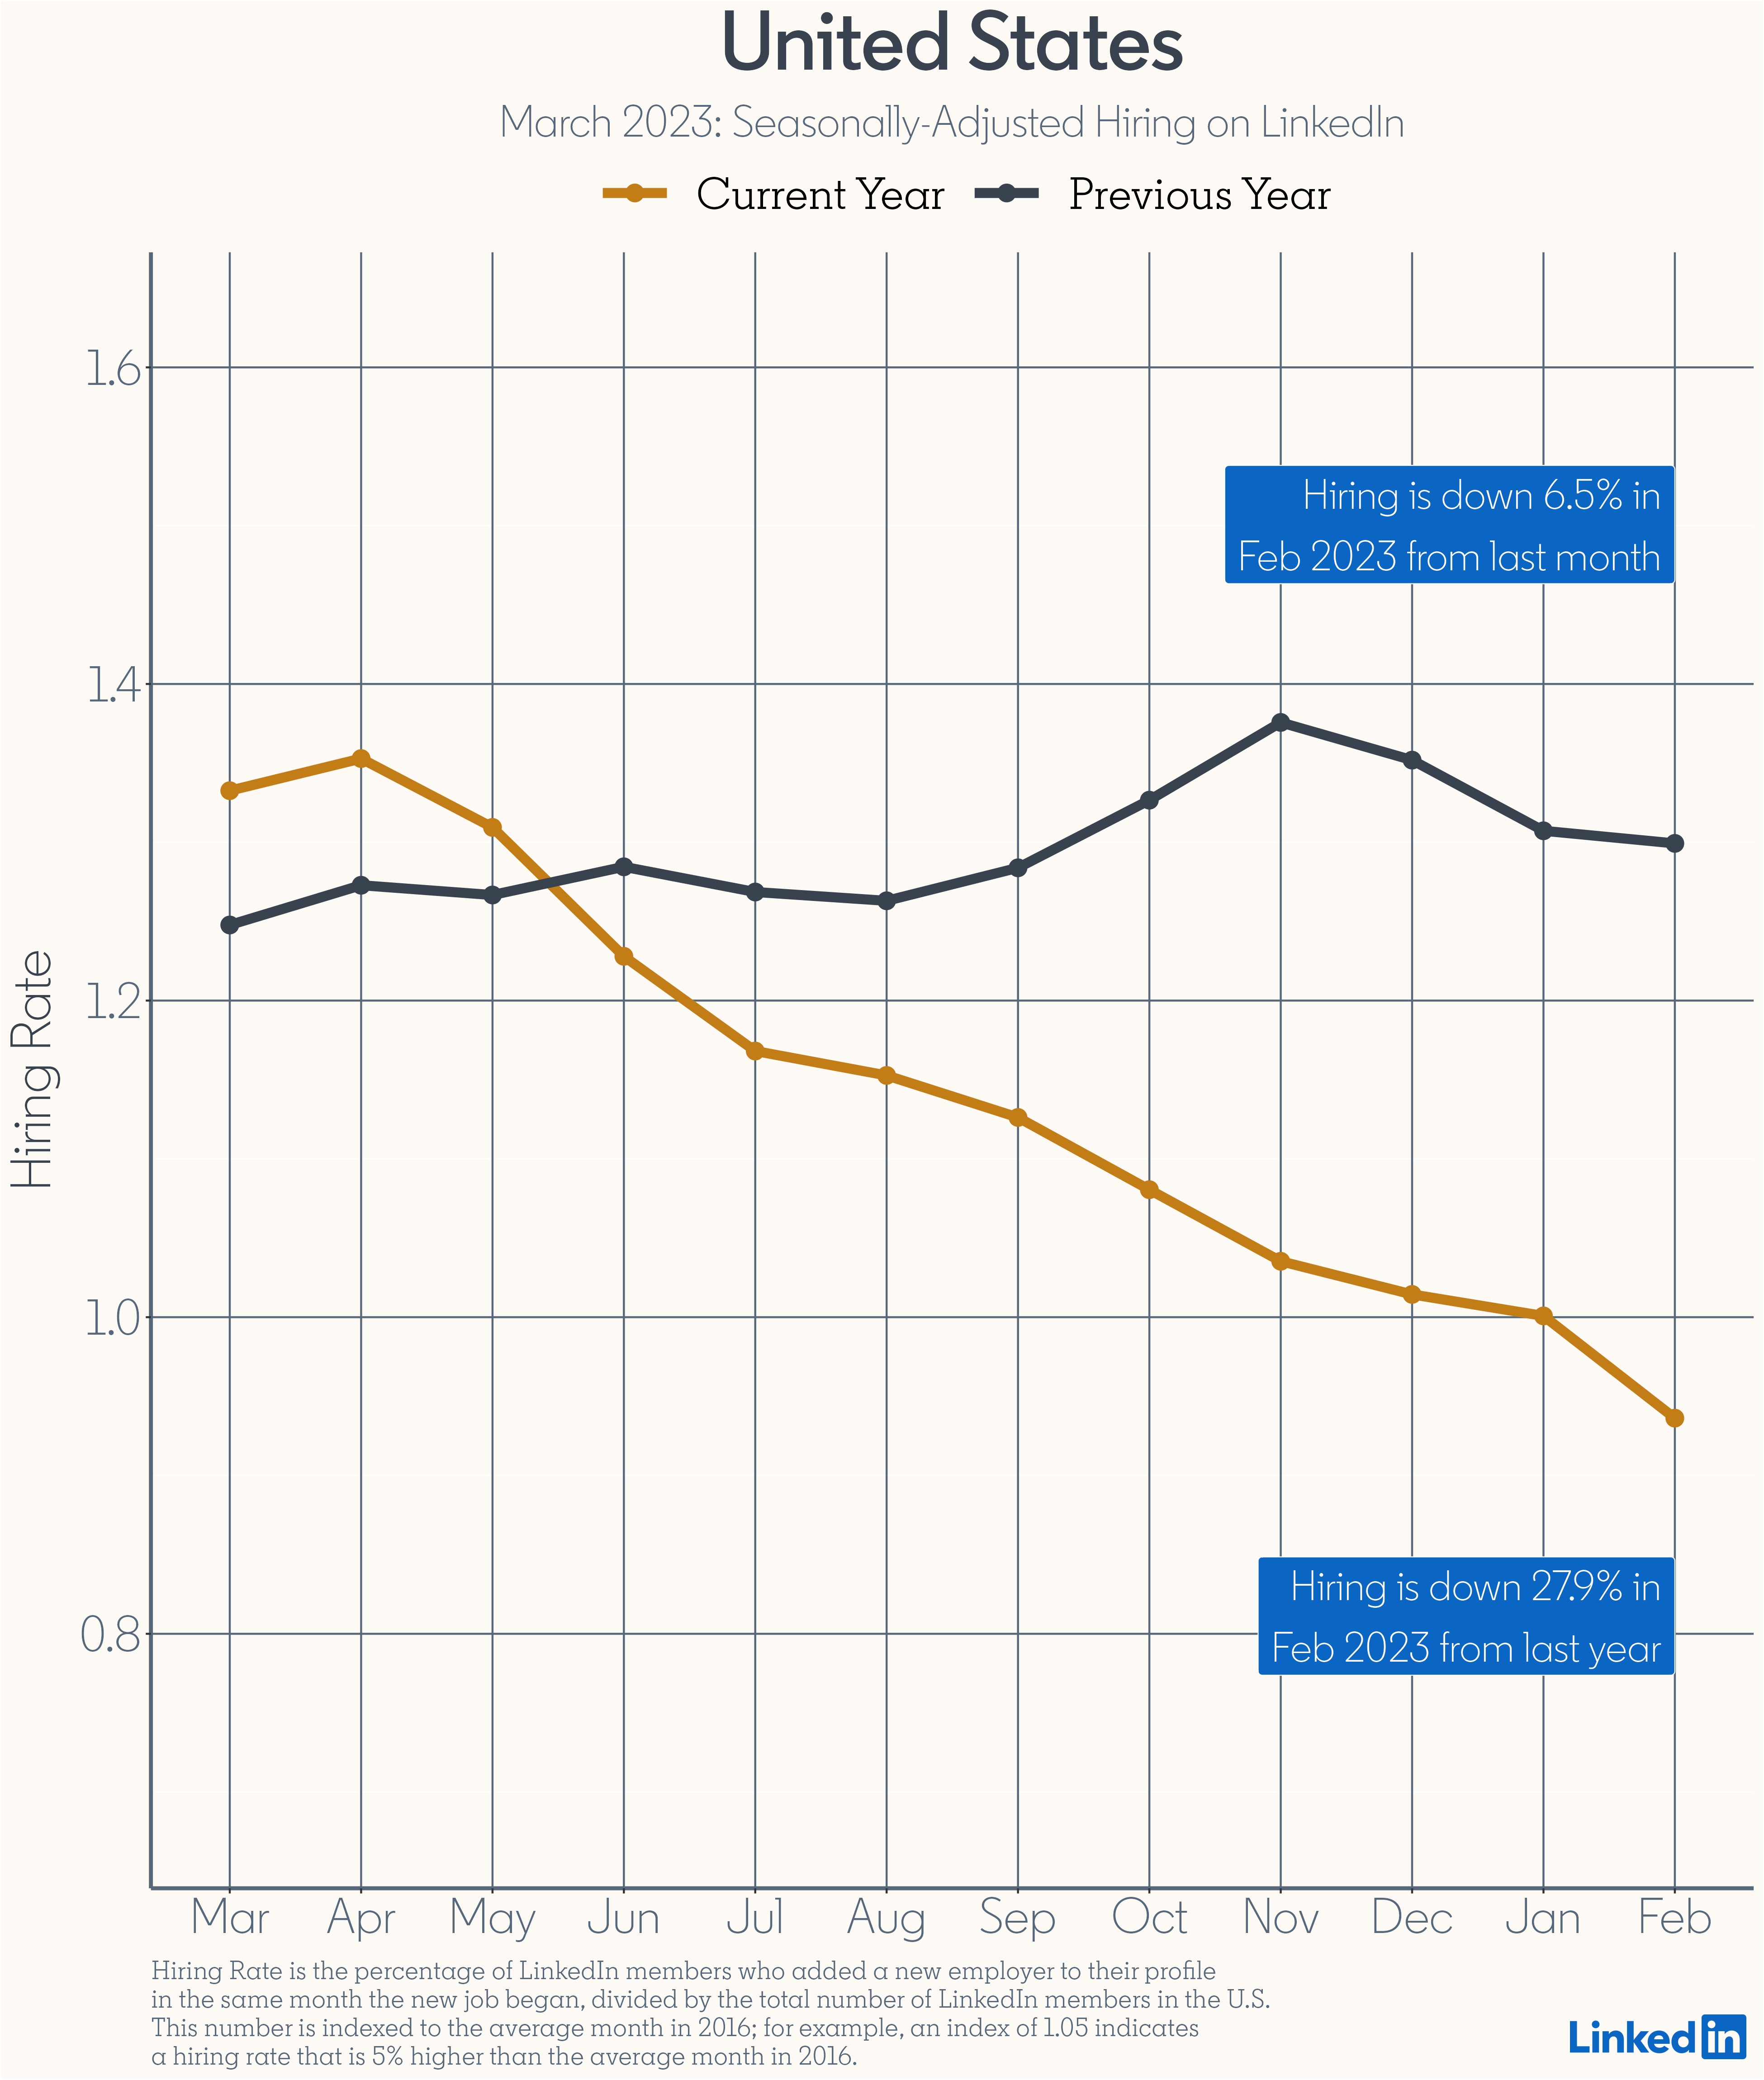
LinkedIn Workforce Data
- The social network and it’s 199m members is a rich source of data.
- Here is their latest workforce report.
- “Nationally, across all industries, hiring decreased 6.5% in February compared to January. This is the largest month-over-month decrease we’ve seen since April 2020, though we don’t expect declines of this magnitude to occur on a regular basis going forward. Year-over-year hiring decreased 27.9% – and hiring has now declined for 10 consecutive months“.
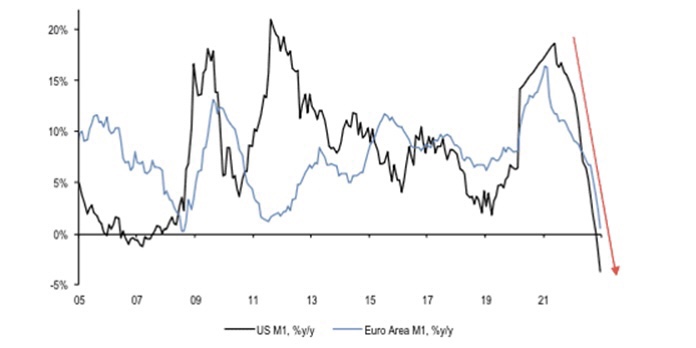
Decelerating Money Supply
- Money supply in developed markets keeps decelerating.
- In the US it’s in correction territory, for the first time since 2006.
- h/t: Daily Shot.
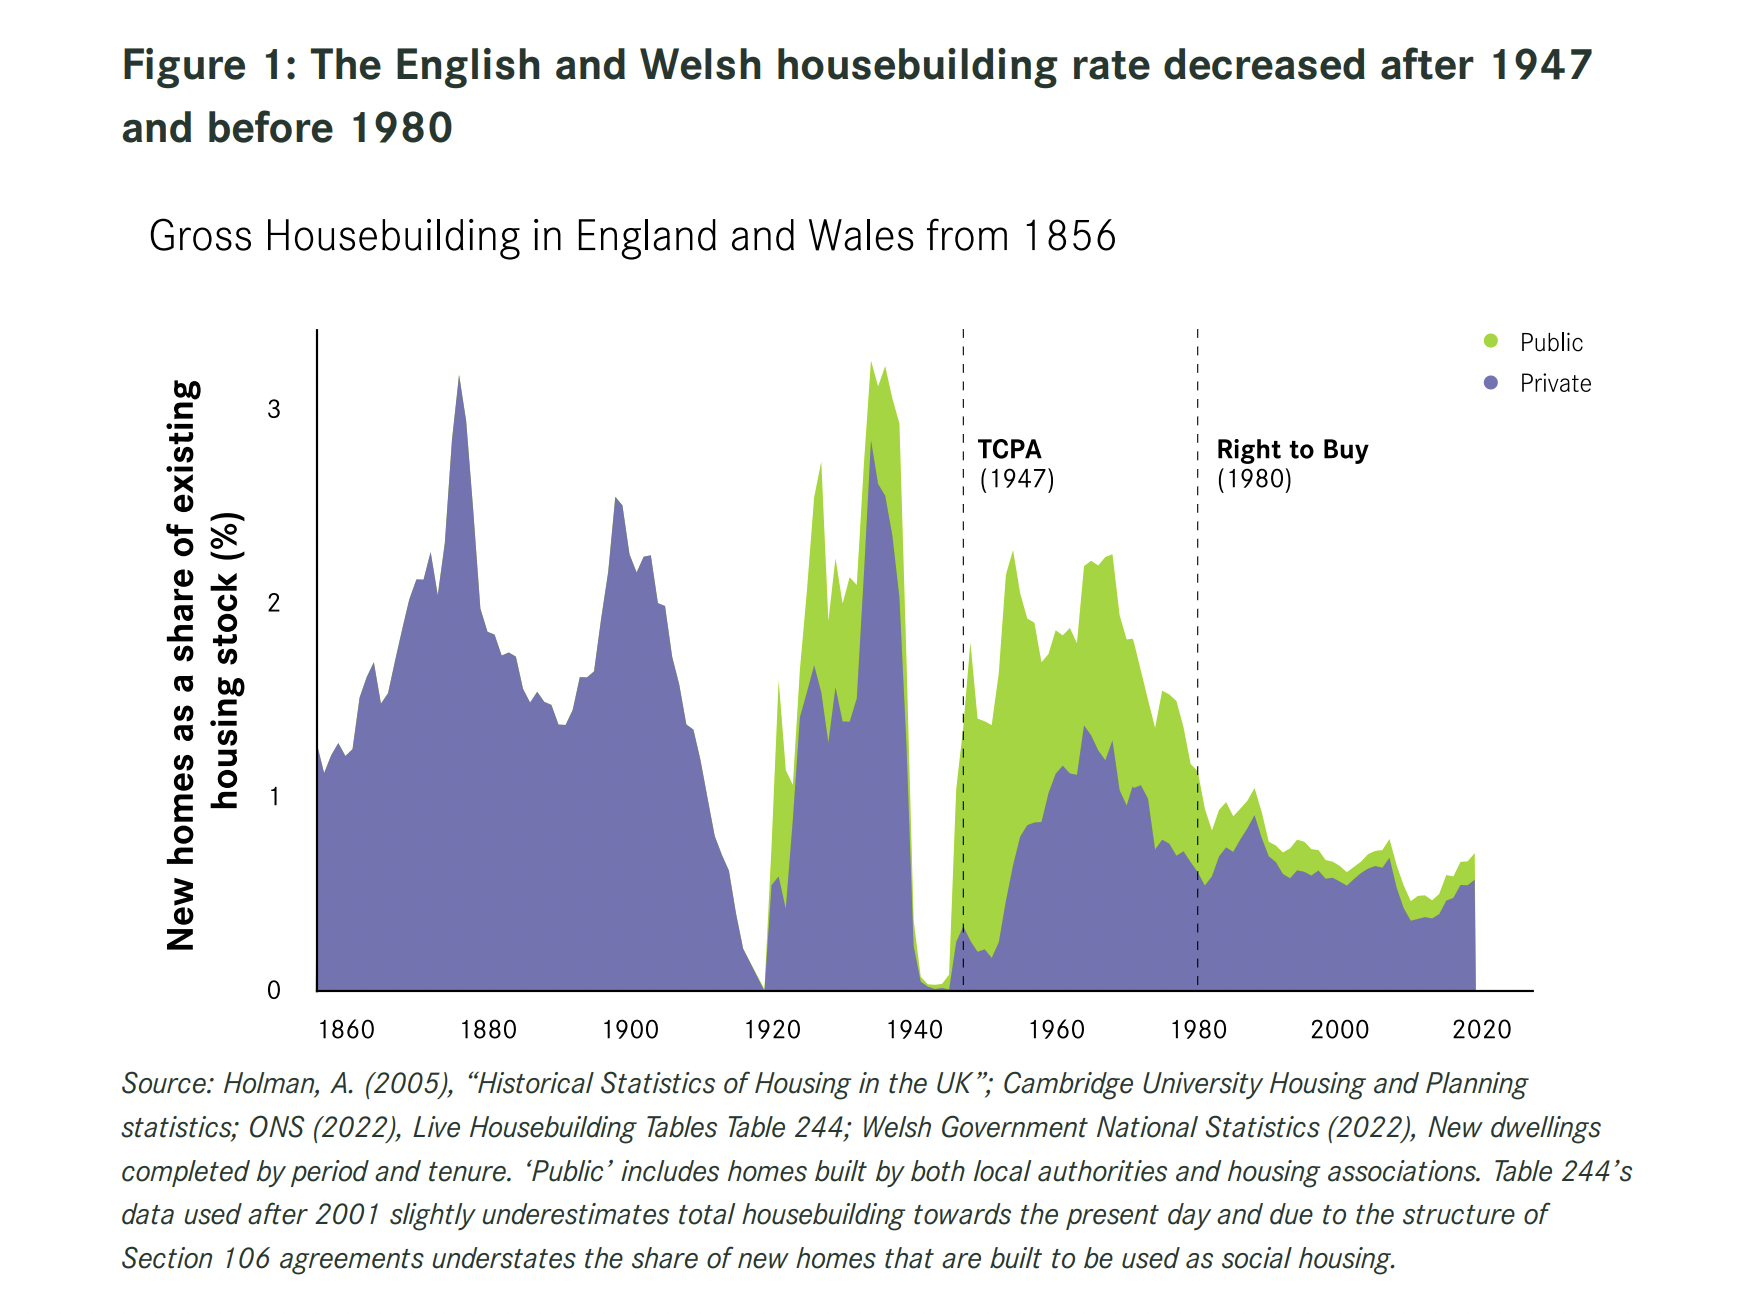
UK Housebuilding
- The UK has not built nearly enough houses according to this comprehensive report, especially when compared to other European countries.
Macro and EM Trader Interview
- “Czech Republic has one of if not the best reputation in policy-making credibility. When they signal a cutting cycle is to begin, its worth taking note.“
- Interesting interview throughout on all things EM and Macro.
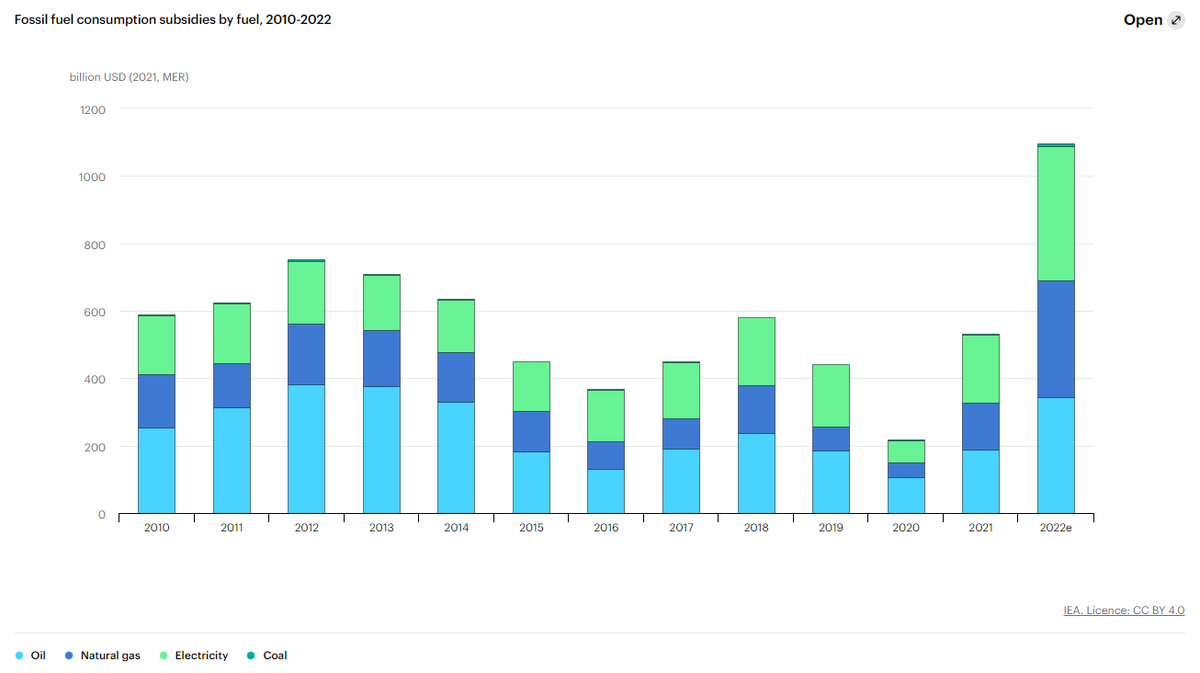
Fuel Subsidies
- Despite climate change dominating global headlines – fossil fuel consumption subsidies hit a record in 2022.
- Source.
Pakistan – a microcosm
- Climate change, debt, US-China economic conflict.
- The latest Pakistani crisis has it all, a captivating read.
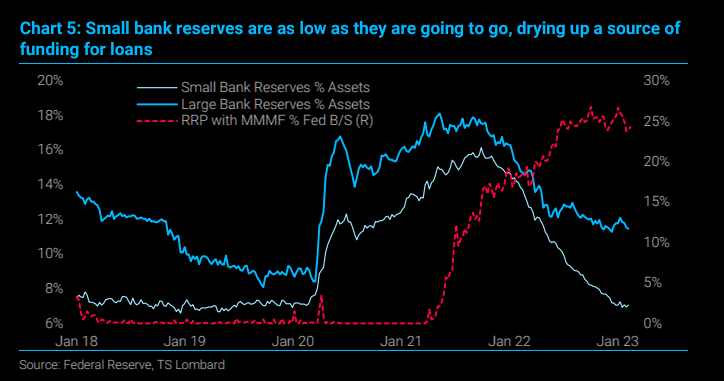
Bank Lending
- Reserves at small banks have dwindled, sapping a key source of lending in the US economy.
- This is linked to loan officers reporting a substantial tightening of lending standards (not a bad indicator of recession).
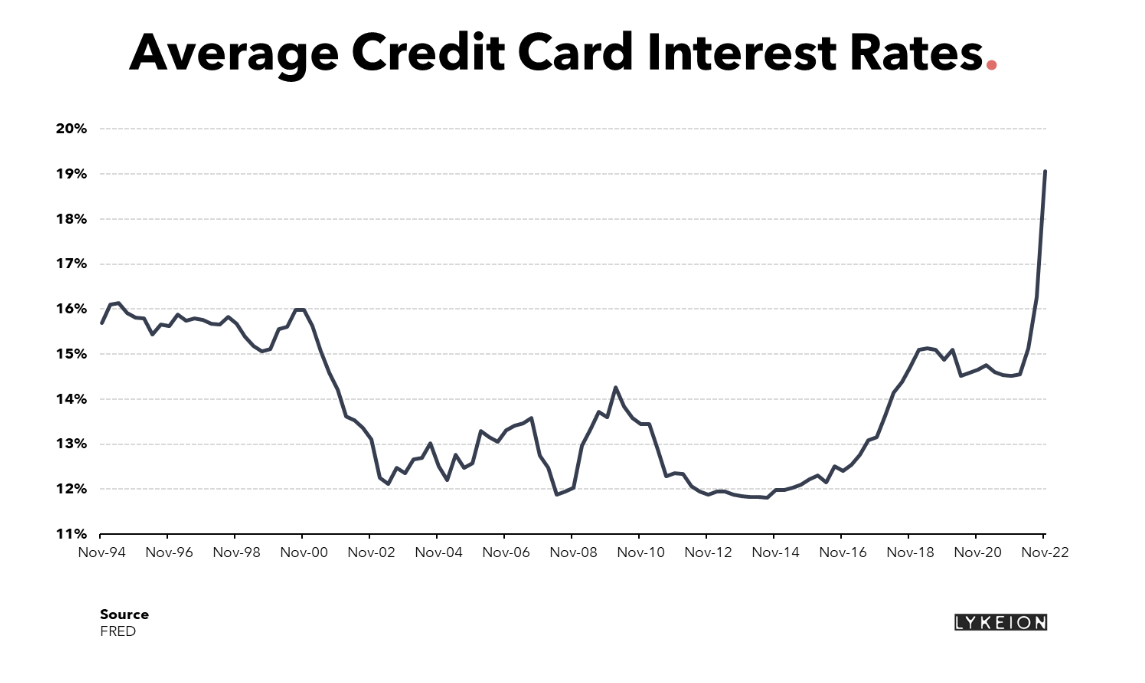
Credit Card Interest Rates
- US credit card debt is nearing $1trn, up $60bn last quarter.
- This is coinciding with a dramatic jump in interest rates since November 2022.
- Average rates are now above those seen in the 1980s.
- Source: Lykeion’s excellent Charts of The Month (worth subscribing).
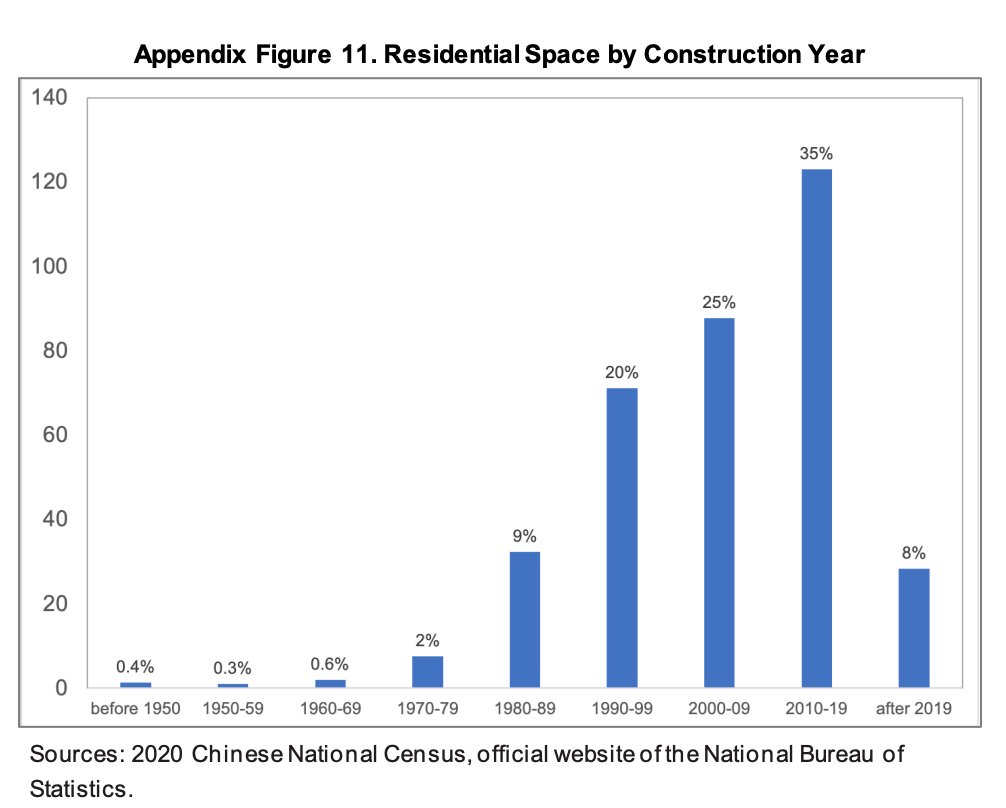
Chinese Construction Boom
- 43% of Chinese residential homes were built after 2010.
- Let that sink in.
- “If you put this in relation to total population it implies that in a single generation, China has built enough homes to house a billion people.”
- Source: Rogoff & Yang (h/t Adam Tooze)
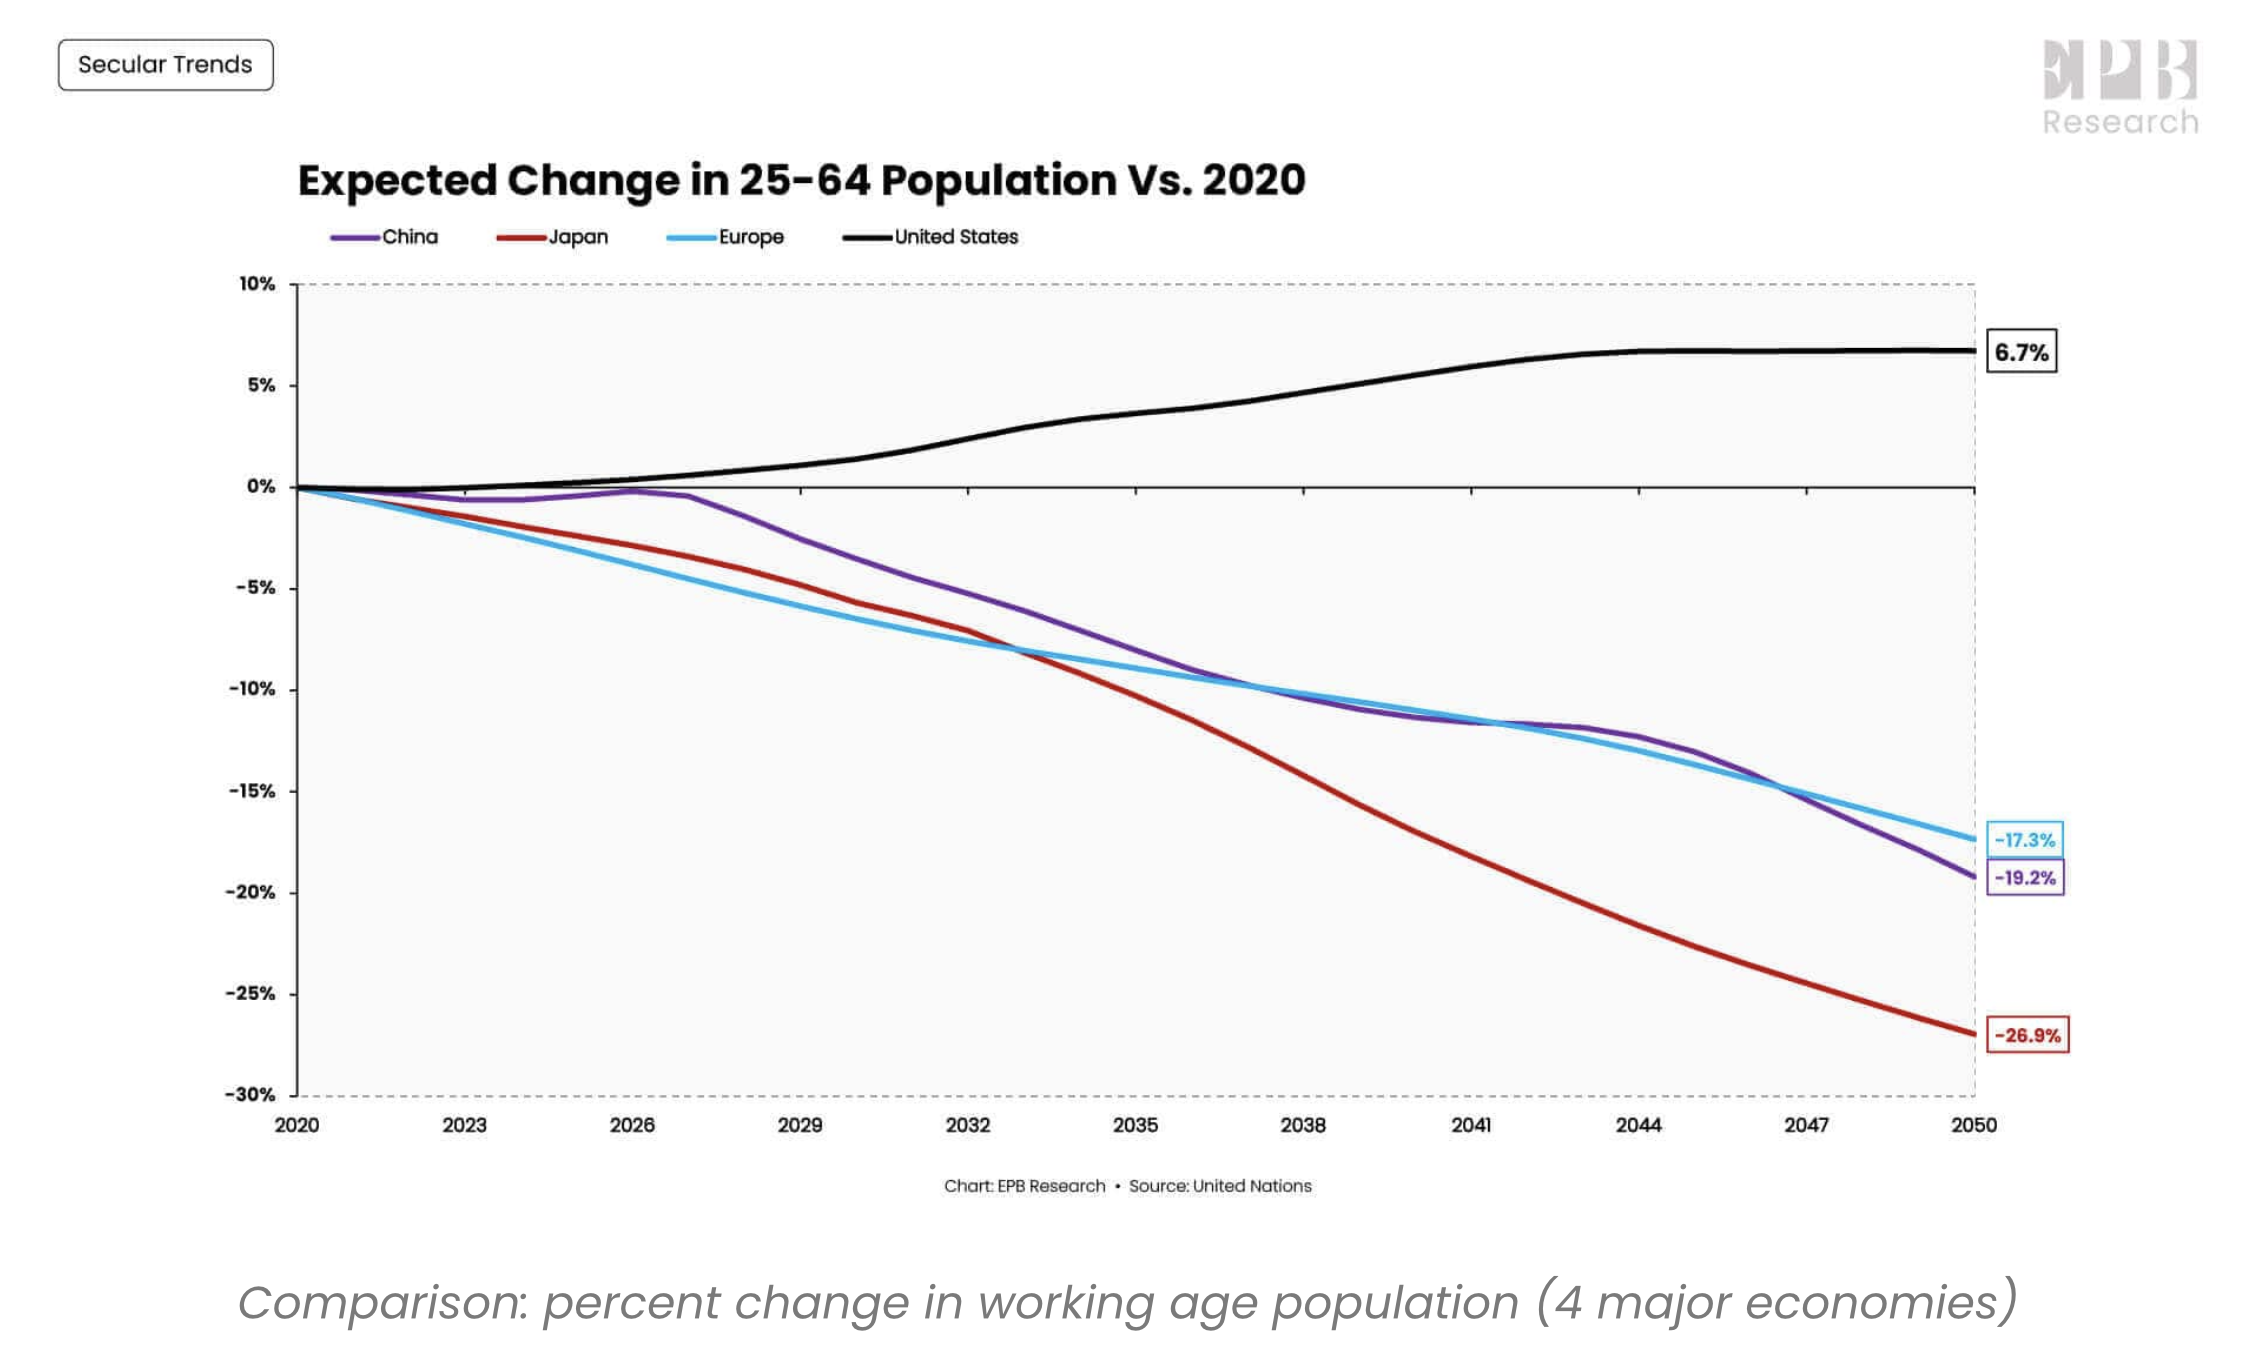
Demographics
- Four regions, the US, Europe, Japan, and China, make up 70% of the world’s consumption.
- In 2020 this group was home to 1.47 billion people aged 25-64, the prime demographic. By 2050 there will be 1.2 billion. “That’s an 18% decline in the working age population for the four largest economic regions.“
- The US, as seen in this chart, fares best as it sees this cohort grow. However, at slower rates than before and facing a decline as a proportion of the overall population.
- As goes population, so does long-term growth.
- Source.
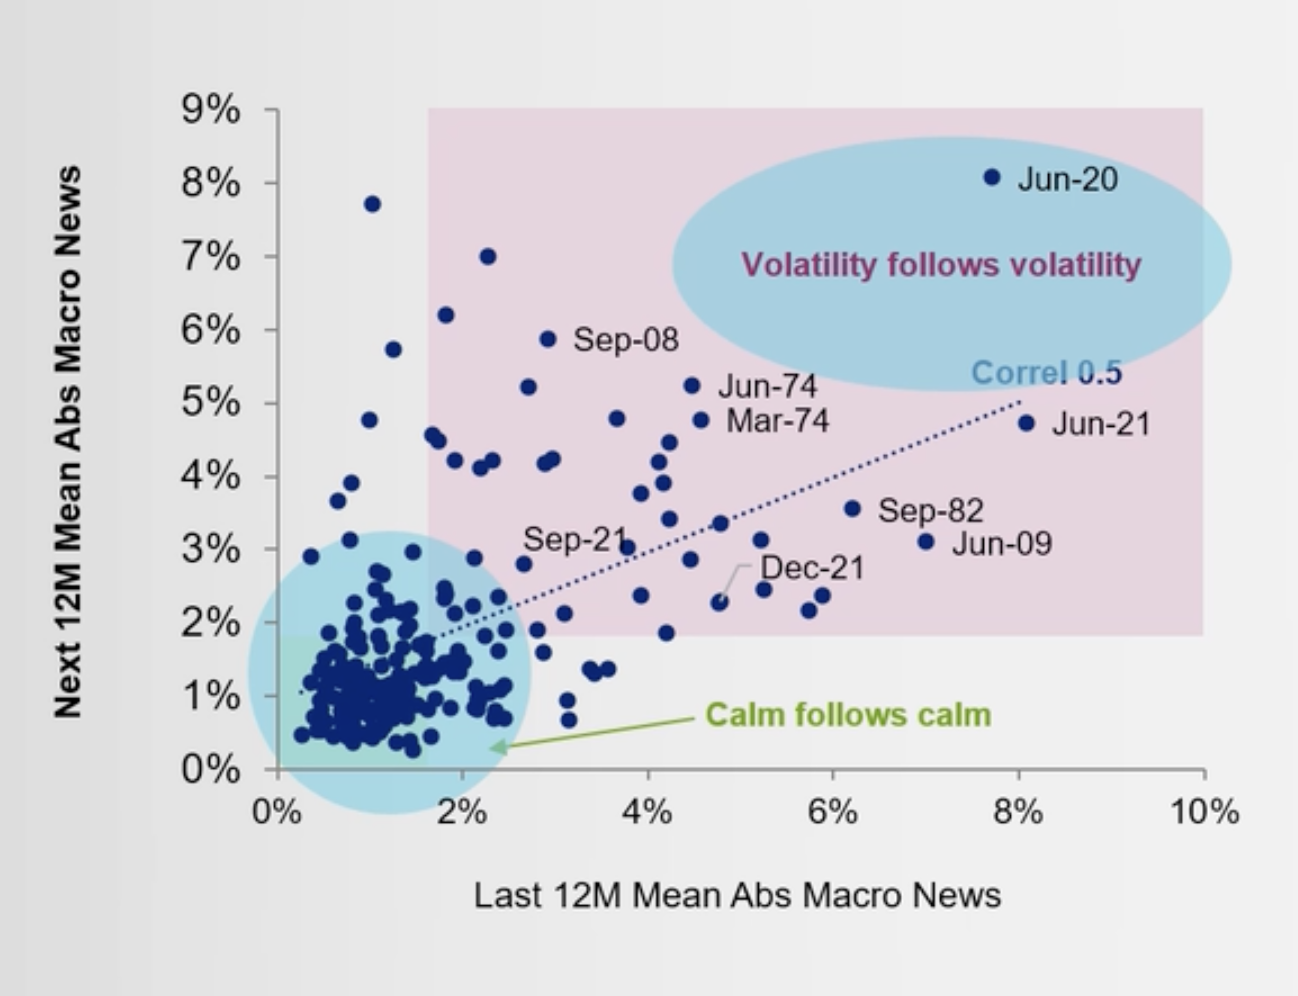
Macro Vol is Persistent
- Calm begets more calm, volatility begets more volatility.
- Source.
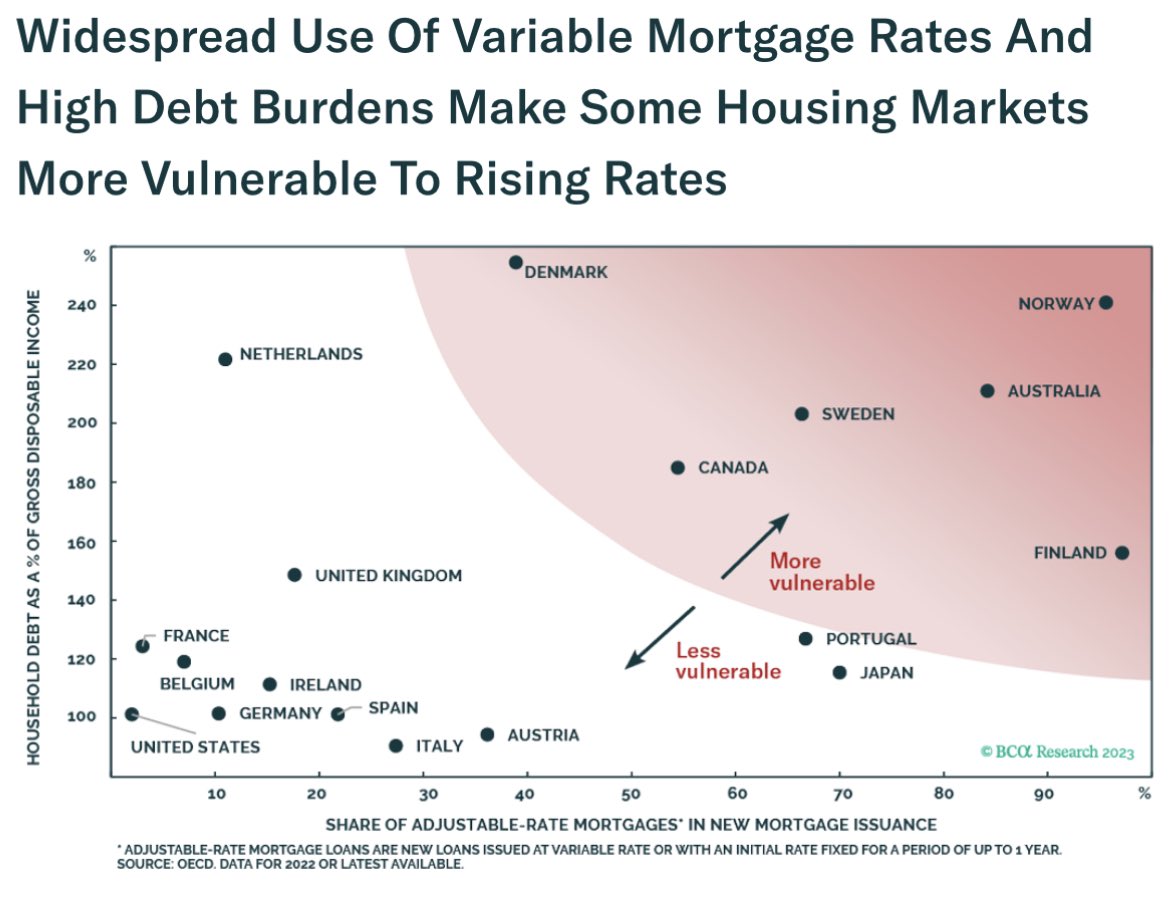
Housing Market Vulnerability
- Chart from BCA Research plotting housing markets by (1) debt to income and (2) proportion of variable rate mortgages of total issuance.
- This should be paired with price dynamics.