- Chart showing change in housing valuations (based on two metrics).
- Italy, as usual, stands out as having seen very little in the way of a housing boom.
- Source: Gavekal via Daily Shot.
Macroeconomics
Snippets on the big picture.

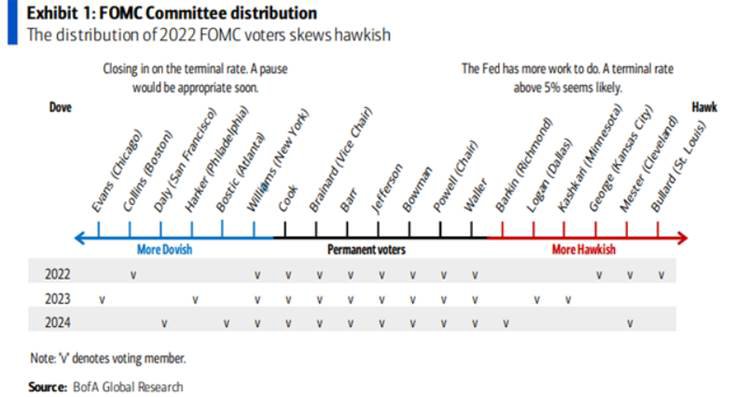
Hawks
- The big hawks on the FOMC lose their vote in 2023.
- Source: BAML via Hamilton Lane.
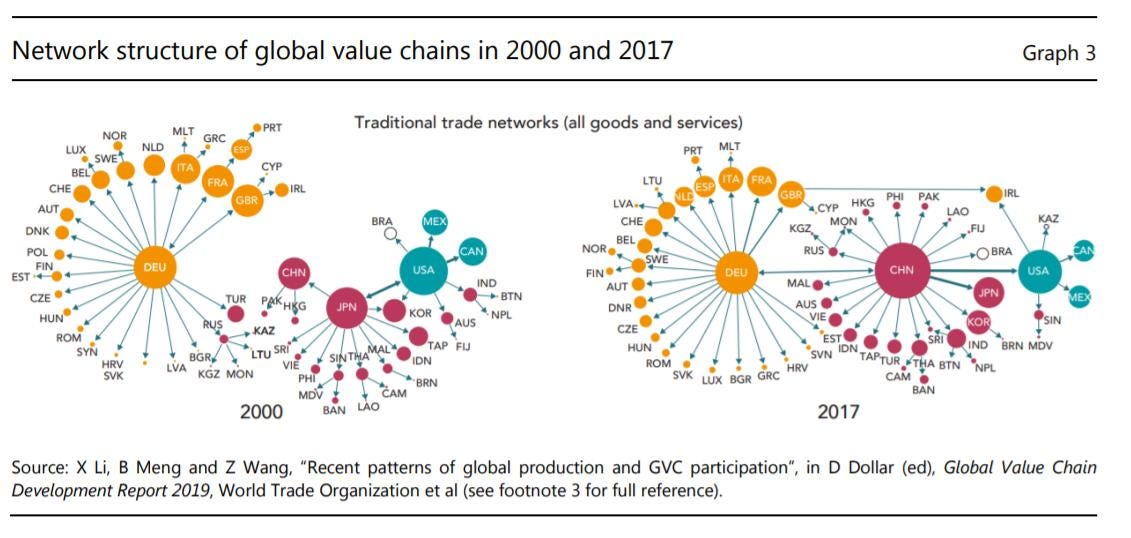
Global Value Chains
- WTO chart showing how the world has changed from 2000 to 2017 in terms of trade networks.
- Chimes with this.
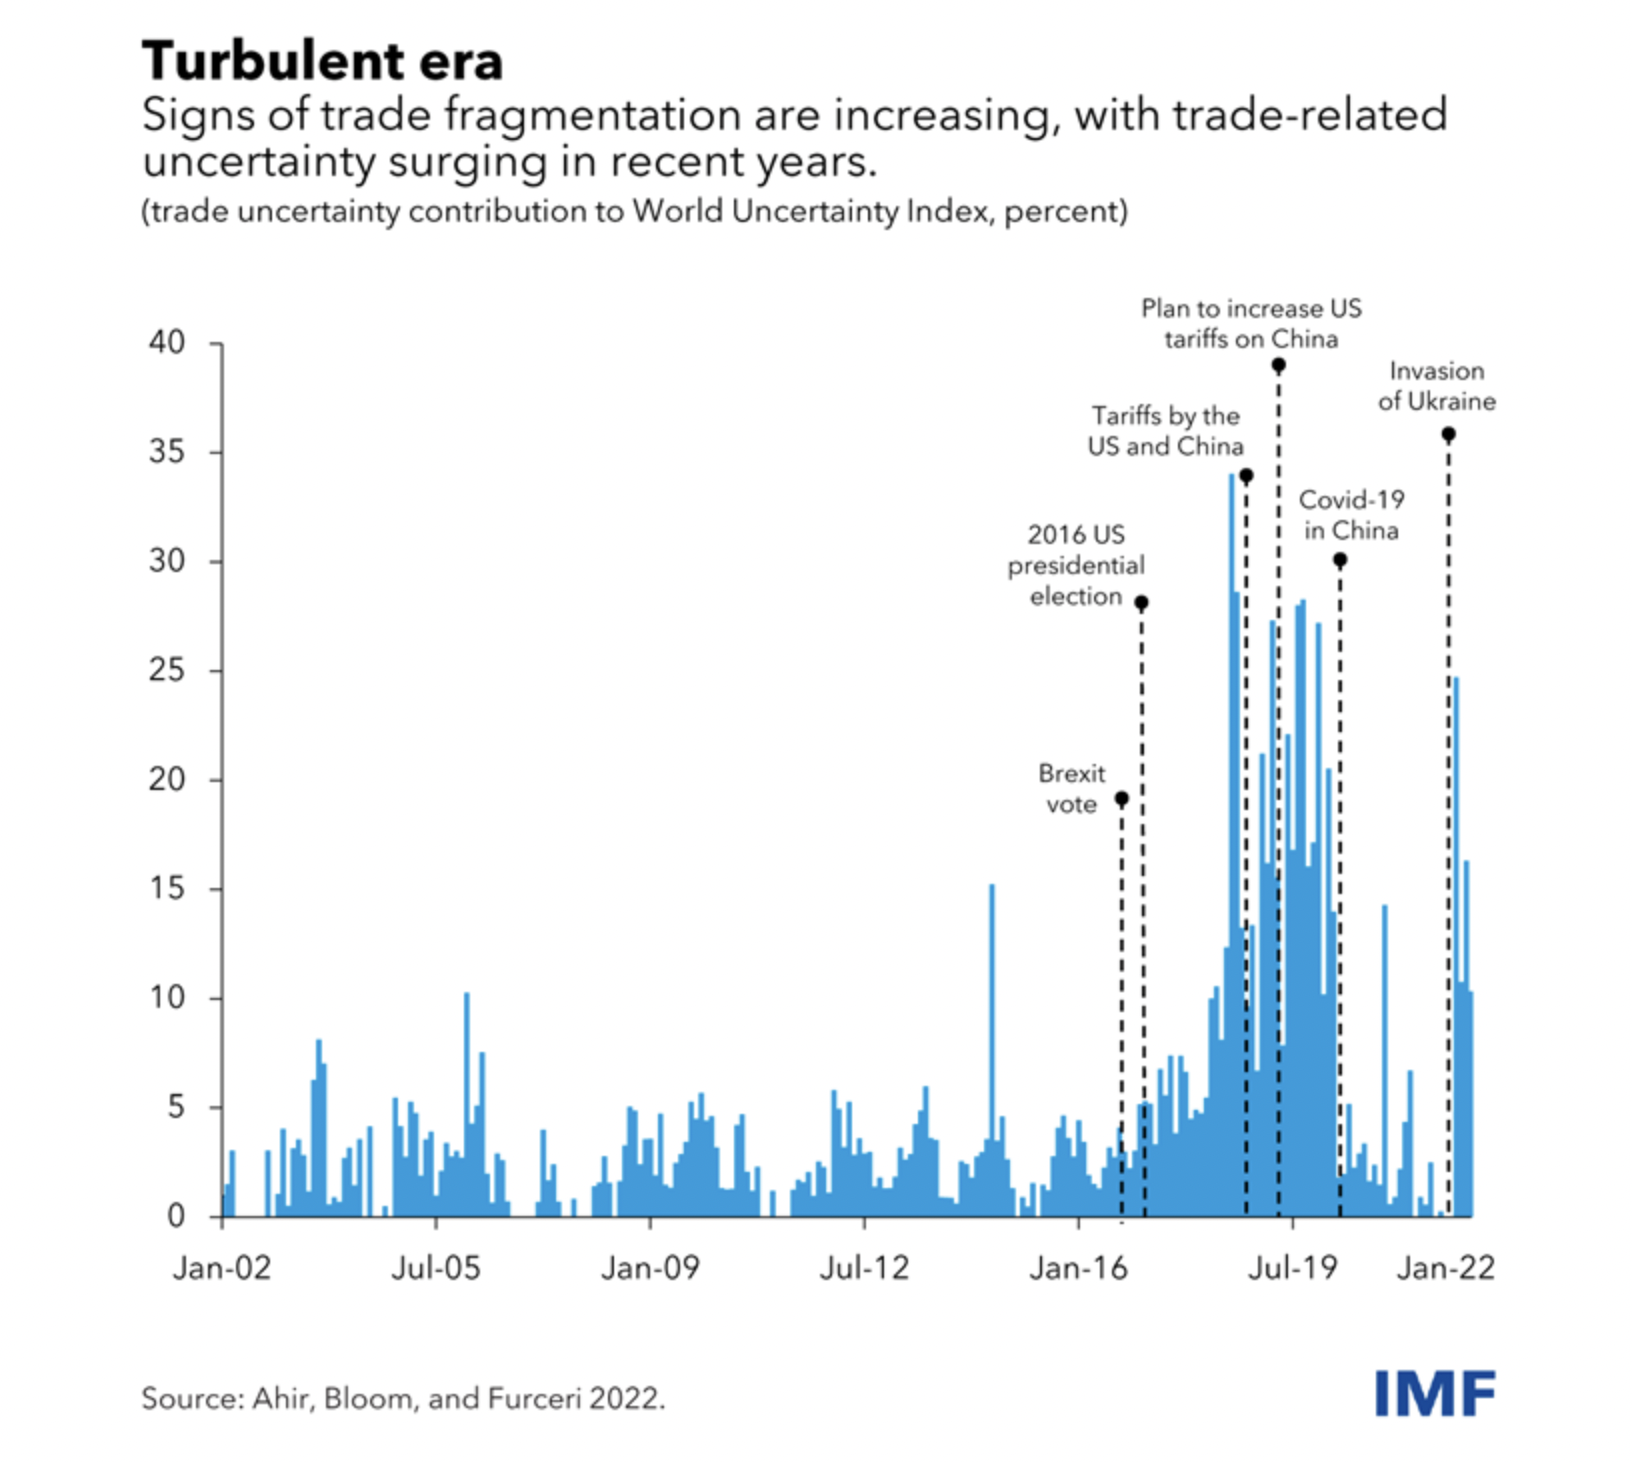
Trade Tensions
- Worrying rise in fragmentation documented by IMF.
- Source.
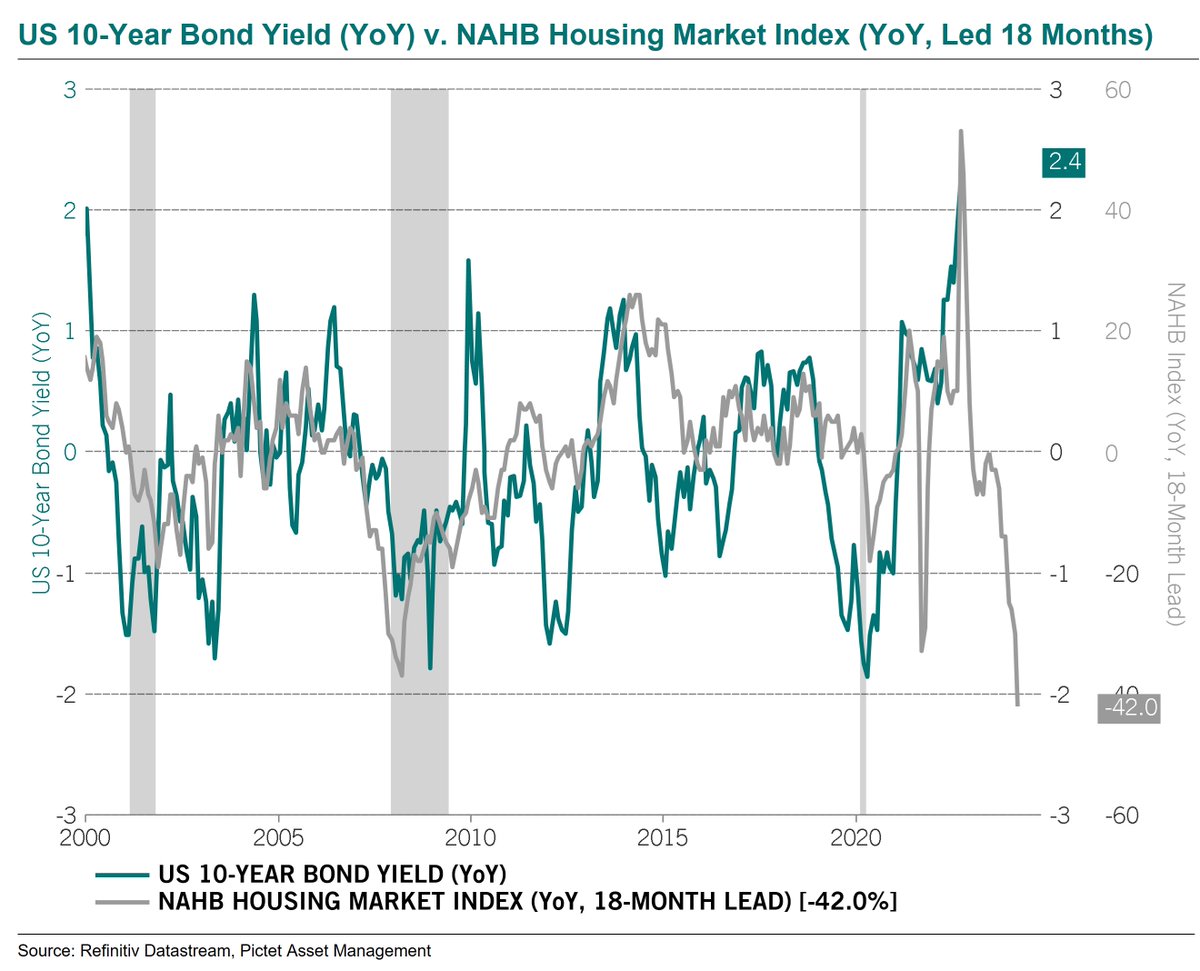
Housing and Yields
- These charts are sometimes spurious and definitely make econometricians cringe.
- However, heuristically, they can be helpful.
- This one suggests bond yields are going lower as housing sentiment is in free fall (18 month lead).
- h/t.
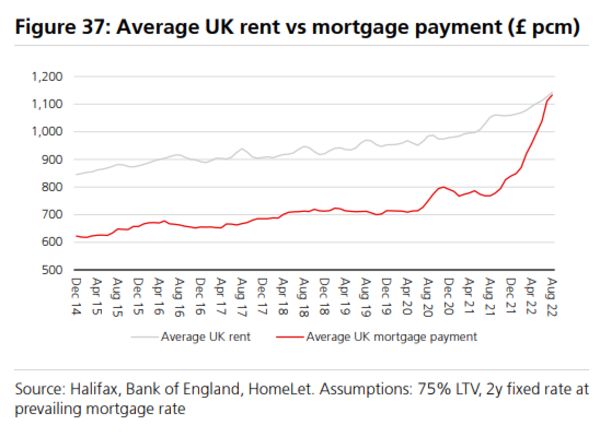
Renting vs. Owning
- For the first time in many years, it is better to rent than to own in the UK.
- Source.
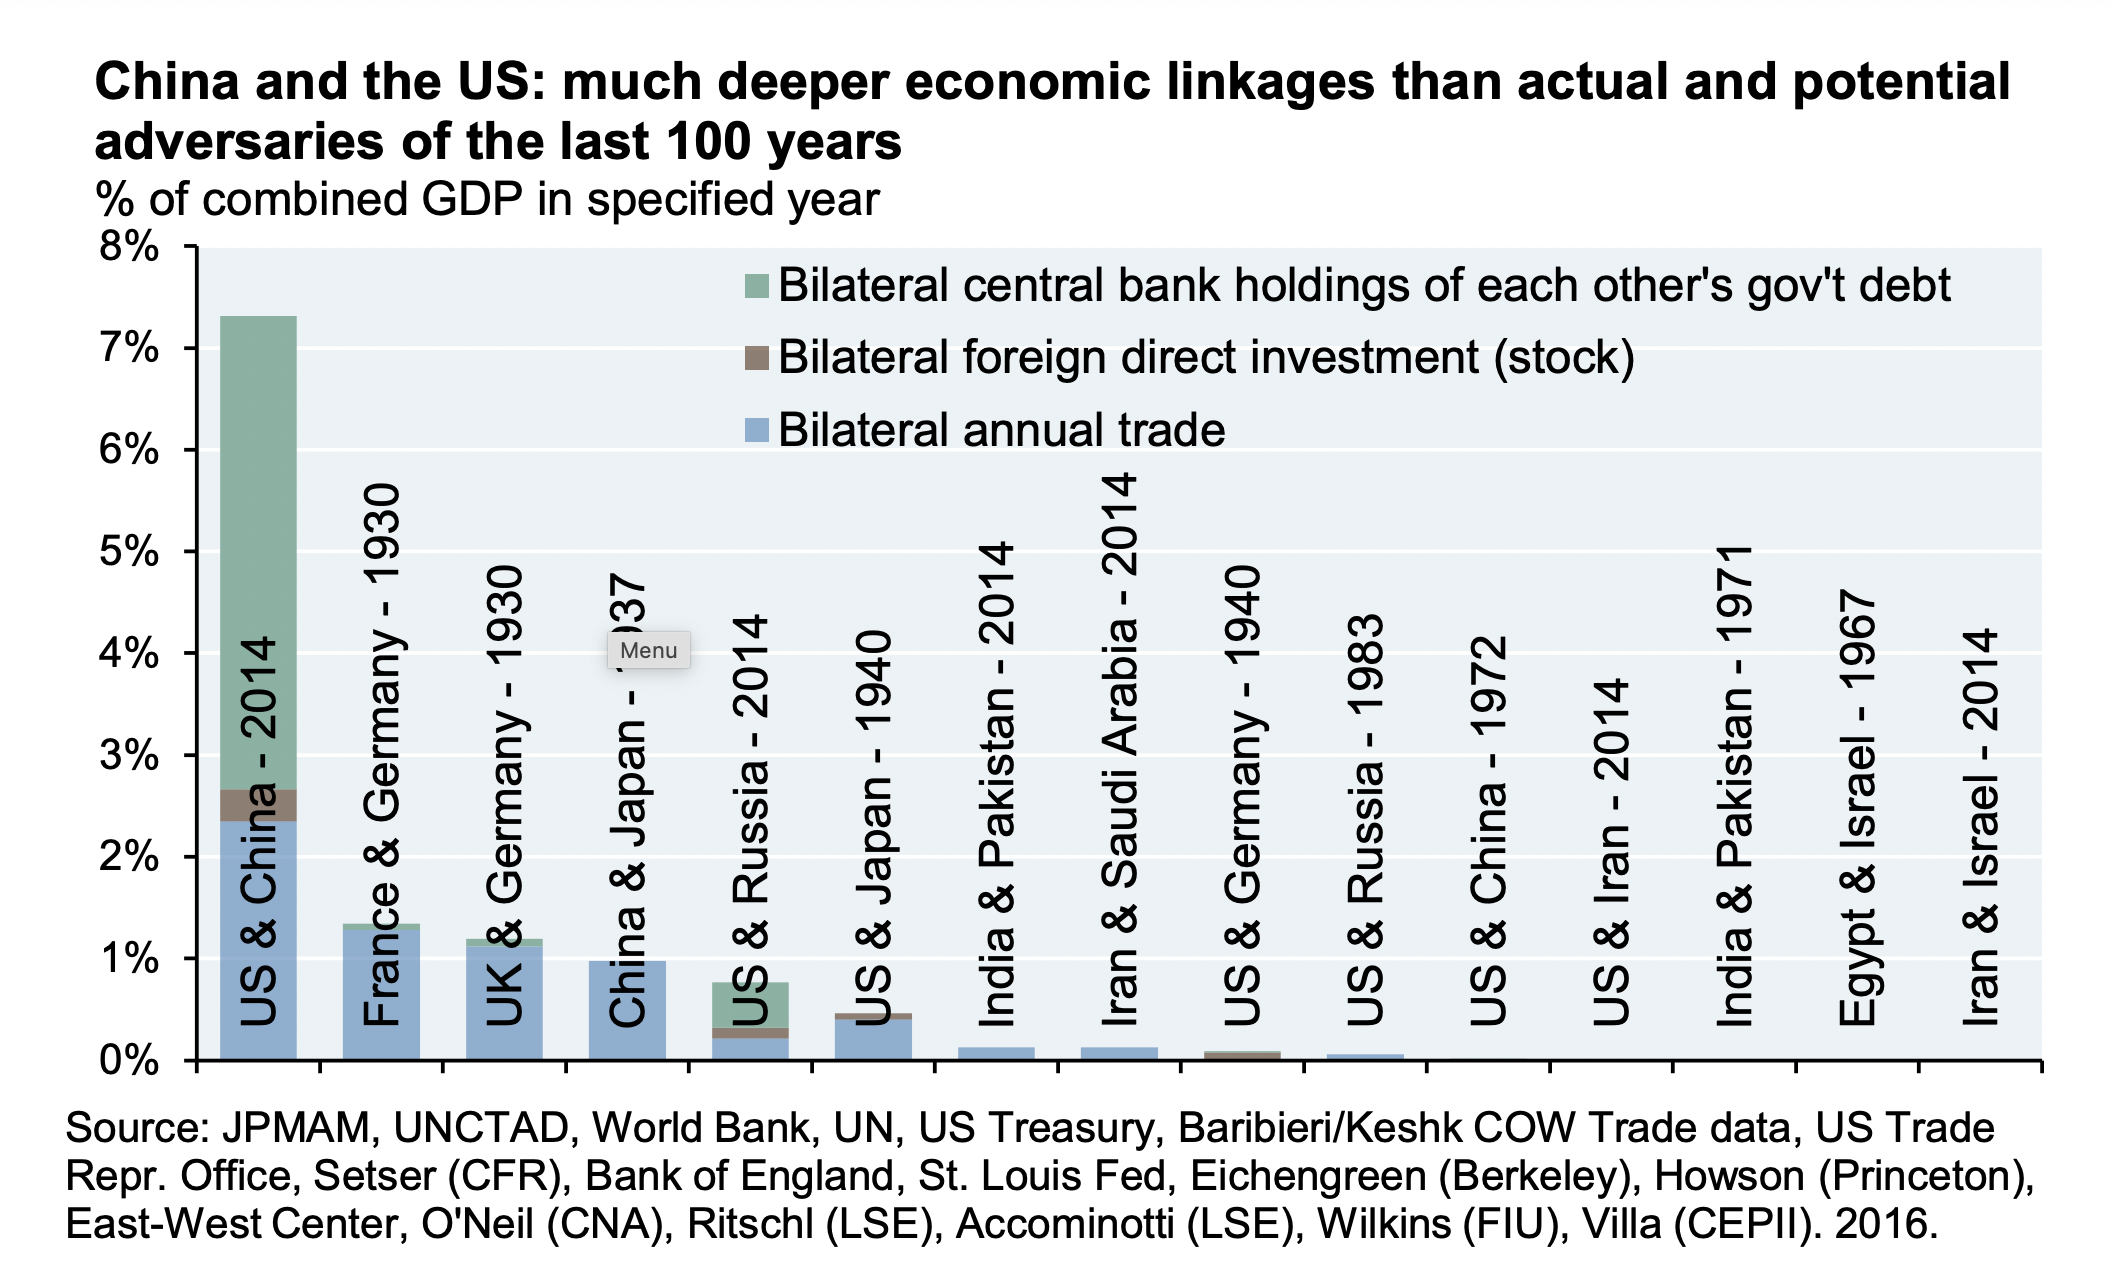
China and US Rivalry
- “By Allison’s account, in 12 of 16 historical examples, competing empires ended up in military conflict, and Allison sees the US-China relationship as a rerun of these precedent“
- The counter point is this great chart from JPM showing how intertwined economically the two powers are vs. historic struggles.
- However, the direction of travel isn’t supportive.
- A prime example is 2022 CHIPS Act, the most bipartisan piece of legislation in a long time.
- NB this was a good transcript covering the impact on semi equipment companies (use this link to sign up for free).
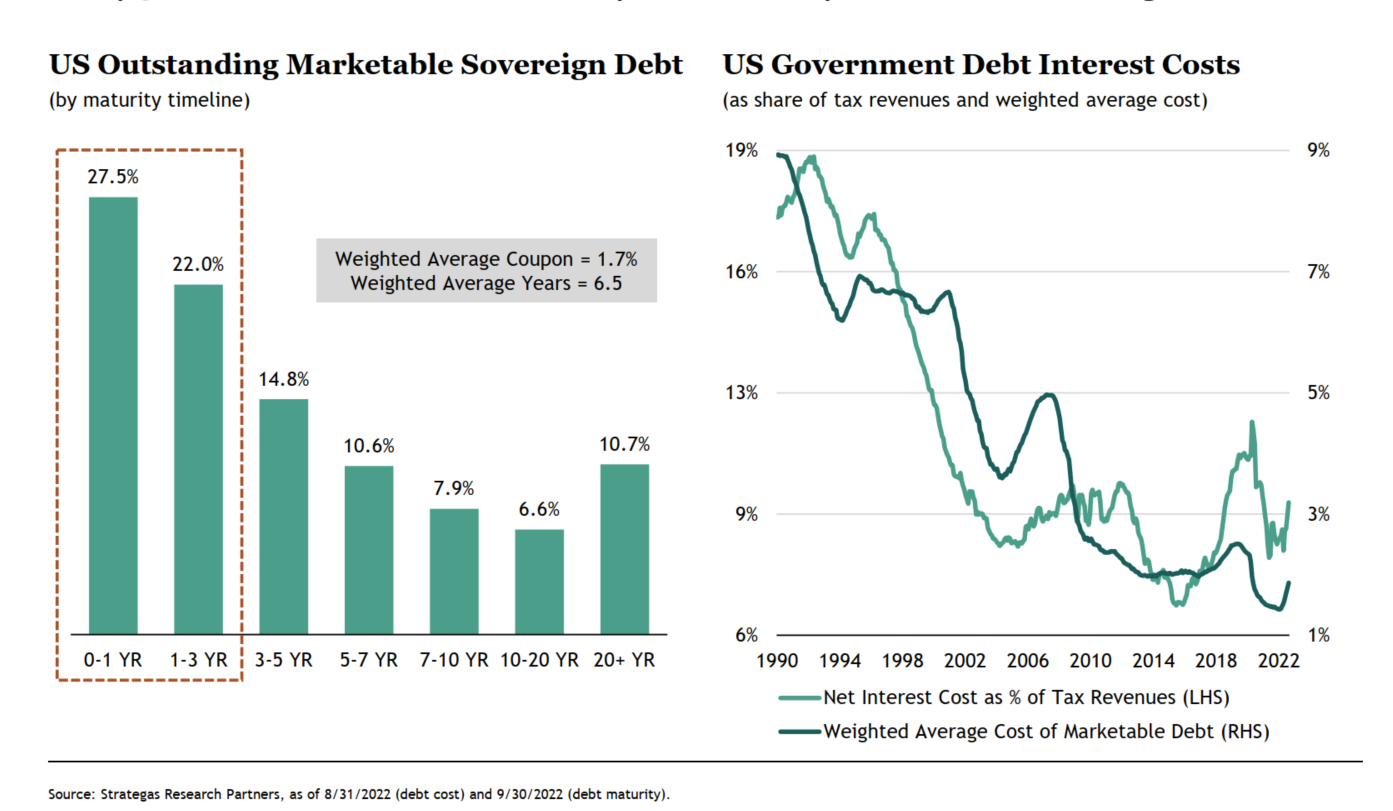
US Government Debt
- Federal government interest expense is going to rise rapidly.
- 50% of debt matures in the next three years.
- From excellent deck by Blackstone.
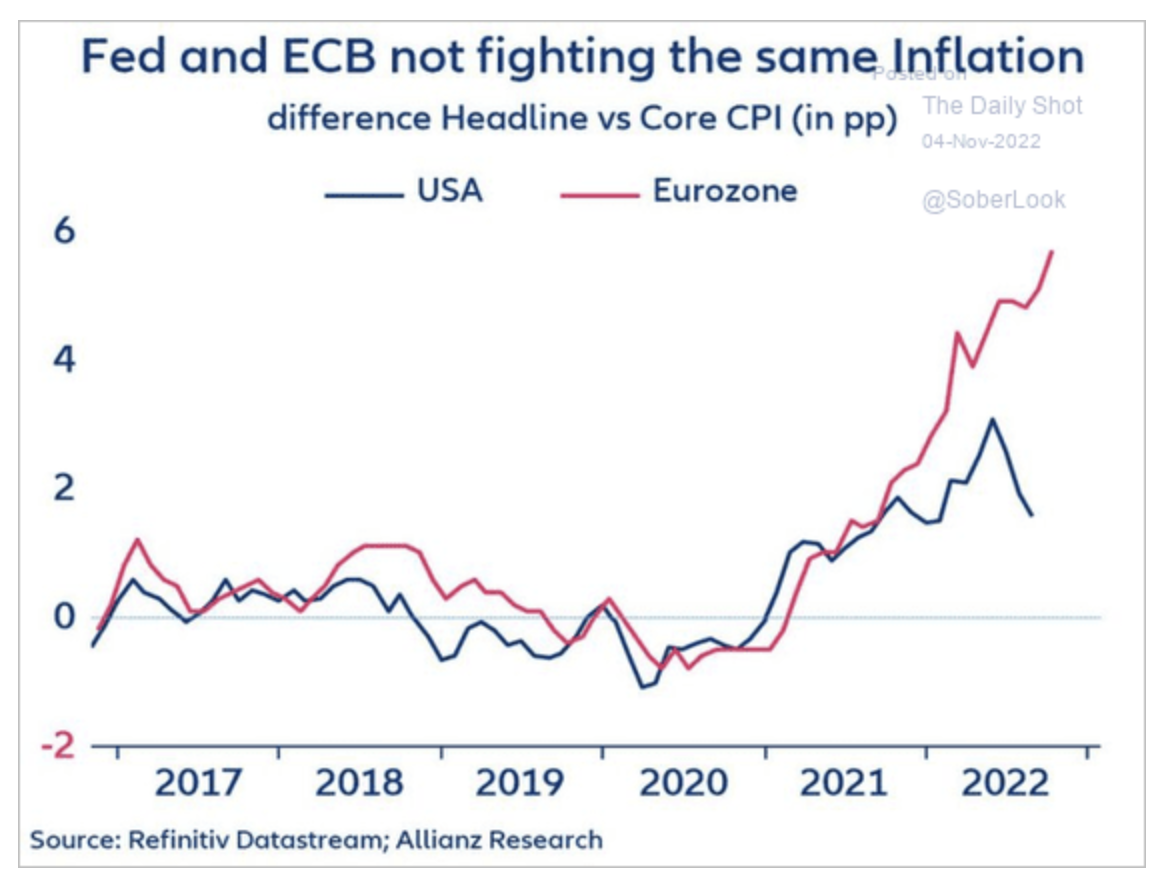
Price Level Shock vs. Inflation
- Europe and the US, though both clocking high inflation, are facing different challenges.
- This is best demonstrated by the evolution of the difference between headline and core inflation in each region.
- h/t Daily Shot.
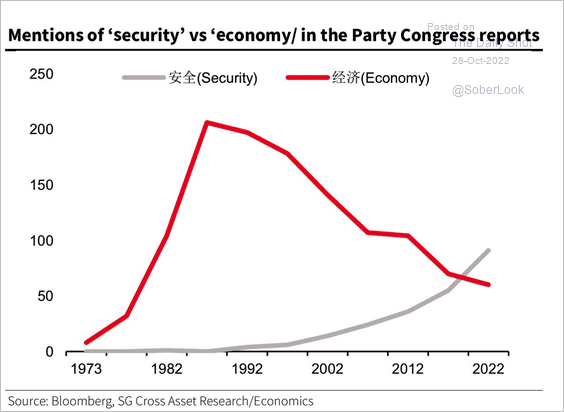
Party Congress Reports
- Worryingly, “security” has overtaken “economy” as the key concern at the Chinese Party Congress.
- h/t Daily Shot.
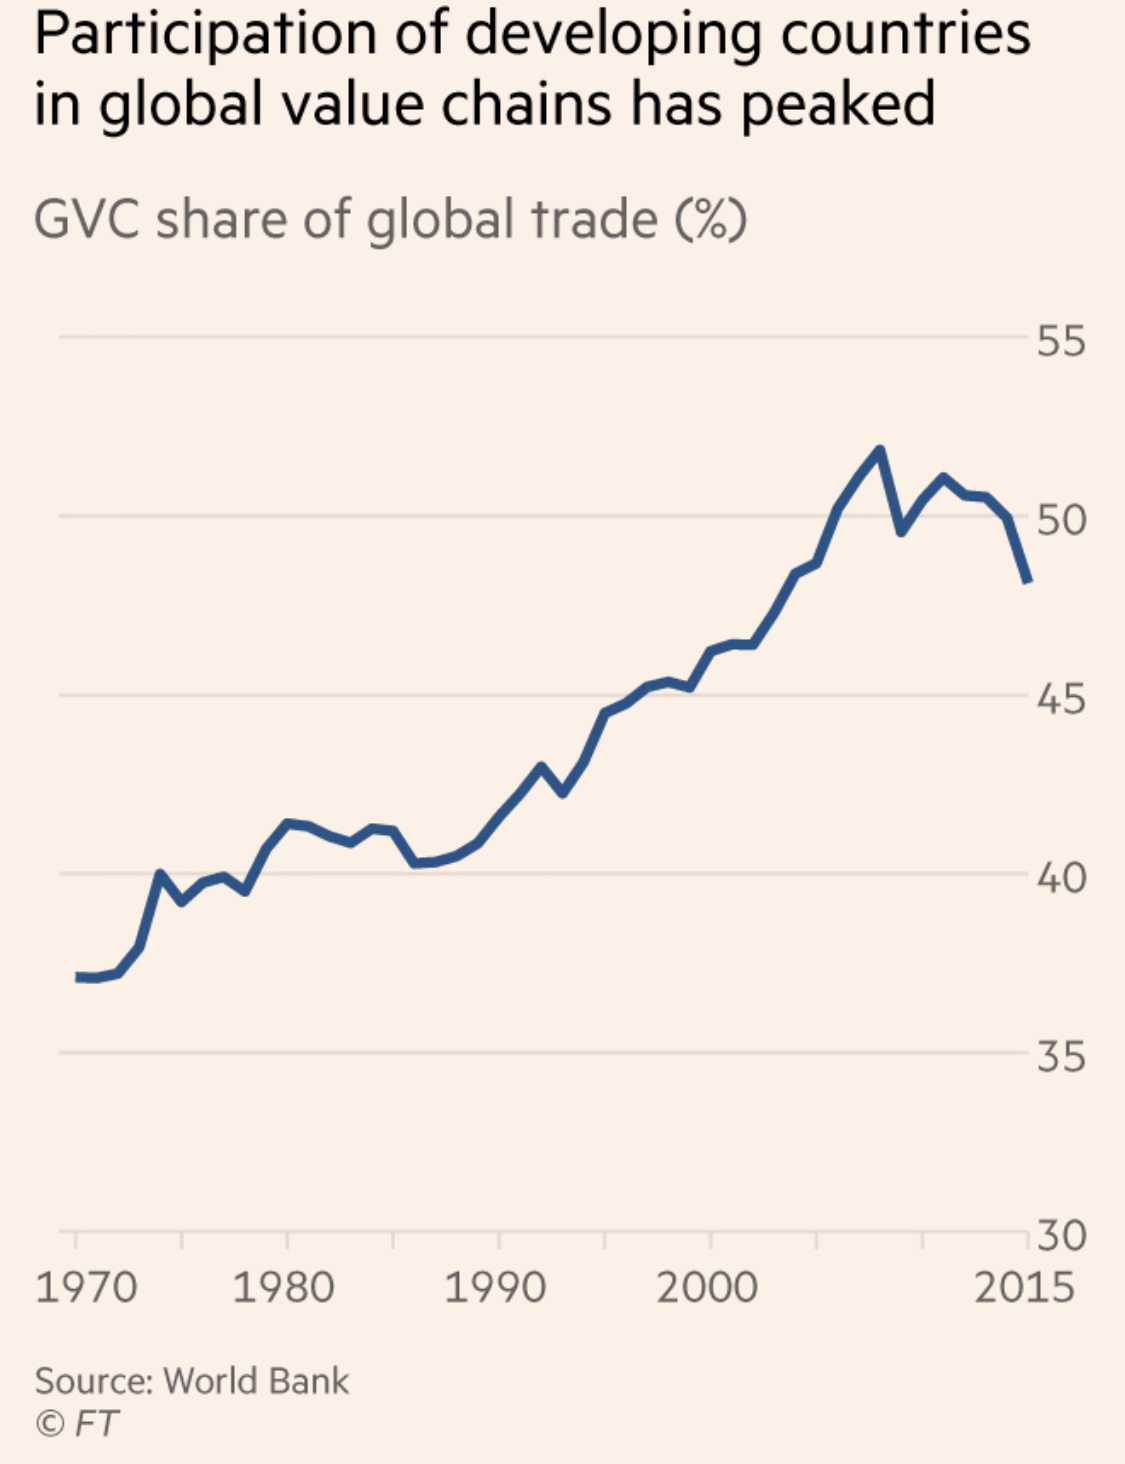
Developing Countries and Trade
- The participation of these countries in global value chains (GVC) has peaked.
- Nice read by Martin Wolf in FT.
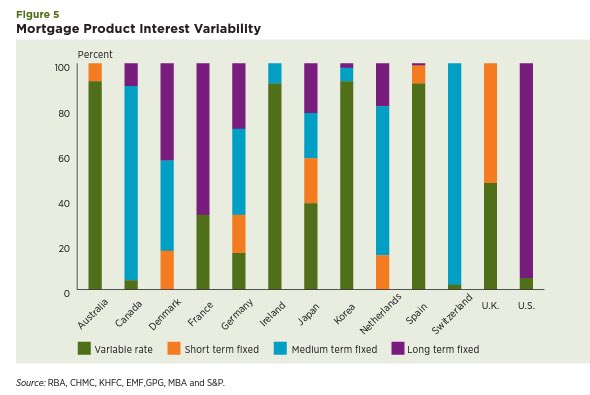
Mortgage Product by Interest Variability
- The world’s mortgage markets are very different.
- Data is from 2010 and is for flows not stock.
- Source.
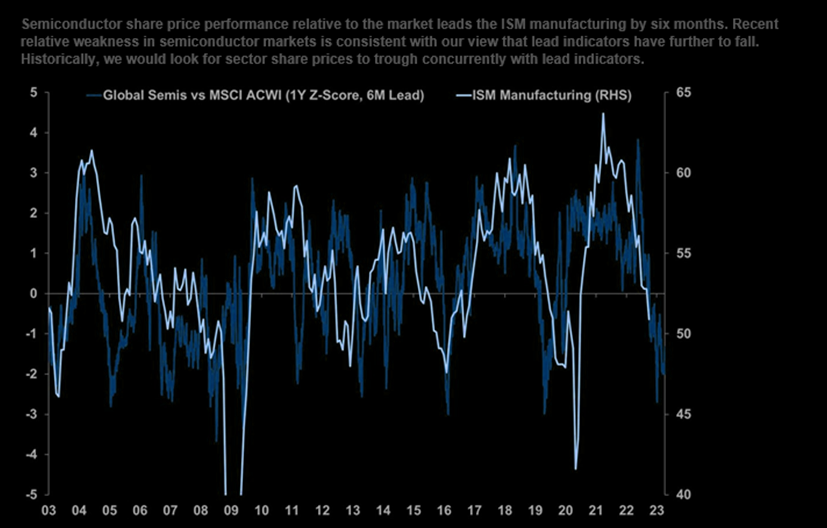
Semiconductor Cyclicality
- “Semiconductor share price performance relative to the market leads the ISM manufacturing by six months. Recent relative weakness in semiconductor markets is consistent with our view that lead indicators have further to fall. Historically, we would look for sector share prices to trough concurrently with lead indicators.“
Fed Crib Sheet
- As the US Economy slows and there are signs inflation might be rolling over, what the Fed will continue to do becomes very important for the rest of the cycle.
- This is a really useful crib sheet of what the various Fed speakers have been saying organised in an easy to use way.
- It is produced by fx:macro – a really comprehensive newsletter for those who want to get a good pulse on what central banks are up to.
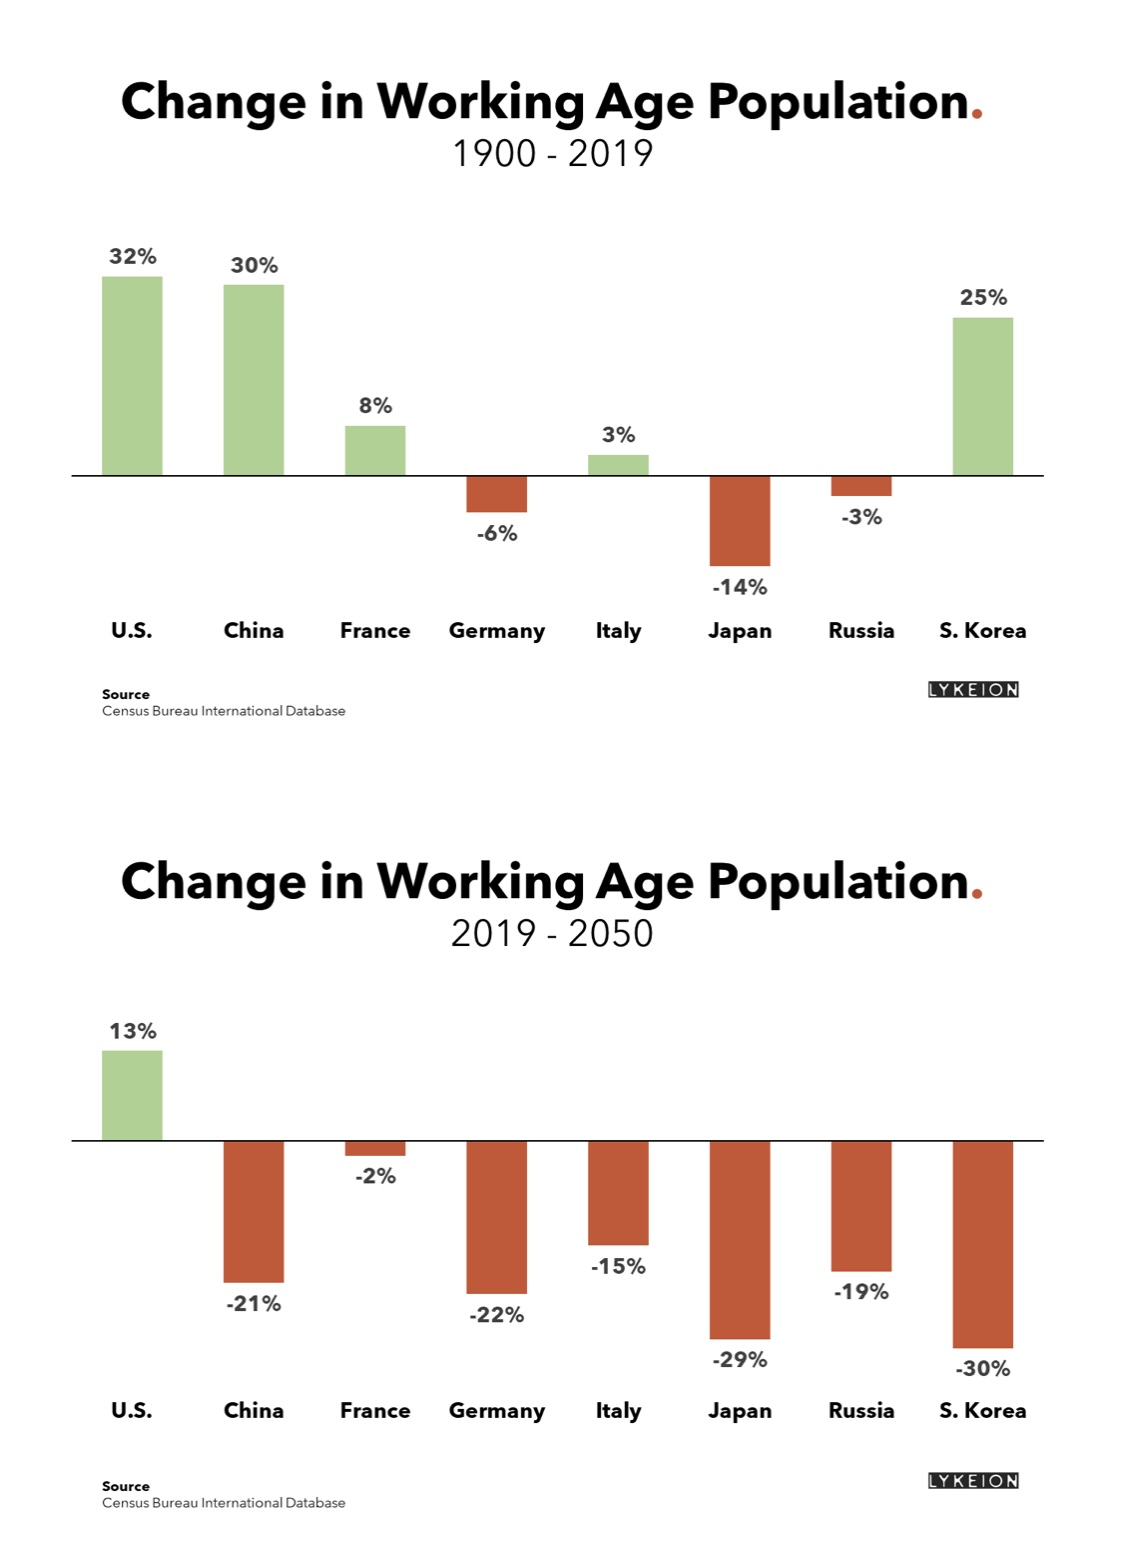
Demographics
- Most market analysis is focused on the cycle but it is always worth thinking about the demographic situation.
- h/t Lykeion.
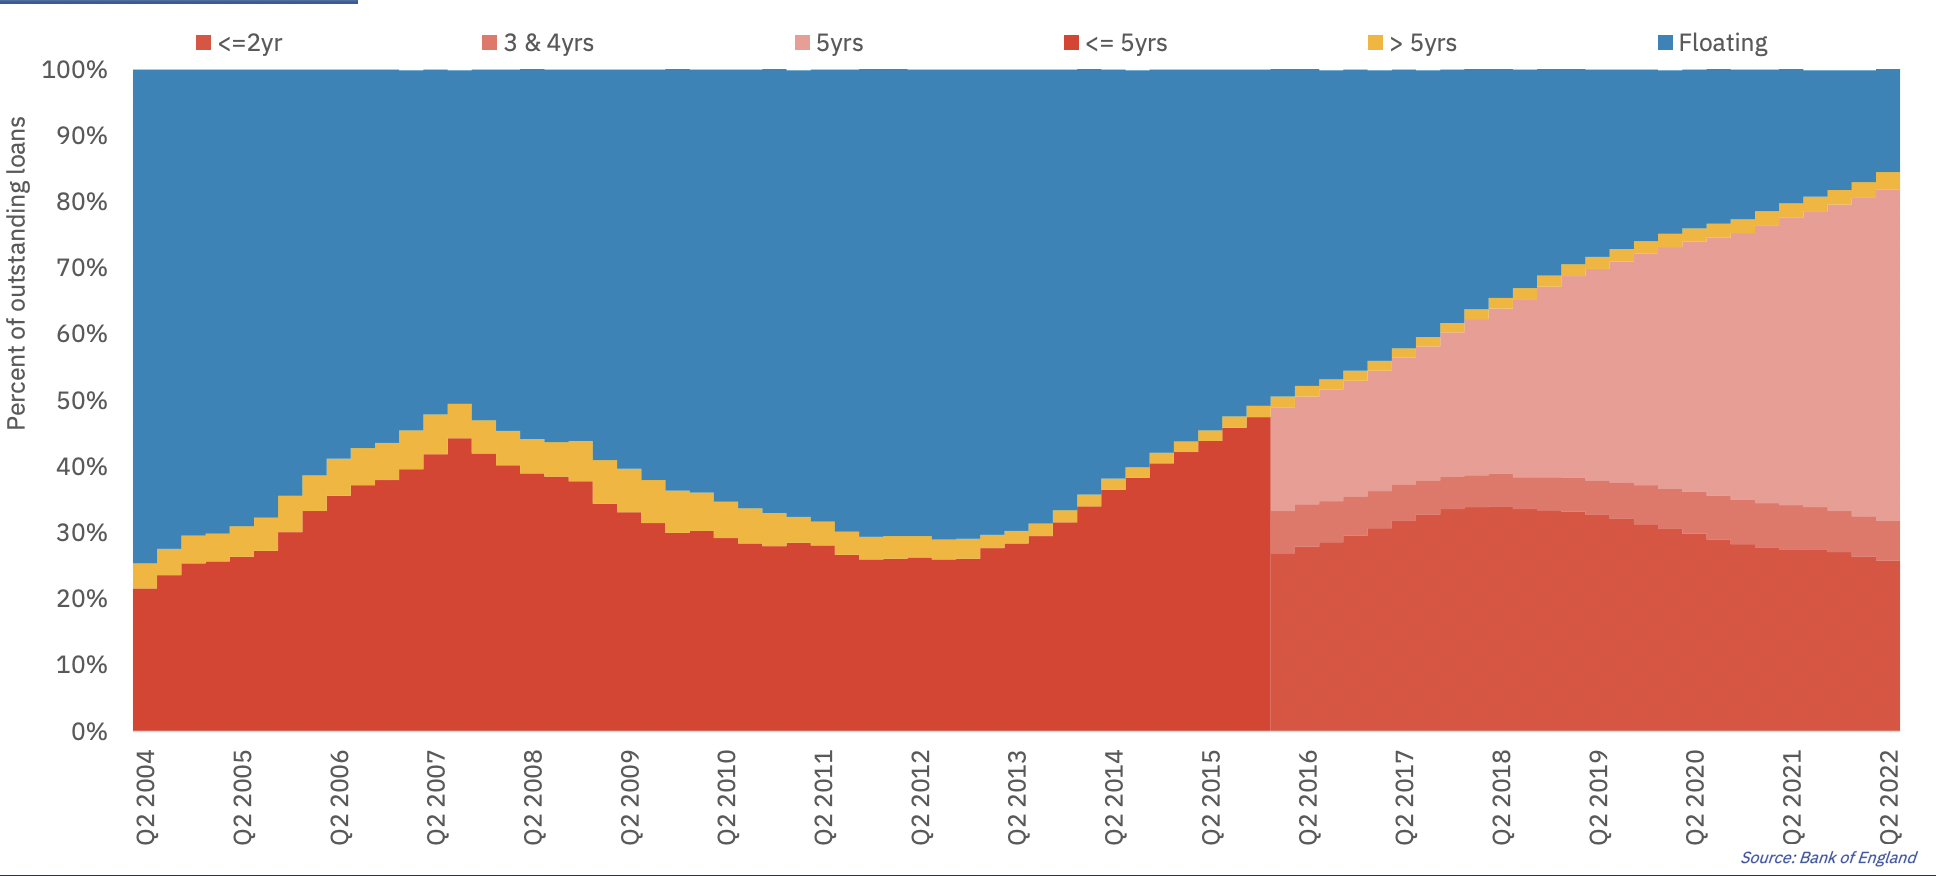
UK Mortgage Market
- UK residential mortgages have increasingly shifted to 5-year products.
- Despite this, over 1.2m products with fixed rates 2.5% and below are set to expire in the next 12 months.
- From a nice chart pack on the UK housing market by BuiltPlace.
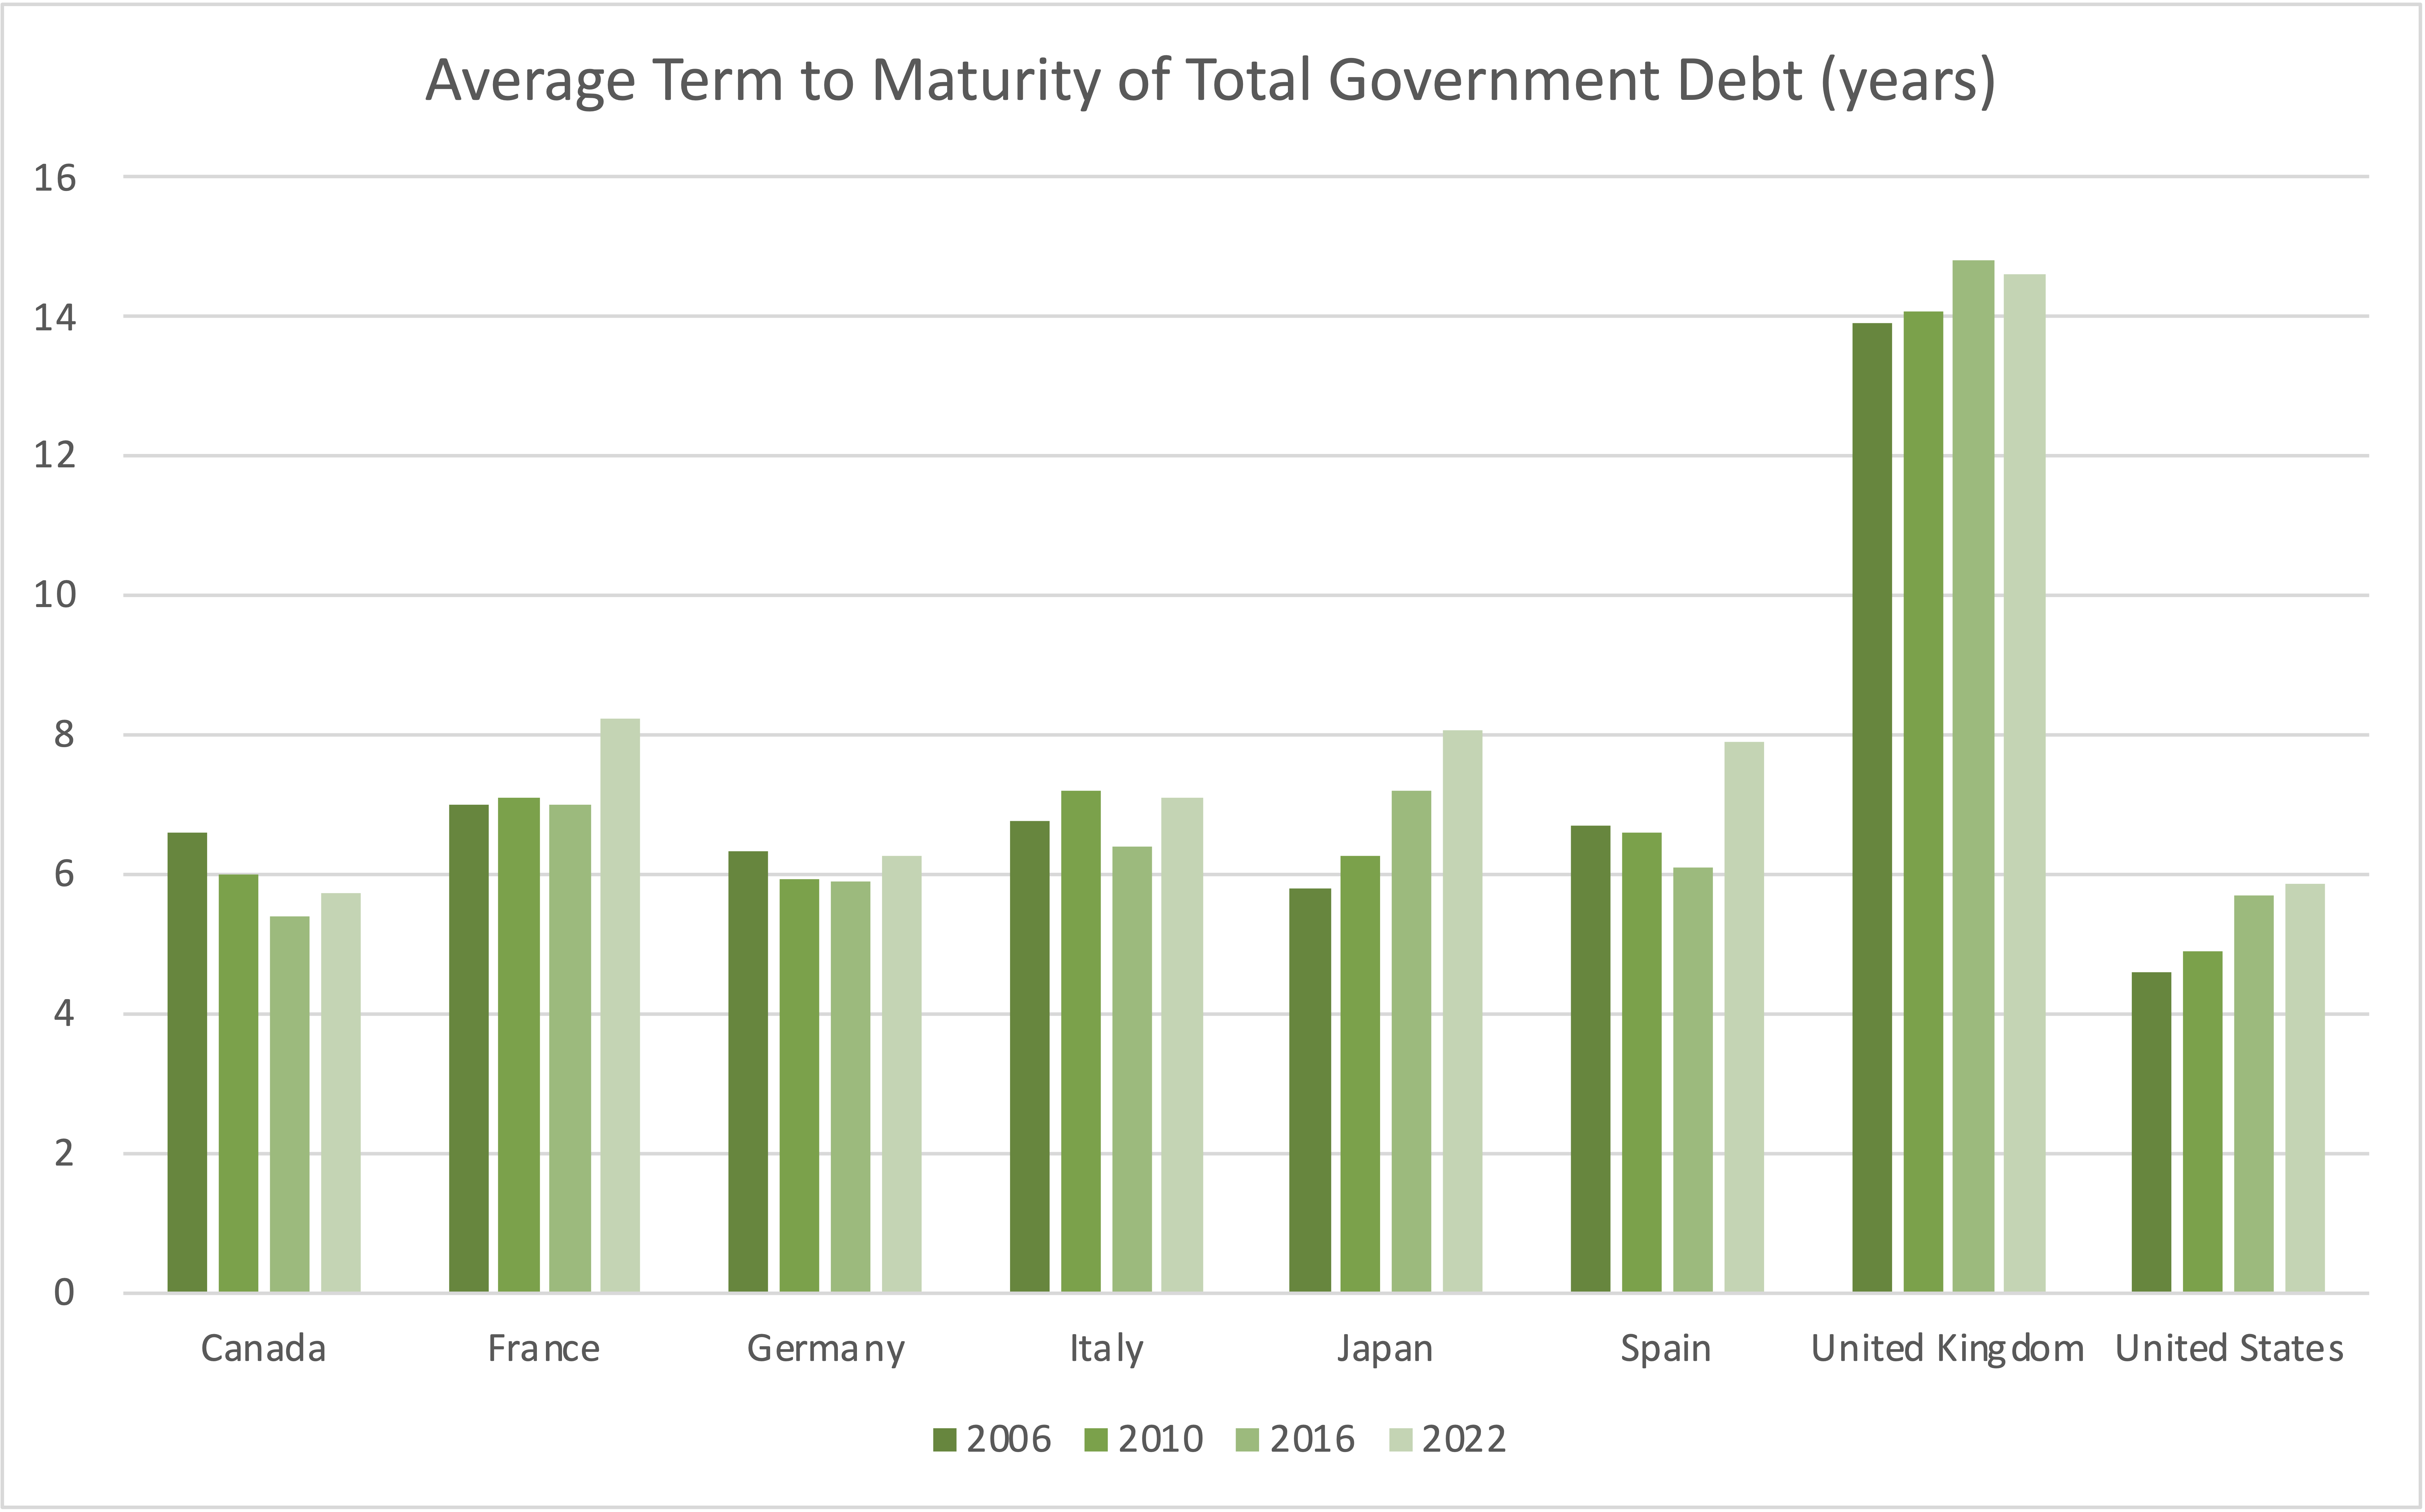
Government Debt Maturity
- Chart of average term to maturity of the outstanding stock of government debt.
- As interest rates rise around the world and fiscal tools are being used to cushion the energy shock, it is worth keeping these numbers in mind when assessing country risks.
- QE has actually distorted the usability of this metric as described so well in this OBR piece.
- NB Mix of OECD and IMF data.
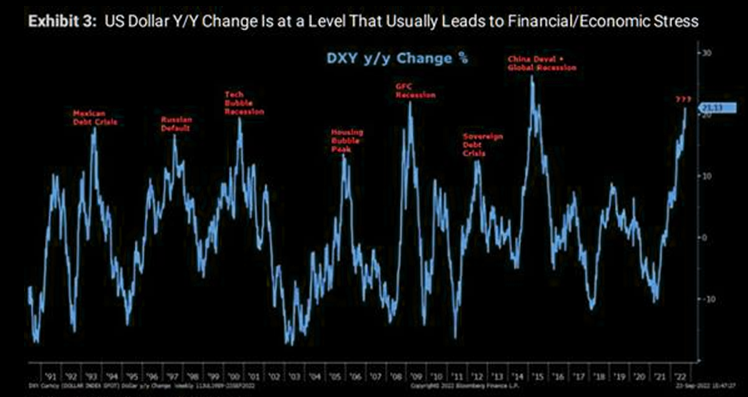
Dollar Stress
- These types of charts can be a good guide.
- Dollar spikes often lead to some form of crisis.
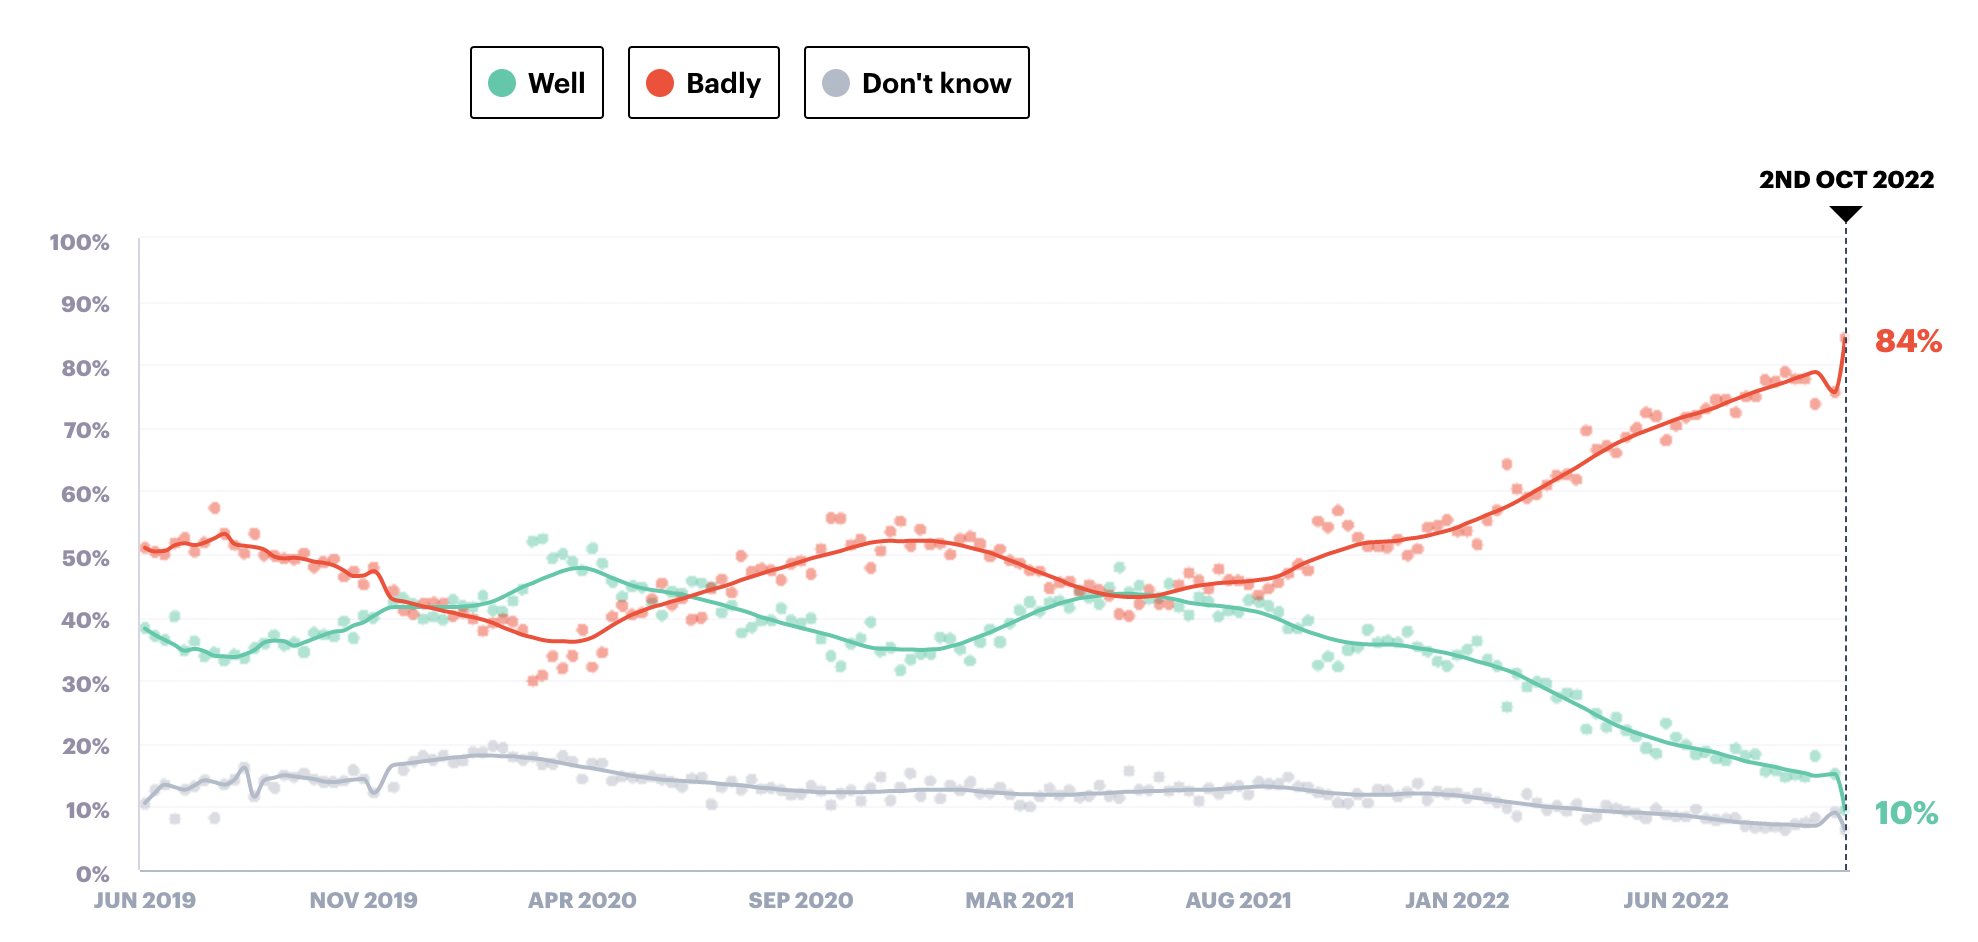
How is the UK government handling the economy?
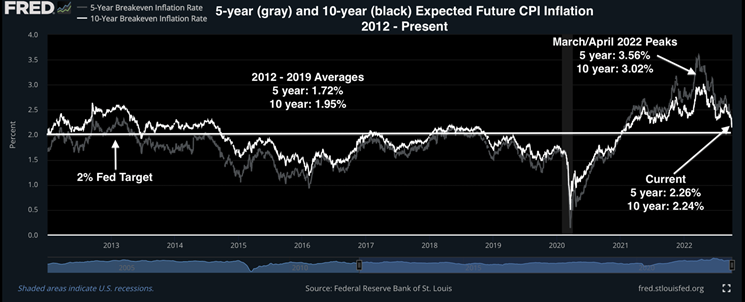
Inflation Expectations
- Are starting to come back in close to Fed target.
- Something to ponder.