Stocks
Interesting, and often contrarian, Snippets on individual companies and the stock market.
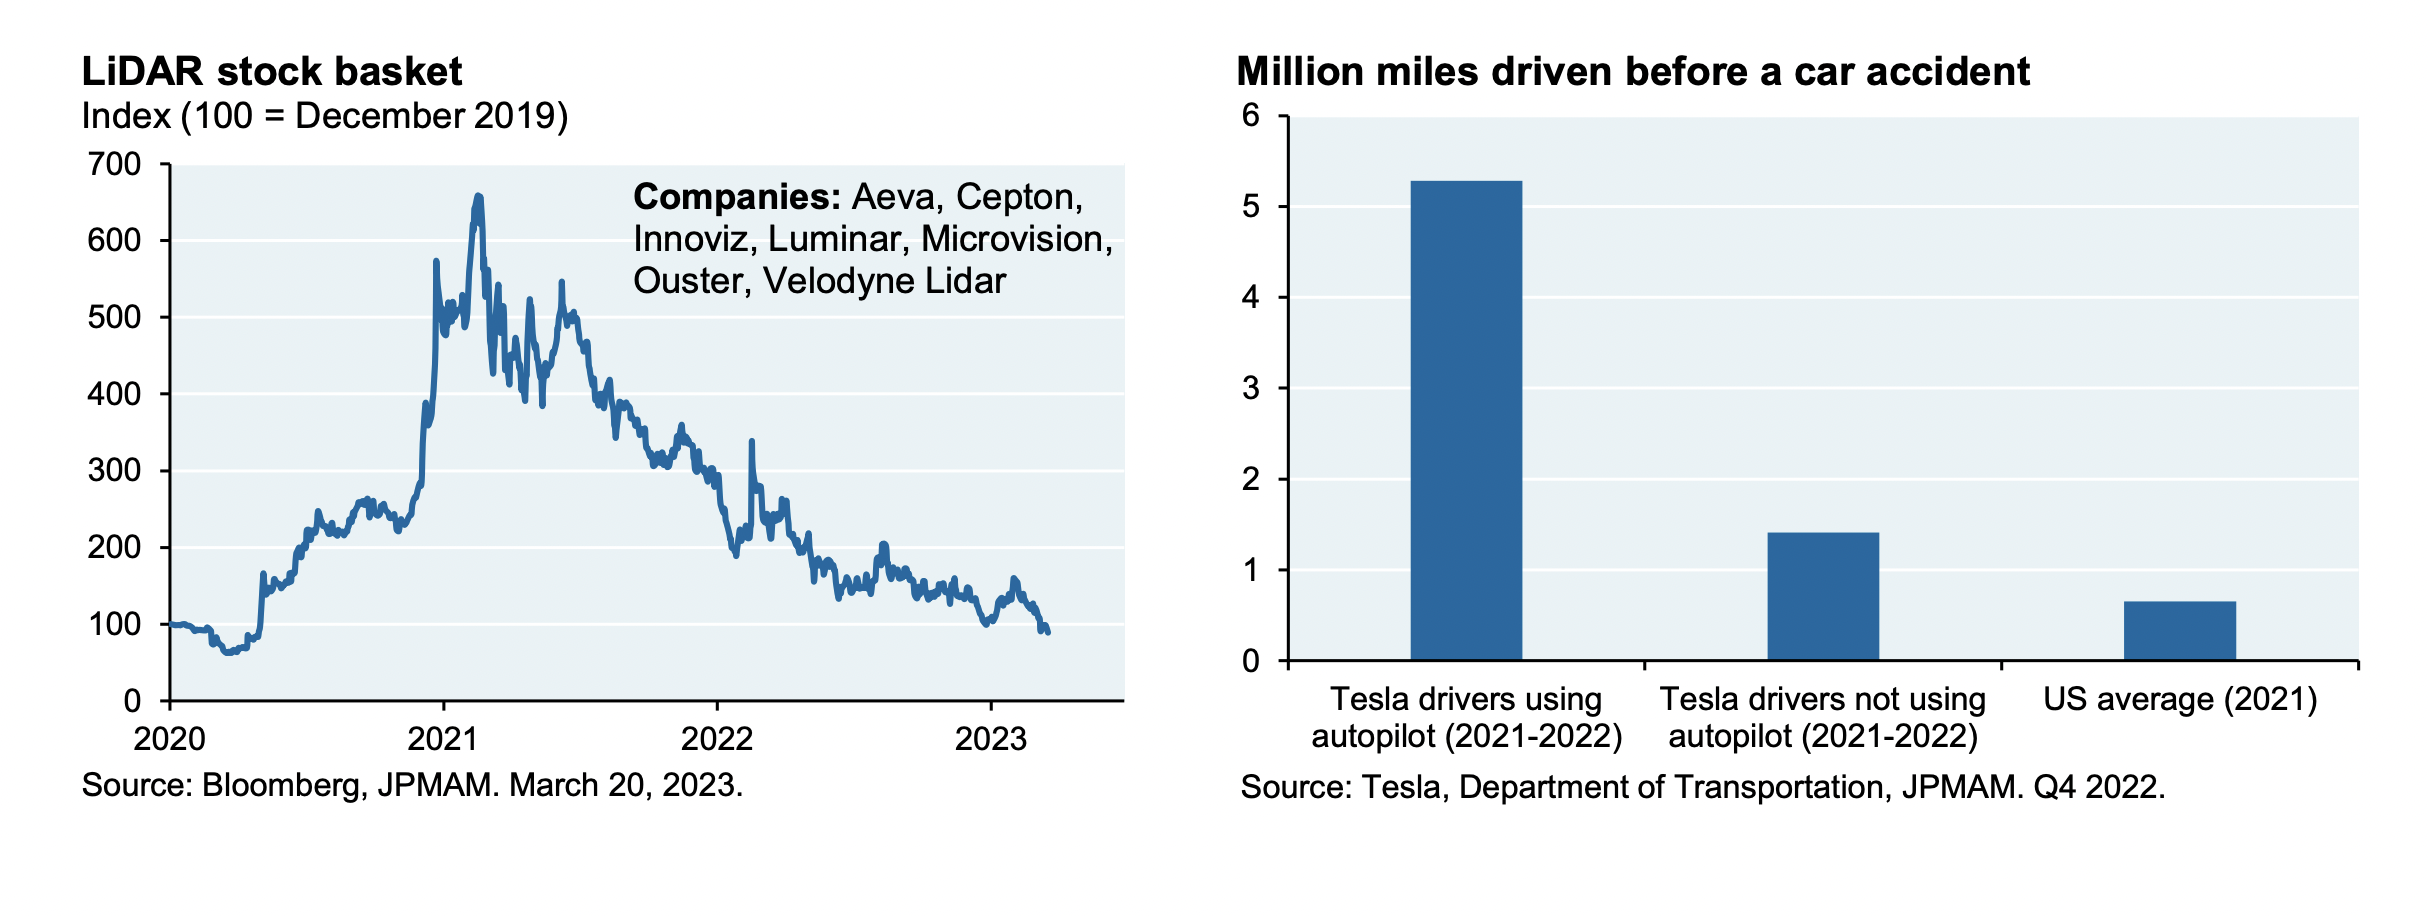
Lidar Hypecycle
- Classic hypercycle in lidar companies – share prices deflated just as the true benefits of the technology are starting to come through.
- Source: JPM.
Semiconductor Inventory Days
- A new trend?
- Source.
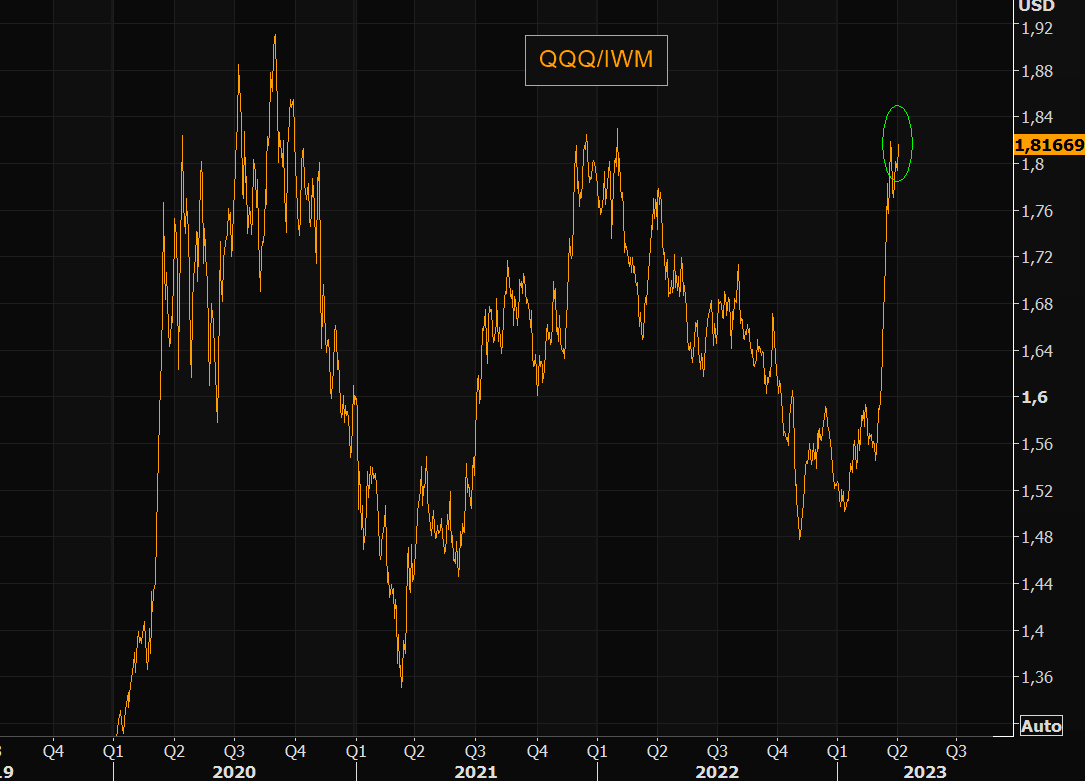
Nasdaq
- Really something that QQQ relative to Russel 2000 (IWM) is almost back to 2021 peak with record speed.
- Source: themarketear
Marketplace 100
- Doesn’t need much introduction but the latest analysis (based on credit card data) of marketplaces from a16z is out.
- The latest edition is much more interactive with some interesting conclusions (e.g. amazing how ticketing marketplaces keep launching).
Fintech Valuations
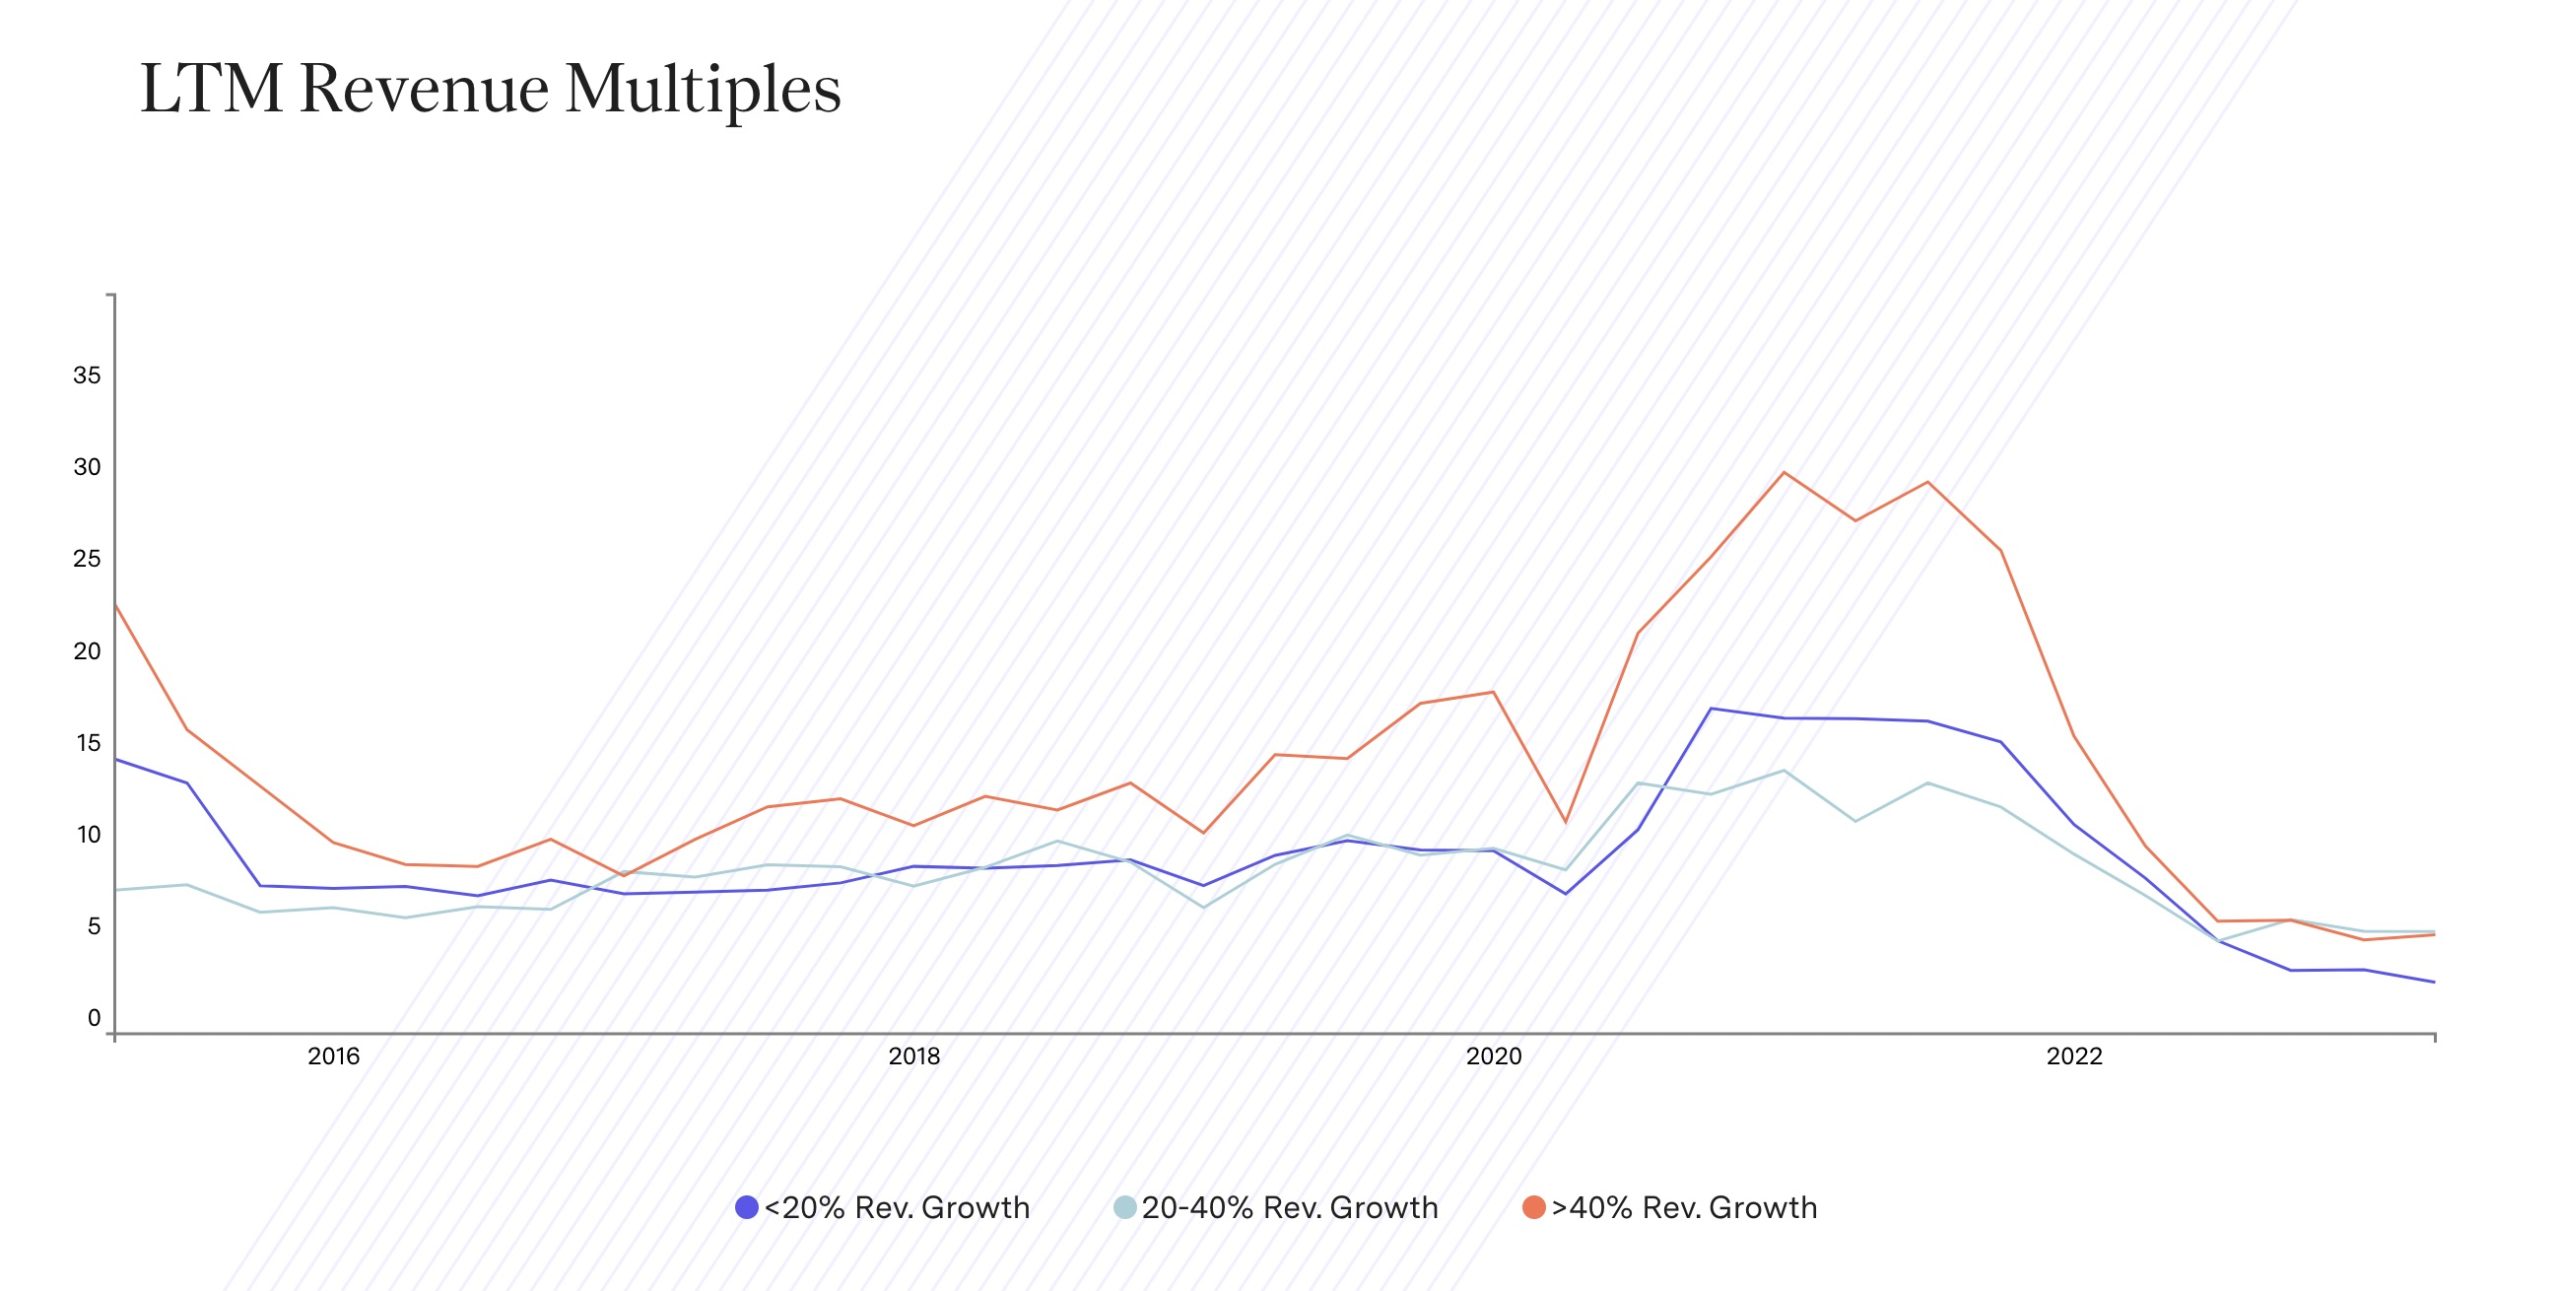
- F-prime produces some good analysis on the state of fintech.
- This chart shows that within the fintech space, the premium on high growth has almost totally disappeared since the 2021 boom.
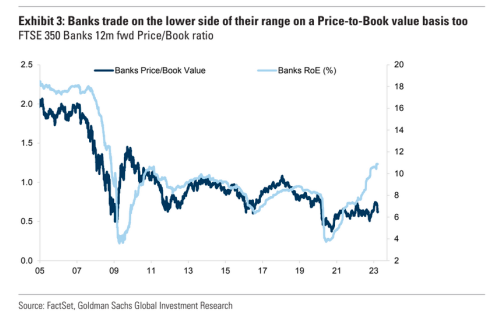
Something has to give – Banks
- This chart depicts UK banks (FTSE 350) but the picture is likely the same elsewhere.
- Either ROE will fall or P/B will rise.
- Source.
Arnault’s Hunt for Gucci in 1999
- Much has changed since then, but this behind-the-scenes Vanity Fair article shines a bright light on the corporate behemoth Arnault and his tactics, as he pursued Gucci in 1999.
Divine Semiconductors
- If you haven’t come across it already, read and marvel at this article by a Wired journalist who took a tour of a TSMC semiconductor fab.
- “Every six months, just one of TSMC’s 13 foundries—the redoubtable Fab 18 in Tainan—carves and etches a quintillion transistors for Apple. In the form of these miniature masterpieces, which sit atop microchips, the semiconductor industry churns out more objects in a year than have ever been produced in all the other factories in all the other industries in the history of the world.” (h/t The Diff)
Nelson Peltz – Not Just an Activist
- “If you look at Mr. Peltz’s track record, this guy used to drive trucks for his father’s food company. You might know that cold drink called Snapple. Nelson Peltz and his colleagues bought that brand after it had been run into the ground by Quaker Oats from $1 billion brand to 300 million brand. Mr. Peltz bought it around 98, 99. Within three years, they turned it around, made it a $1 billion brand again, and sold it off to Cadbury. These are folks who have real experience. They’re not just activist investors. They’ve done this. They have gotten their hands dirty.”
- From the Stream Insights blog
- If you want free access to their expert call transcripts for two weeks click here.
When it Stares You in the Eyes?
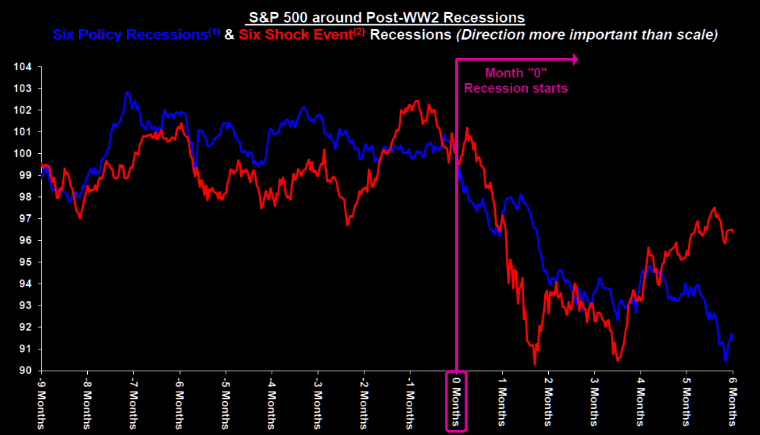
- According to Stifel (via themarketear) historically stocks trade in a range and only start to properly struggle when recession is clear.
Sector Weights
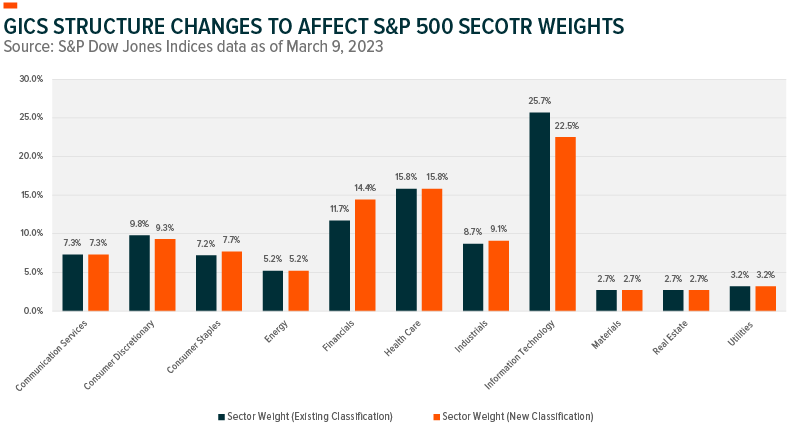
- Fintech is getting more recognition in the new GICS changes.
- As of March 17th, 11 S&P stocks will be reclassed out of IT and eight of them will land in Financials, into a new sub-industry focussed on payments.
- This will raise the Financials weight to 14% from 11% – though clearly reducing the weight of banks within that, at an interesting point in time.
- Source.
China Car Exports
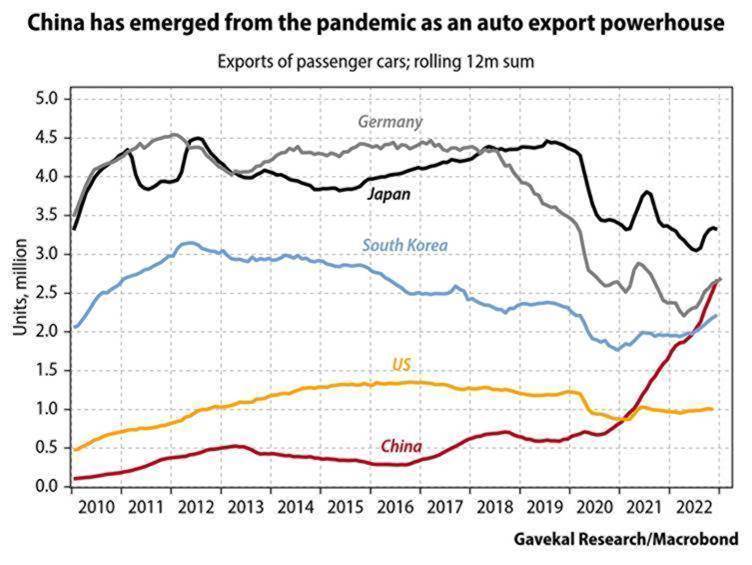
- Hockey stick move in Chinese car exports since the pandemic – quietly becoming an “auto export powerhouse”.
Rate Cuts and Bear Markets
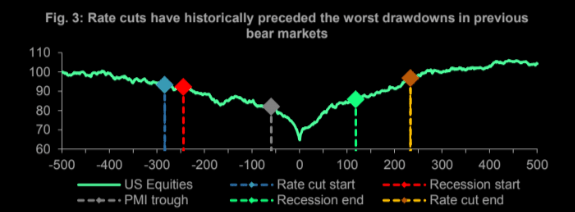
- Equities typically bottom some time after the first rate cut, based on historic bear markets since 1984.
- h/t themarketear.com
H2 Expectations
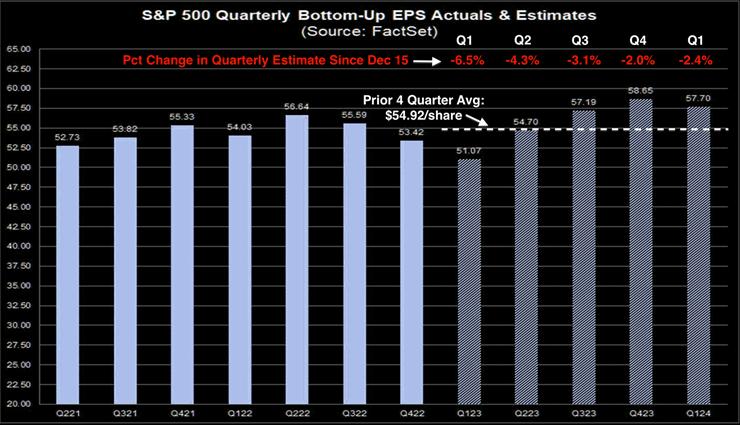
- Most of the earnings cuts have been to Q1/Q2 2023E.
- The typical pattern of an H2 recovery is still assumed.
- h/t themarketear.com
Semiconductors
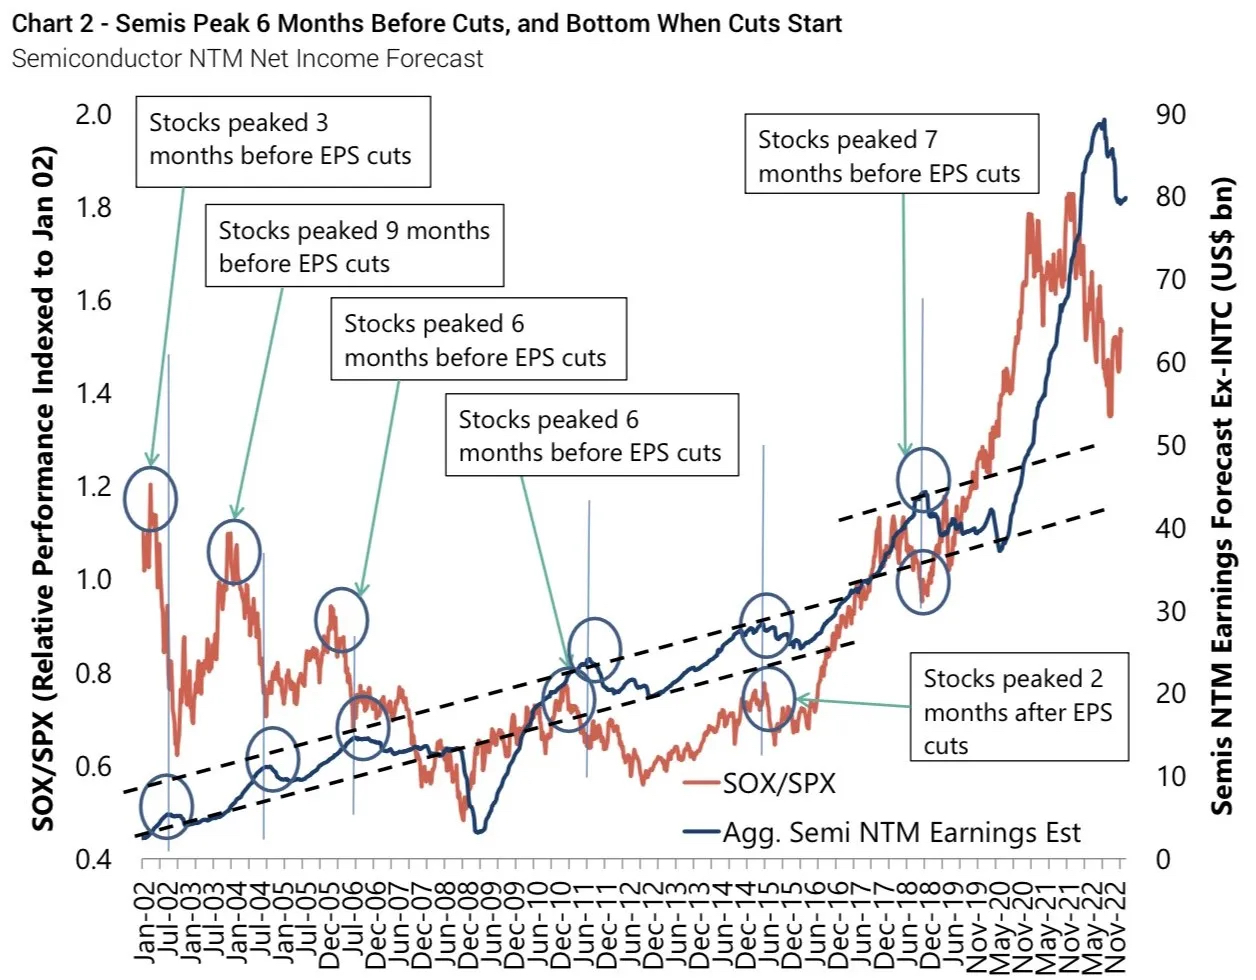
- “The most intriguing aspect of Wall Street’s behavior is that if we examine every period of industry decline over the past several decades, we see that stock prices reach their lowest point when the industry only starts to experience a fall in earnings, well before the trough of earnings. The stocks were already recovering and surging by the time layoffs and consolidation occurred.“
- Semiconductor index (SOX) is up strongly since October lows and earnings cuts have only just started i.e. a typical pattern with the expected bottom of the cycle is Q2 2023.
- Yet, as argued here, this cycle appears different – (1) days of inventory at record high which will take, despite a desire for supply chain resilience, more than two quarters to clear (2) there is an oversupply of certain process tech (3) channel stuffing has been a big feature.
Intel
- A harsh, almost damning, write-up of Intel, pre-dating the dividend cut.
- “In reality, Intel is not the giant of the industry. Intel’s total share of industry capacity is around 10%, they are not a giant who has stumbled, they are a niche player and have been for years.“
- Worth a read.
Car Paint
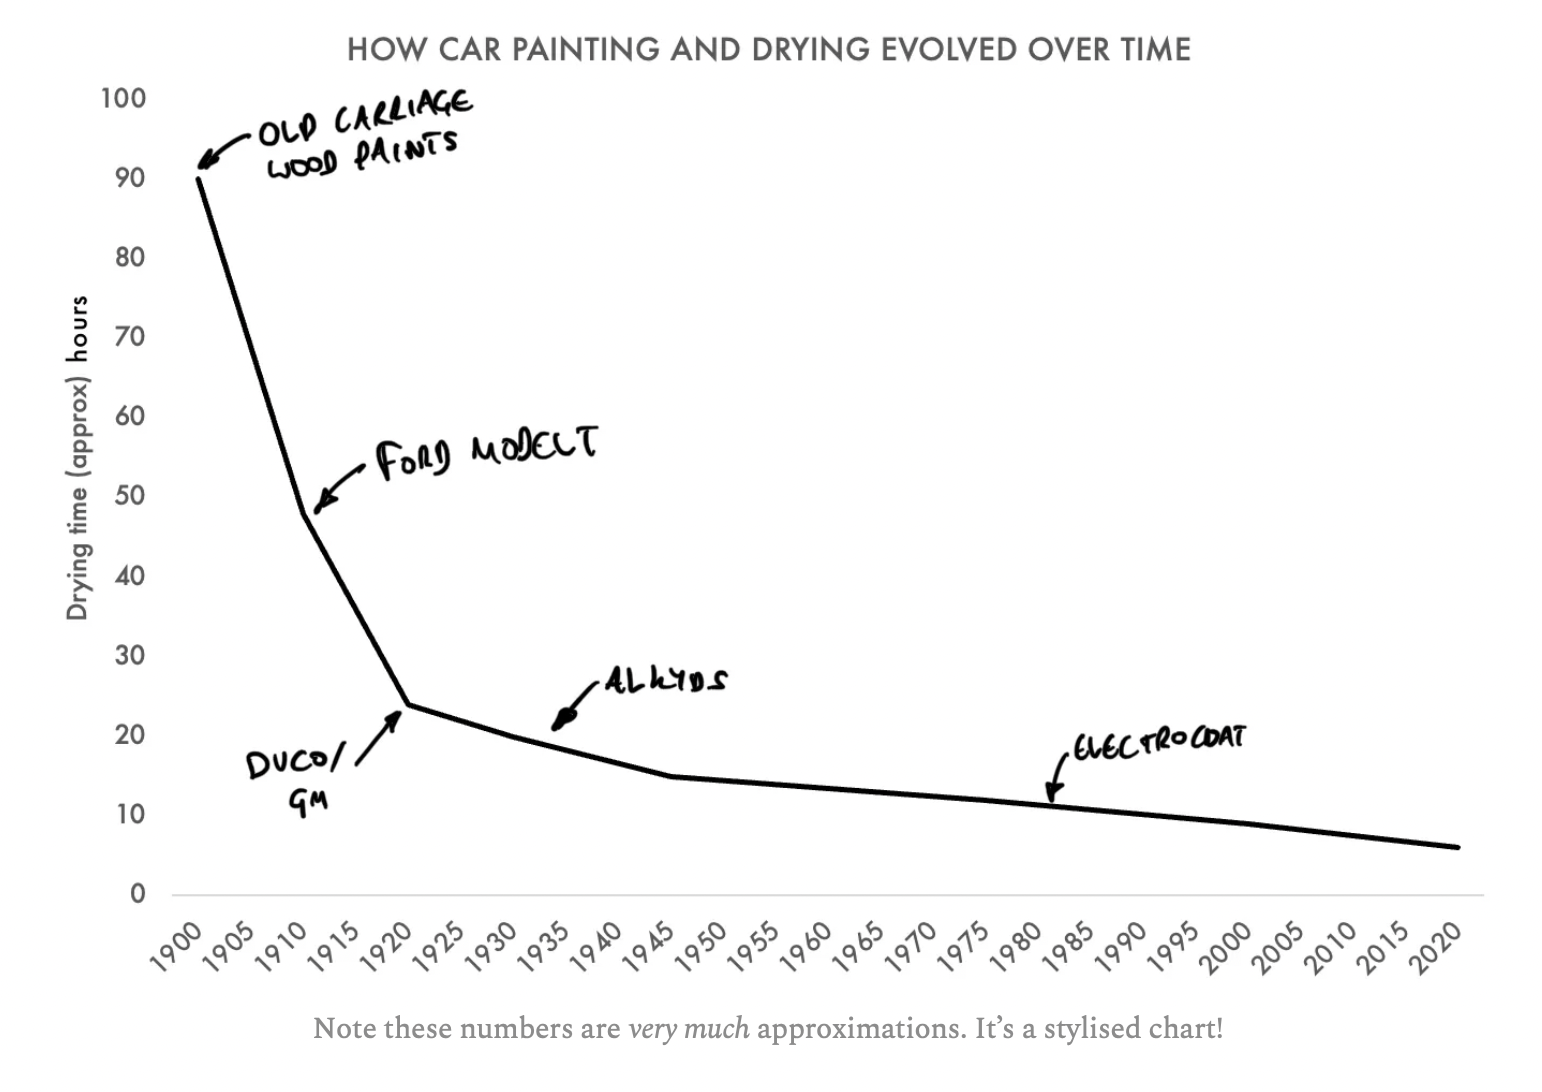
- “Each coat of paint on the Model Ts had to be brushed or dipped on and allowed to dry before the next layer went on. While the duration of assembly was initially measured in hours, the duration of painting was measured in days or even weeks.“
- So starts this sojourn into the world of car paint and how the “single biggest hindrance to mass production” for Ford was solved.
- Spoiler chart, but there is so much more.
Supermarket SKUs
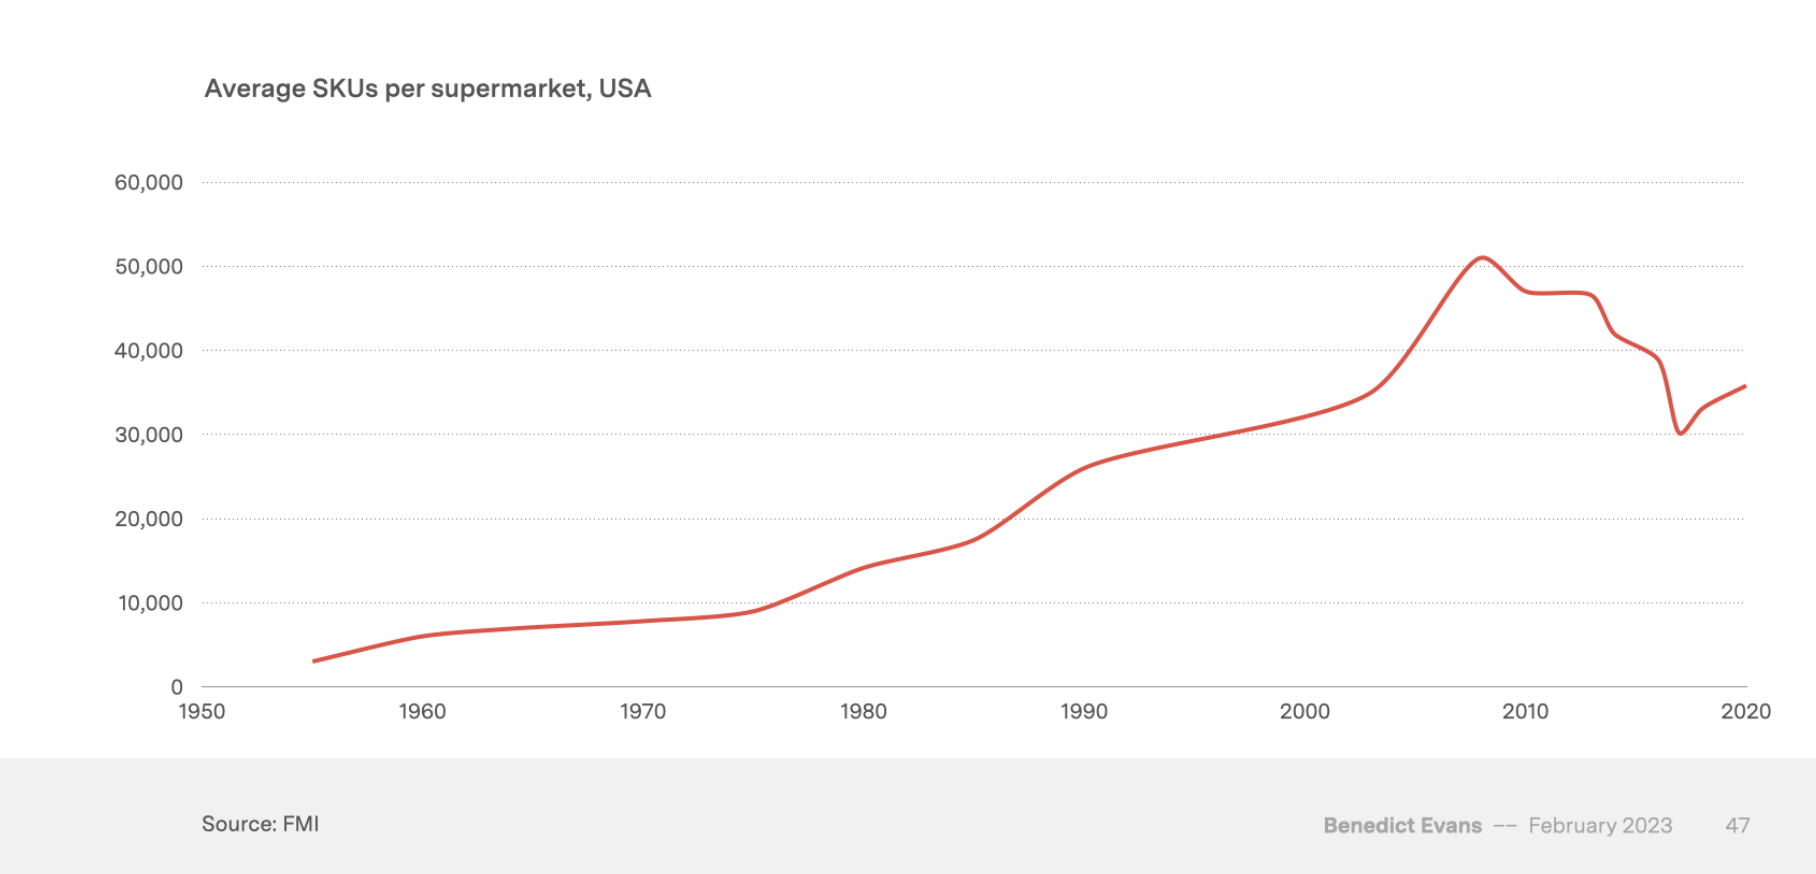
- The number of products on supermarket shelves looks to be breaking a decade-long downtrend.
- Source.
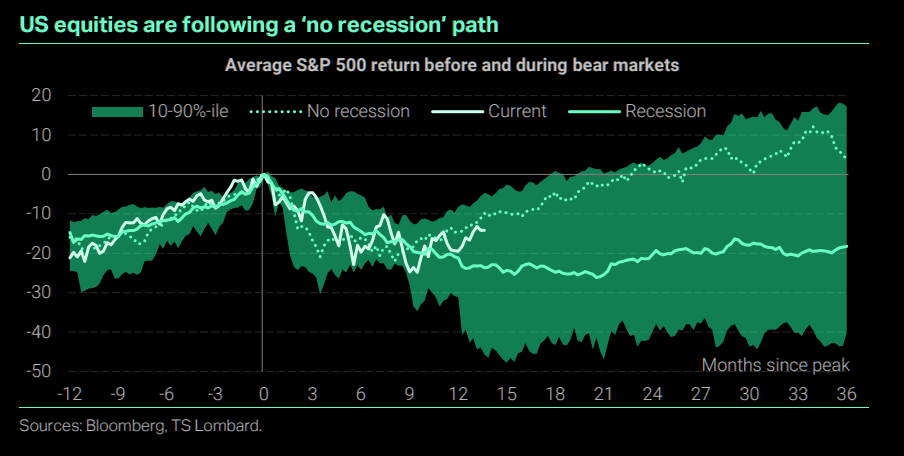
No Recession Path
- Equities are following a no-recession path currently.
- If one does happen, things could look very different.
- Source: TS Lombard via themarketear.


