- The quality of reported earnings in the US has been deteriorating.
- Source: Bernstein.
Stocks
Interesting, and often contrarian, Snippets on individual companies and the stock market.

Ben Evans 2023 Deck
- The annual deck from Benedict Evans is out, teeming with thought-provoking charts.
- Here, for example, is the share of retail spending going to department stores.
- This decline of traditional retail is supported by chart 31 – showing capital spending on warehouses overtaking sums spent on retail space.

Glide Approach
- More and more airports in the US are adopting a “glide” landing.
- “Everybody’s at idle for the entire descent, burning the minimum fuel, making the minimum noise and creating the minimum emission”
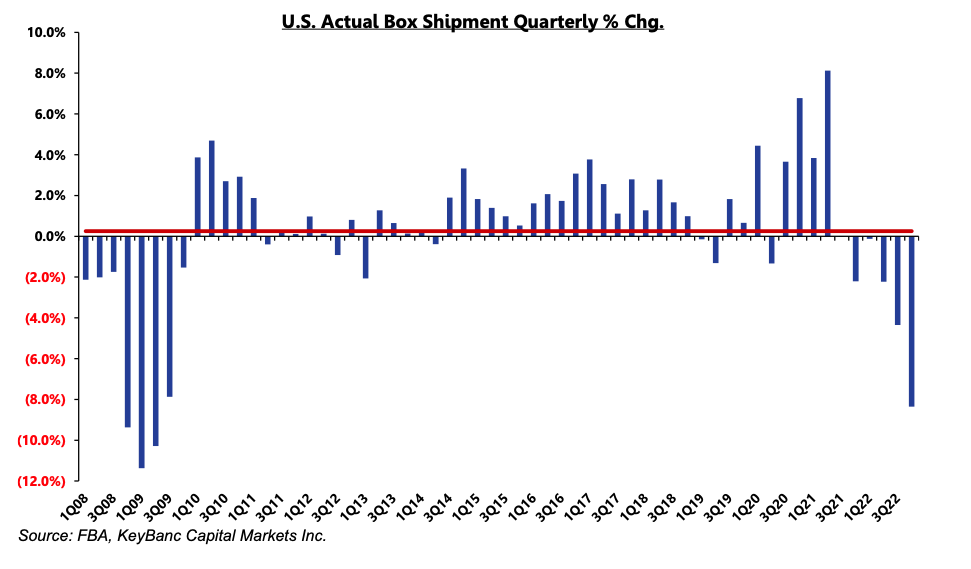
Cardboard Demand Plummets
- “Demand and output for cardboard boxes and other packaging material fell sharply in the fourth quarter of 2022“.
- “the most severe quarterly decline since the Great Financial Crisis (2Q09).”
- Operating rates have fallen as a result leaving 20% of capacity idle. Excess inventory (which has fallen) remains high.
- “To Josephson, the end of 2022 in the packaging world had “echoes of the Great Financial Crisis everywhere one looks,” he wrote in the Sunday note“.
- Source (h/t).
RISC-V
- RISC-V, the royalty-free open-source instruction set architecture, is worth keeping an eye on especially as Arm convulses its way back to the stock market.
- The December 2022 summit (and this great write-up) offered a deep feel of the status of RISC-V.
- Bold statements abounded – “It’s really important that you get this. RISC-V is inevitable. RISC-V is going to have the best processors. And RISC-V is going to have the best ecosystem.”
Valuing Stressed Equity
- How should one think about the value of equity in a distressed company?
- The obvious answer is – “option value” – but what does that actually mean.
- This post makes a useful attempt and a good tool to keep in your arsenal.
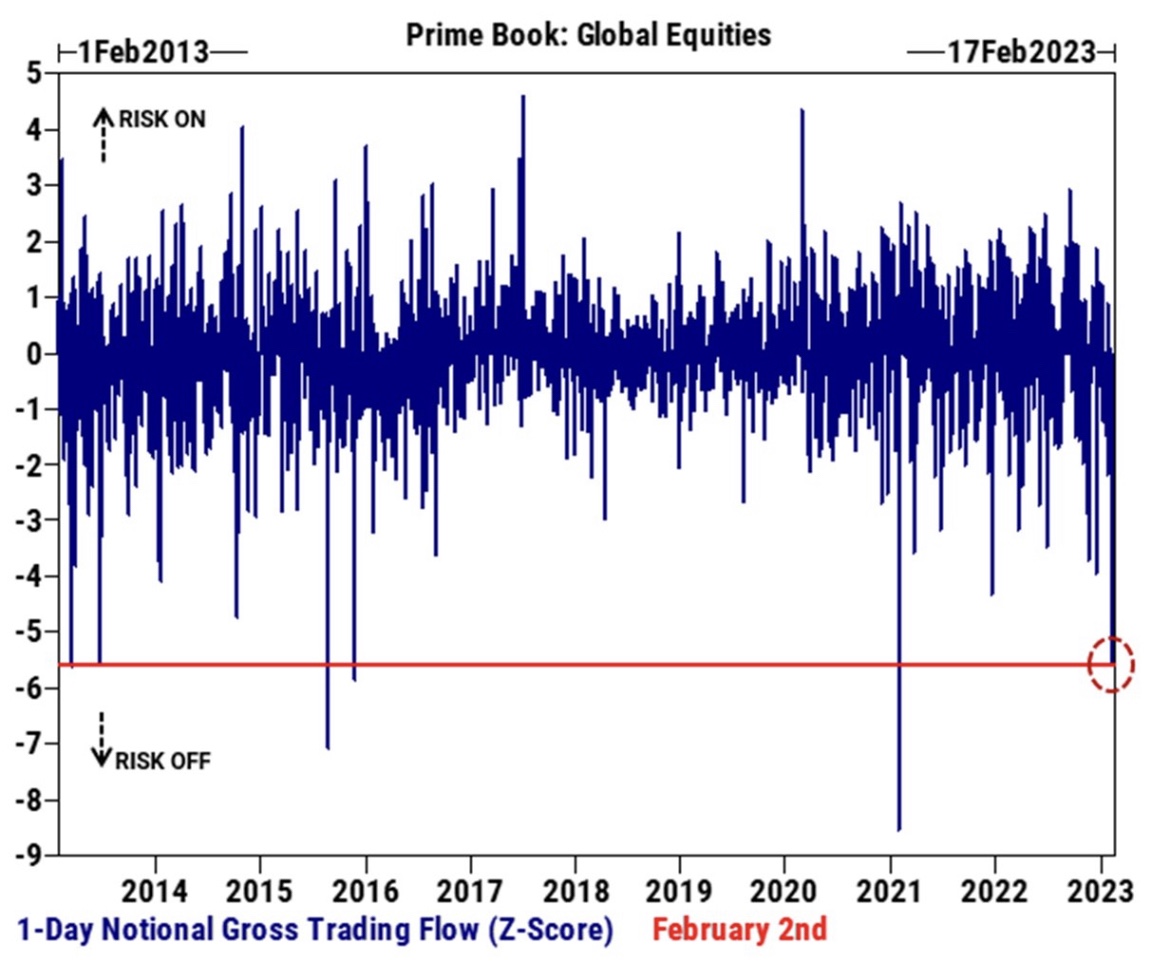
Short Covering
- According to GS PB team – last week saw the highest HF short covering since January 2021.
- This ranks in the 99.9th percentile since 2012.
- Source.
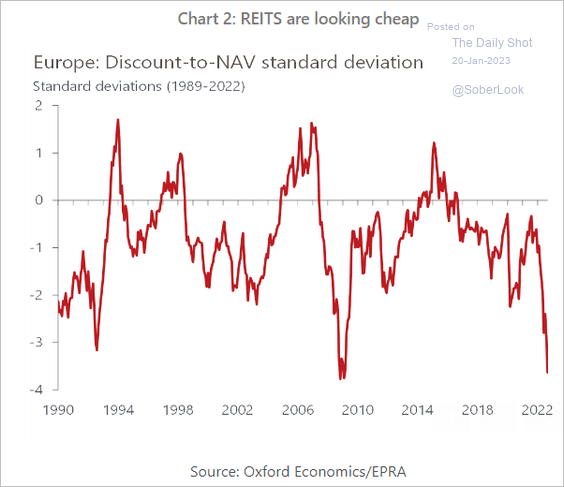
REITs
- In Europe look very cheap.
- h/t: Daily Shot.
Did California make a good BREIT investment?
- Analysis on why, despite looking good on paper, California, might have made a poor investment in BREIT.
- The one-line summary is = valuation marks.
- Especially relative to other investment opportunities available, namely public listed REITs.
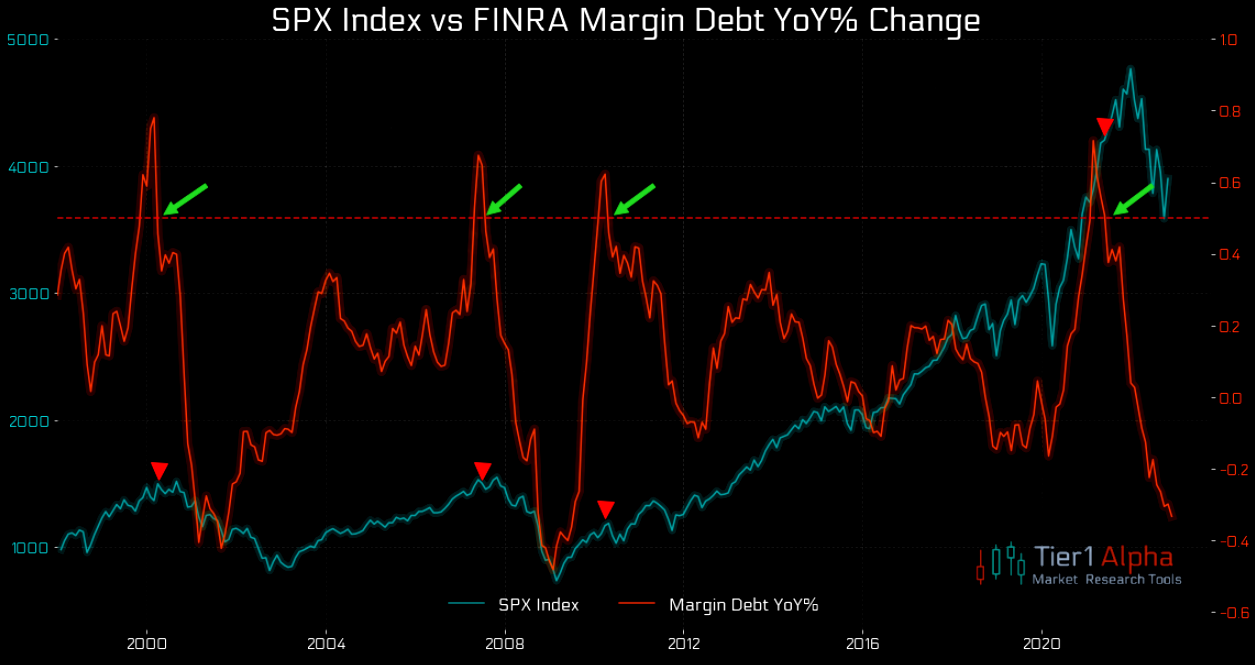
Margin Debt
- The recent rally in equities has taken place despite margin debt falling.
- Source: The Market Ear.
Bottom Fishing
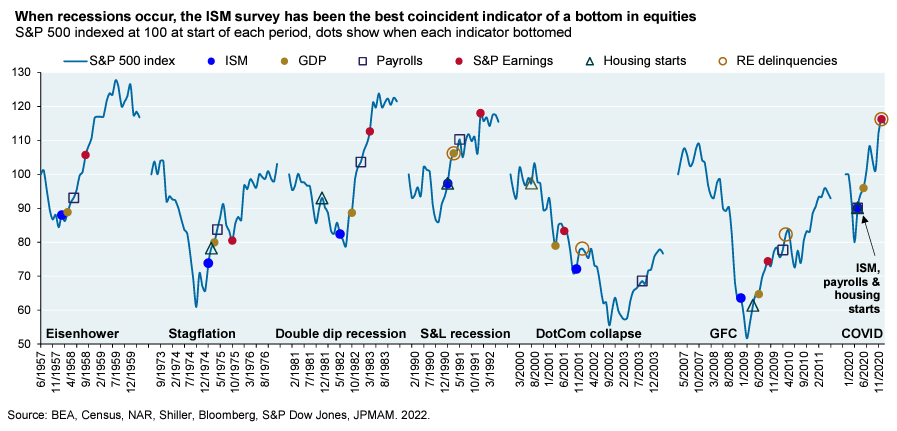
- Nice chart from JPM
- “As shown below, in the history of US recessions (with the exception of the dot-com collapse of 2001), equity markets bottomed well before the bottom in GDP, payrolls, S&P 500 earnings and housing starts and the peak in household/corporate delinquencies. The ISM survey has been the most reliable coincident indicator of a bottom in equities“.
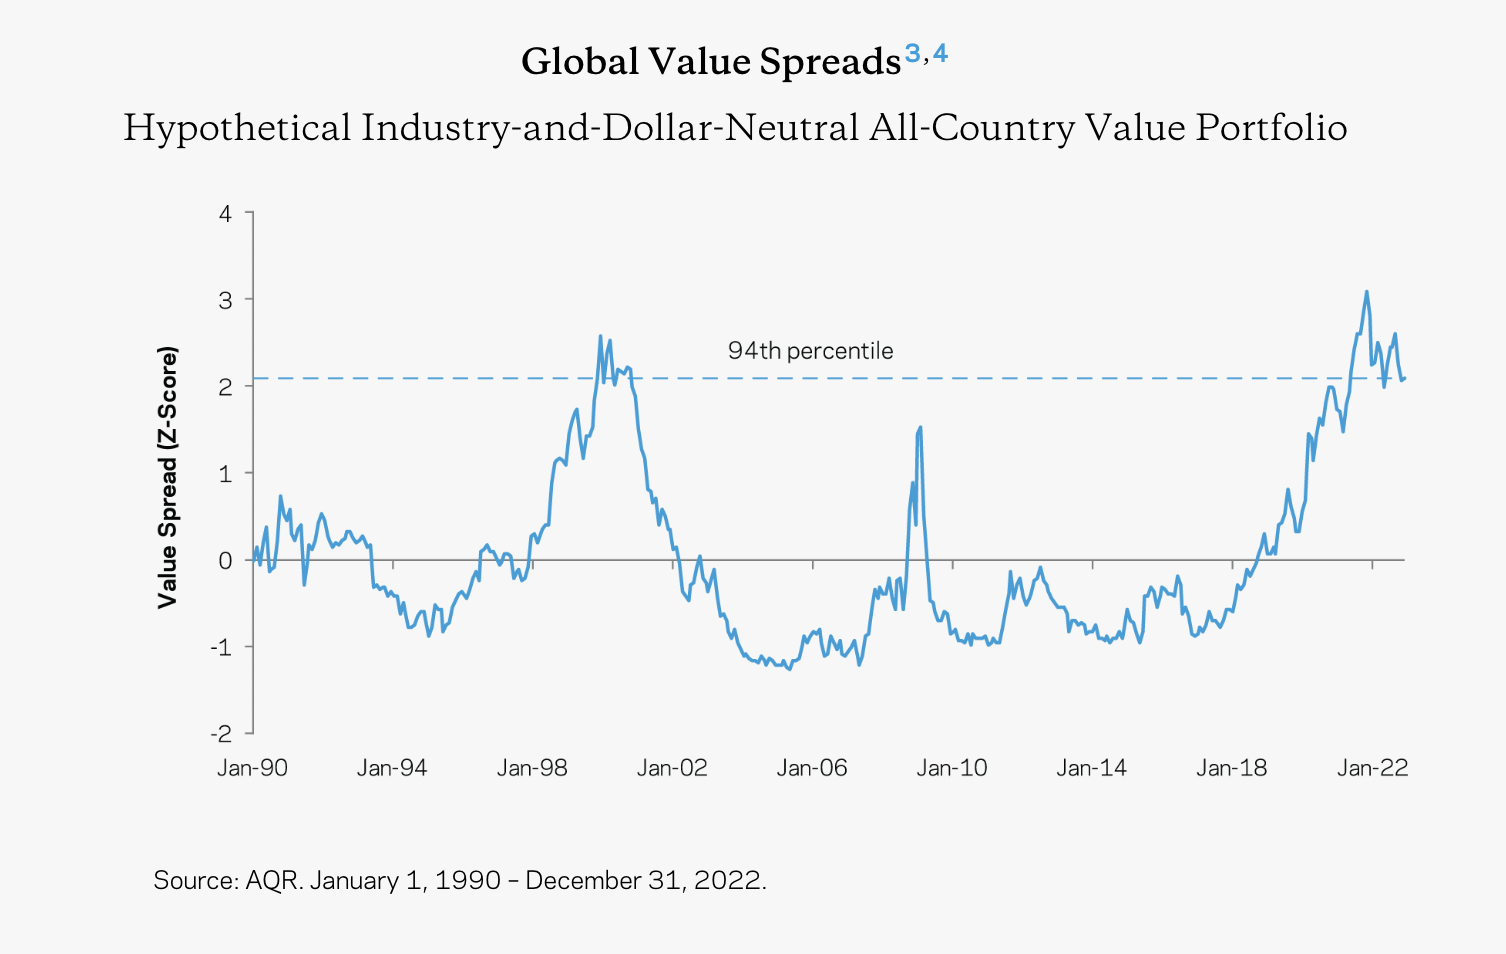
Value Spreads
Gasoline Use Distribution
- 10% of US motorists drive 30,000 miles or more and use 32% of all gasoline consumed.
- This is more than the bottom 60% put together.
- It is likely they also tend to live in rural areas and drive SUVs/pickup trucks, ubiquitous in those parts of the US.
- Transitioning these users to EV will be crucial.
- Source (good article).
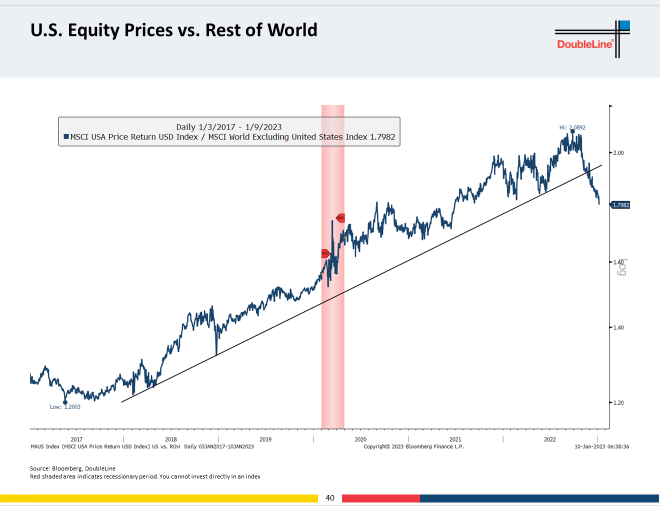
US Stocks vs World
- Breaking below the long-term trend line.
- h/t Top Down Charts.
Amazon Ads
- Fascinating development harks back to this.
- “Direct-to-consumer brands moved 20–30% of their marketing dollars in Q4 2022 from Meta to Amazon due to the former’s declining performance metrics for ads. The shift occurred despite a recent reluctance from DTC brand to sell products on Amazon because of limited access to and ownership of sales and customer data—but now that brands are receiving only $2 back for every $1 spent on Meta ads (they used to get $8 back), they are more willing to work with the e-commerce giant. According to Advantage Unified Commerce, an estimated 75% of brands report customer acquisition is cheaper on Amazon than other media channels.”
- Source (h/t Pipe).
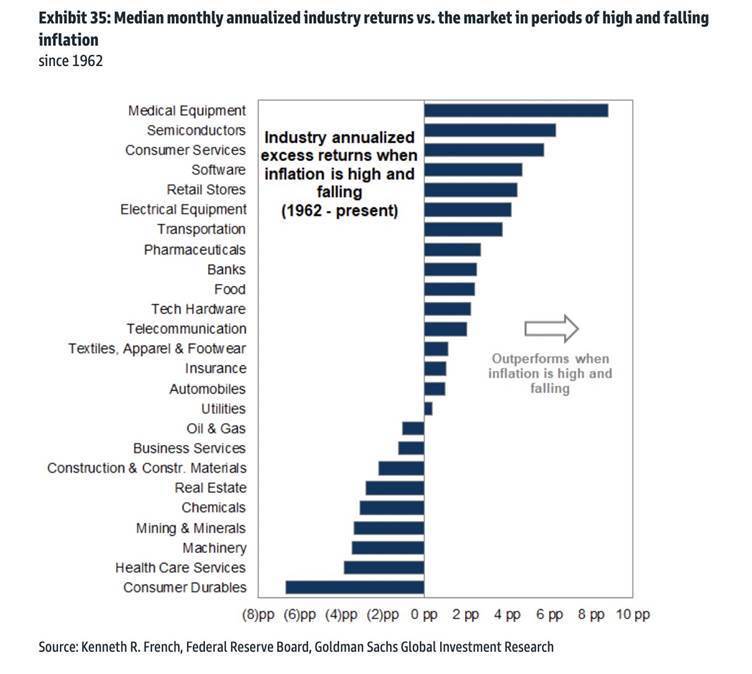
High but Falling Inflation Regime
- Useful chart – which sectors perform best in this type of regime (data since 1962).
- Source: GS.
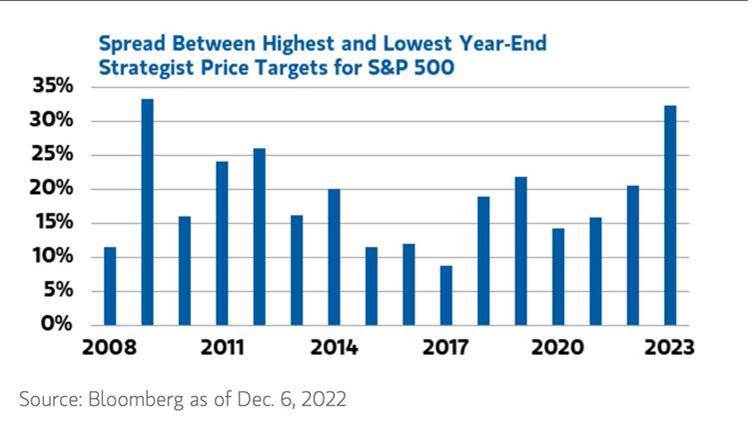
Dispersion of Strategist Targets
- Widest range of 2023E year end S&P 500 price targets since 2008.
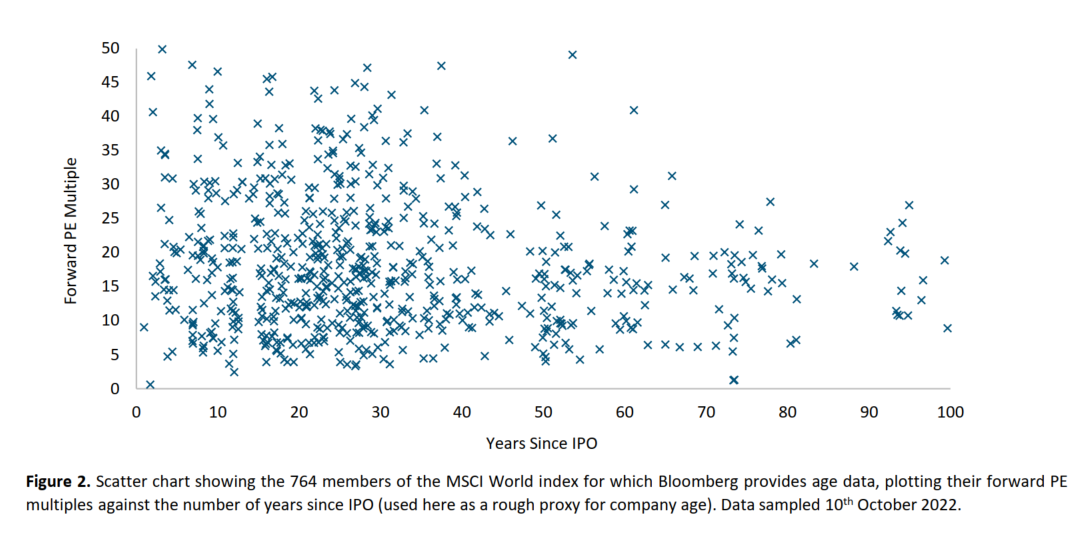
Age and Multiples
- Does the age of a company imply anything about its multiple?
- This chart from Lindsell Train suggests no.
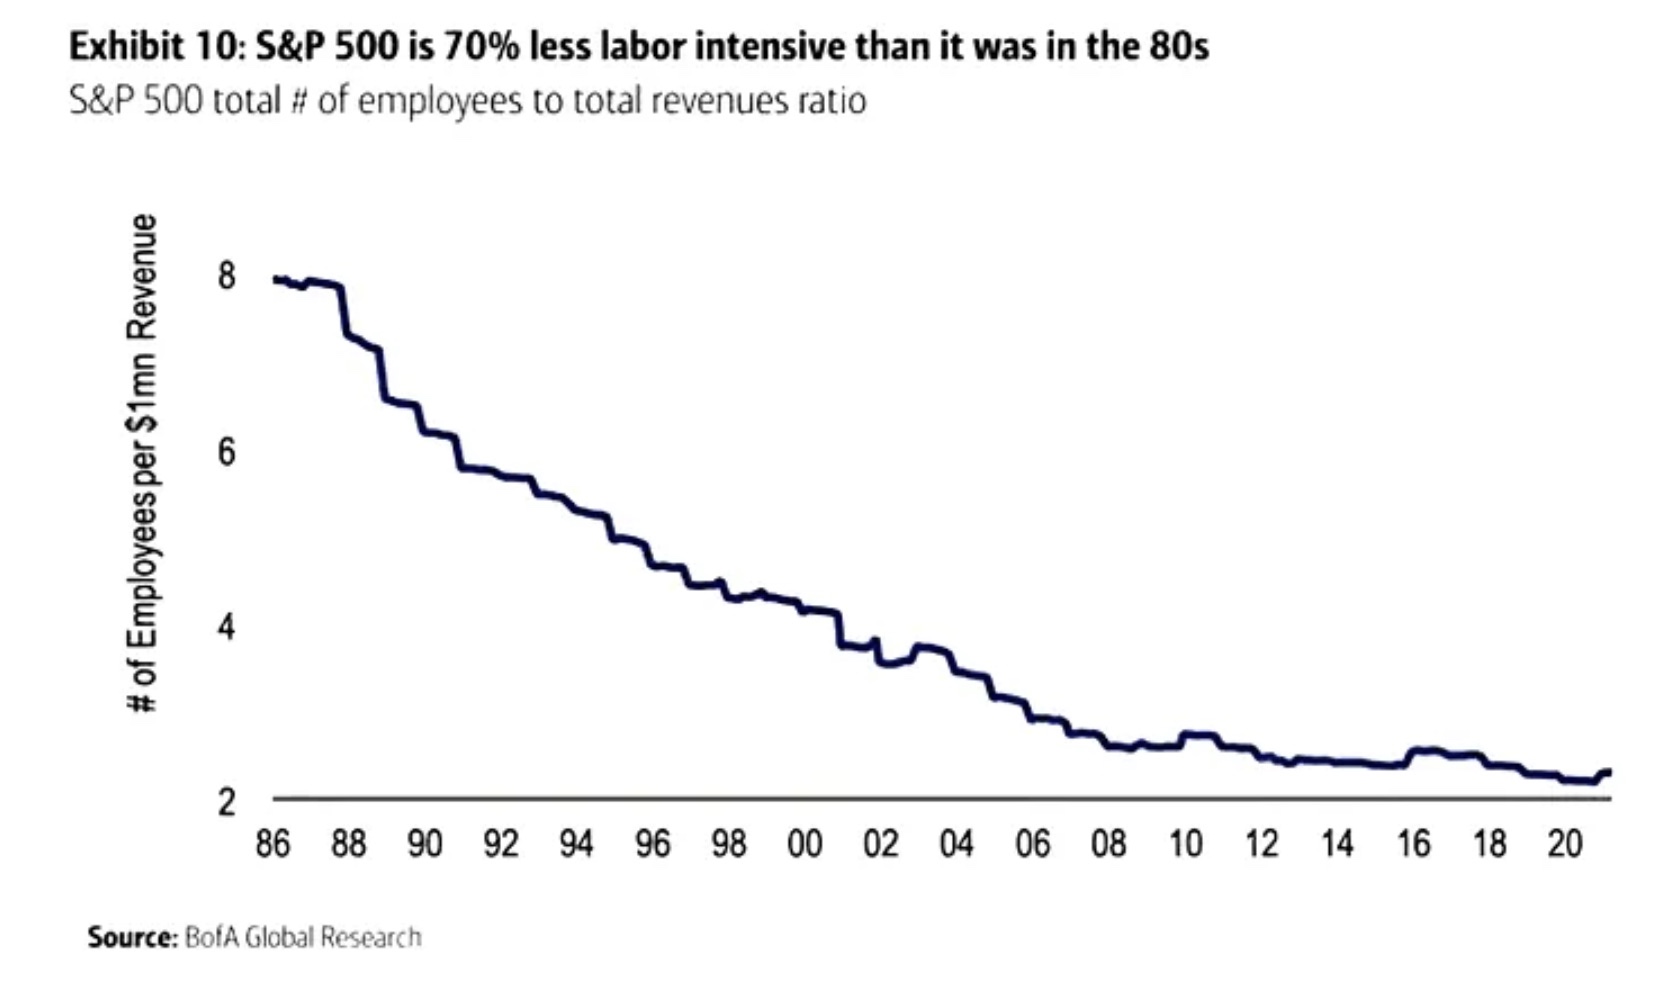
Labour Intensive
- S&P 500 is far less labour intensive than in the past.
PE Buying up SaaS
- Table of 2022 tally of acquisitions involving private equity buying public SaaS businesses.
- Source.
