- Apple is upending the traditional (x86) CPU markets.
- It is doing this by offering the same M1 chip in laptops, tablets and desktop PCs.
- The same M1 chip at all price points (from $699 to $1,699).
- “Apple’s willingness to position the M1 across so many markets challenges the narrative that such a vast array of x86 products is helpful or necessary. It puts Intel and AMD in the position of justifying why, exactly, x86 customers are required to make so many tradeoffs between high performance and low power consumption. Selling the M1 in both $699 and $1,699 machines challenges the idea that a computer’s price ought to principally reflect the CPU inside of it.“
Stocks
Interesting, and often contrarian, Snippets on individual companies and the stock market.
Teen Survey pt 2
- 41st edition of the semi-annual survey of 7,000 teens and their preferences has been released.
- Female clothing spend is inflecting upwards – strongest since 2015.
- Nike is the No. 1 fashion brand for teens—up 200 bps Y/Y; Nike is the No. 1 footwear brand—up 900 bps Y/Y
- Instagram losing share to TikTok and Snapchat.
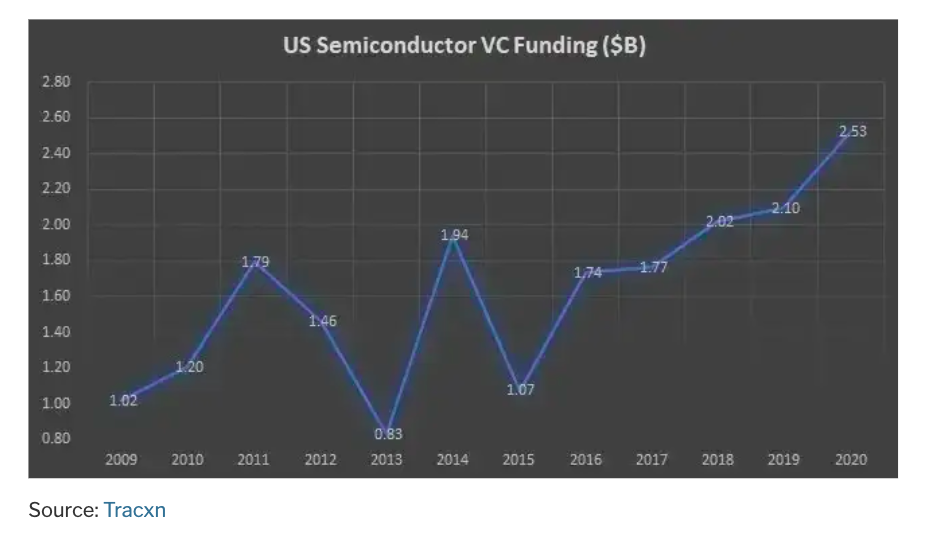
Semiconductor Start-ups
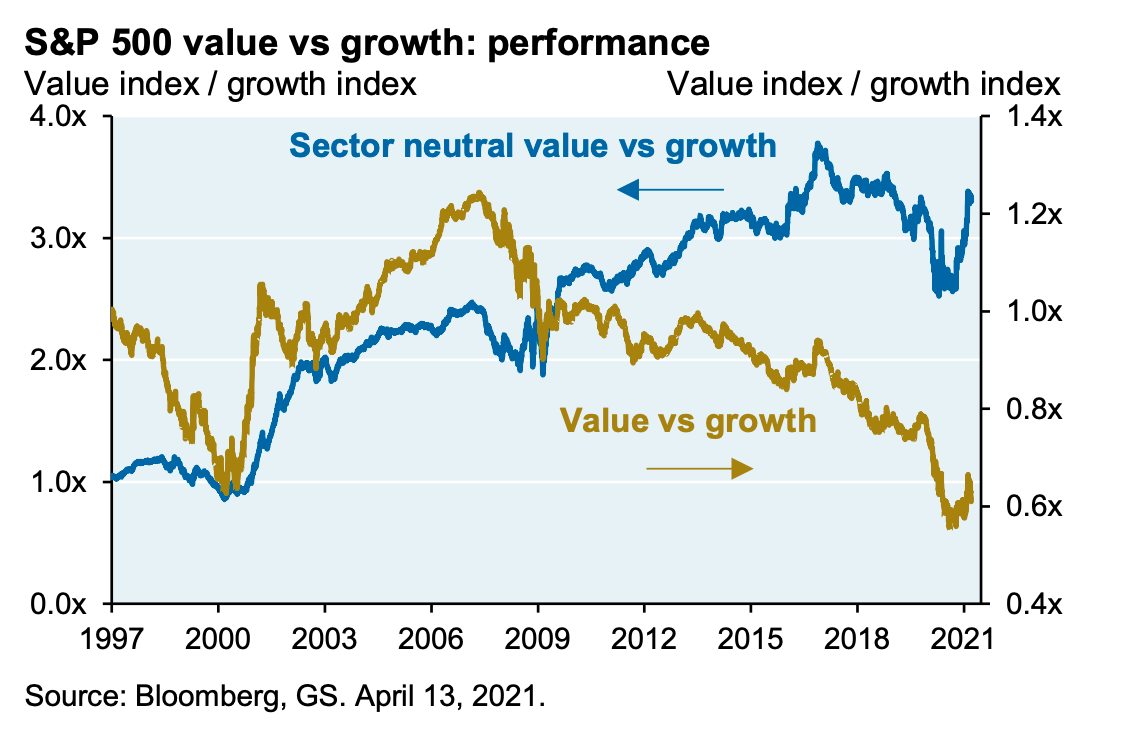
Sector Neutral Value
- Value stocks’ underperformance against growth (yellow line) is well documented.
- Things look different at the sector neutral level (blue line) i.e. picking the cheapest stocks within a given sector.
- This measure actually worked very well from 2002 to 2017/18, while the overall measure continued to fall.
- It only fell apart in the last few years as growth mania took hold, but has bounced back very sharply.
- Source.
Walmart Marketplace
- The end of March saw a floodgate open with WMT accepting what appears to be thousands of applications to its Walmart Fulfilment Services (WFS)
- As a result WFS seller numbers have tripled since October.
- WMT has also started to allow vetted international sellers on the platform, another big move as these make up the majority of Amazon sellers.
Follow
- Interestingly Apple has changed the wording in its podcast app.
- You can now “follow” podcasts vs. previously “subscribing”.
- Seemingly small change? In fact 47% of people think that subscribing means one has to pay.
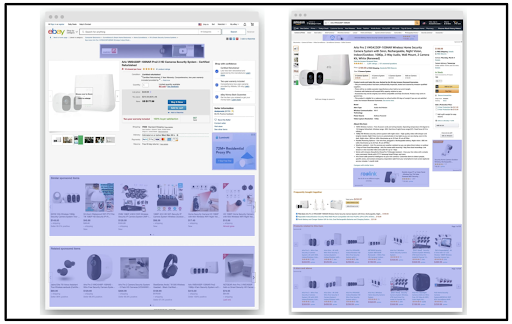
Amazon Ads
- Pictured below are Ebay and Amazon pages.
- Staggeringly, everything shaded in blue is an ad.
- Both have now replaced product recommendations with advertising.
- It makes sense as surveys show nearly 50% of product searches start on Amazon.
- Amazon’s advertising business now likely has the same profitability as its cloud business.
Holding Winners is Hard
- A nice article showing that holding winners is a trying experience.
- For example Amazon – “The near-95% crash following the tech bust is the one most people point to. The stock was underwater from 1999 to 2009! But there was a 54% crash from 2005-2006, a 58% dive in 2008 and 5 separate losses of 25% or worse since 2009.“
- Why is it so hard – “Since 1980, more than 40% of all companies in the U.S. stock market have experienced a decline of 70% or worse without recovering.“
- This link has a full analysis of the business “failures” 2017-2020 which is worth reading.
Company Valuation
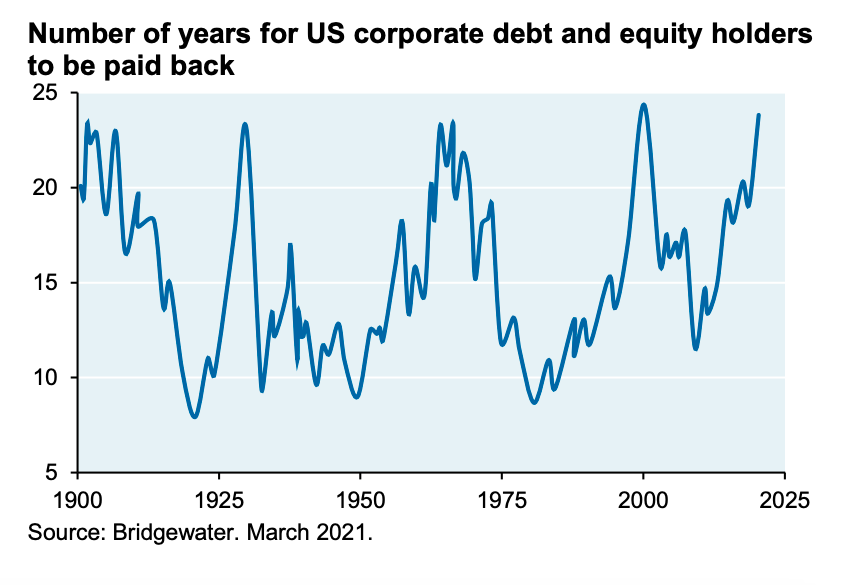
- Interesting measure from Bridgewater – it shows the number of years it would take for US companies to repay all their corporate debt and equity capitalisation via internal cash flow.
- The measure reflects leverage and market cap to cashflow equity valuation.
- It has just reached a historic high.
Growth Premium and Interest Rates
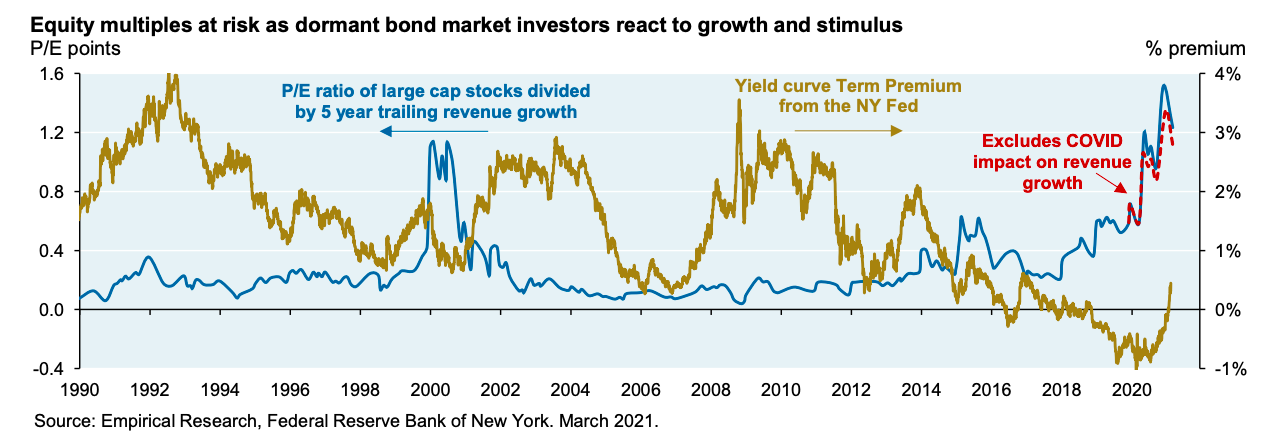
- Chart from Empirical Research shows price paid for growth (P/E multiple divided by trailing 5 year revenue growth) against the term premium in the bond market.
- “We’re now exiting a unique period of negative term premiums and growth multiples are still high. As a result, growth stocks are at risk for possibly minor changes in perceptions of future interest rates and inflation, irrespective of what the Fed decides to do and when.“
Movies
- Movies are the second most popular out of home experience in the US.
- “…the industry sold 1 billion movie theater tickets in the United States, 1 billion. It’s the third most popular out-of-home — sorry, it’s the second most popular out-of-home experience in the United States. Other than going out to eat a meal in a restaurant. If you take the attendance of all 5 major professional sports leagues together, all 150-ish teams, all sports, all games, all season long, movie theaters sold 7x the quantity of every sports event tickets sold in the United States in 2019.” Source.
WeWork Resurrection
- WeWork is trying to go public again, this time via a SPAC.
- Below is a link to their investment deck. Lots of interesting data.
- The company lost $1.7bn last year but expects things to improve as normal conditions return.
- They believe a WeWork solution would save 26% vs. the cost of traditional real-estate.
- The transaction puts enterprise value at $9bn or 6.6x adjusted 2023E EBITDA.
- There are a lot of adjustments to EBITDA that need to be looked into and SPAC transactions have issues, but on the surface that looks a lot more reasonable than the peak valuation of $47bn.
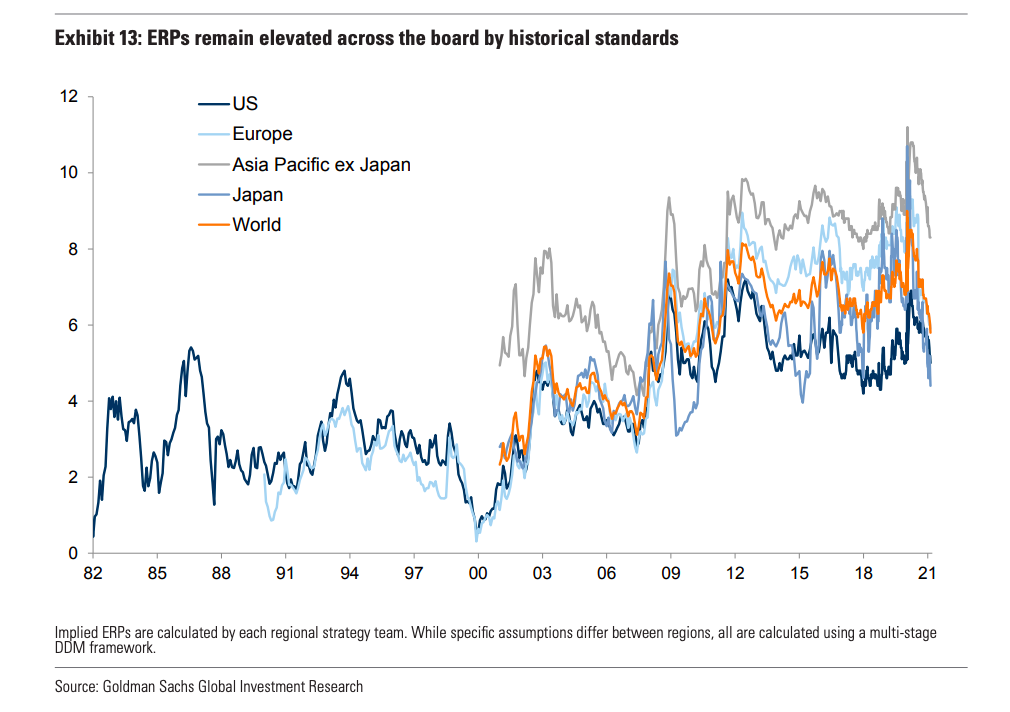
Equity Risk Premium
- The only equity valuation metric that does not look stretched is the equity risk premium (ERP).
- It is currently elevated in most cases, even relative to the low rate/low inflation environment post 2000.
Ruffer Review
- 2021 Ruffer Review is out.
- Their annual publications always worth a read.
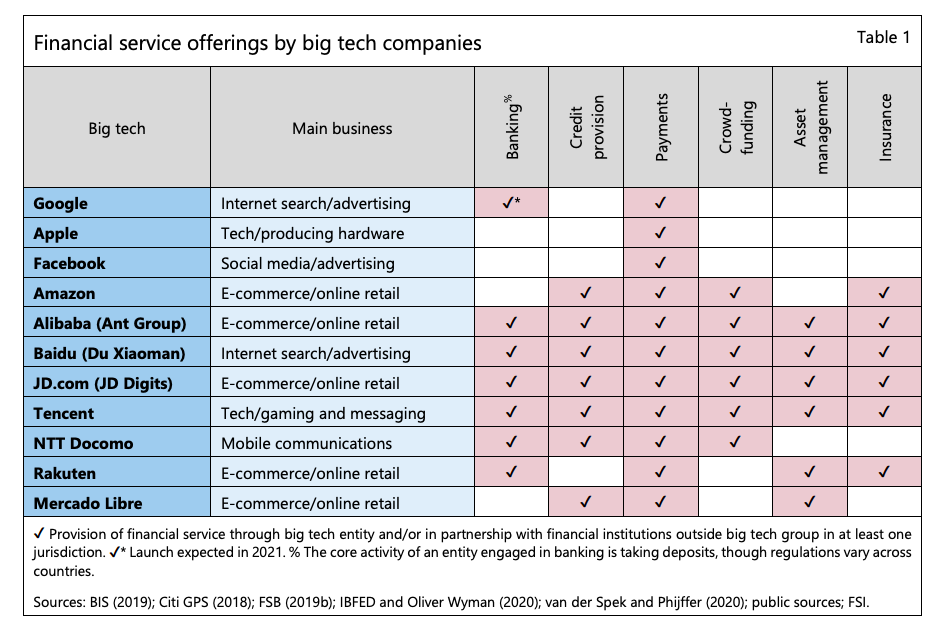
Big Tech in Finance
- Large tech firms continue to plot their way into financial services.
- This table from a new BIS report shows the current lay of the land.
Walmart and Fintech
- A good read on the giant retailer’s efforts to crack financial services.
- It makes a lot of sense to get into financial services but it is far from easy.
- The latest iteration is their partnership with the famous Ribbit Capital.
Tim Wu
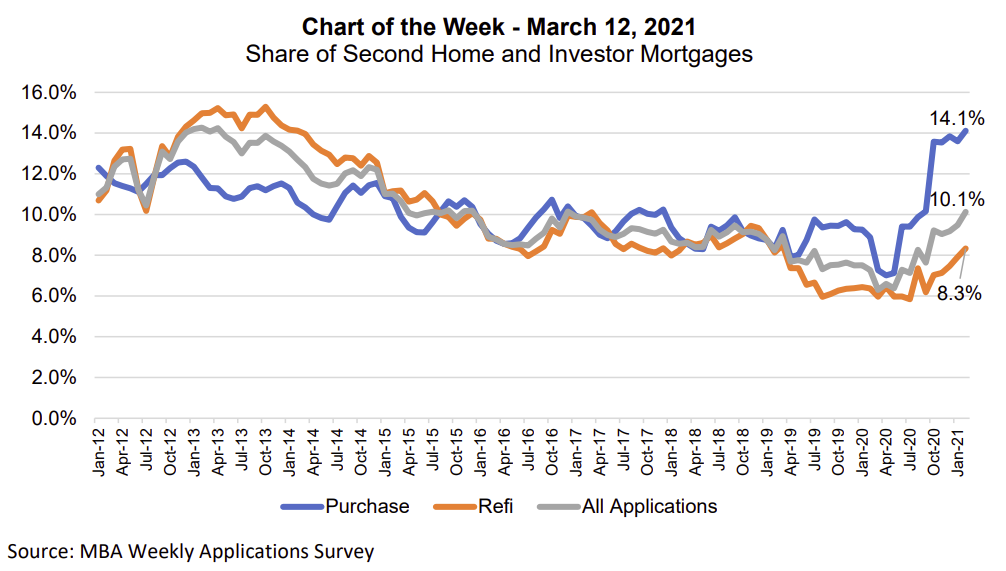
Second Homes
- February 2021 saw 14.1% of new purchase mortgage applications related to a second home (or investment property).
- This is above the 2018/19 average of 9%.
- Source.
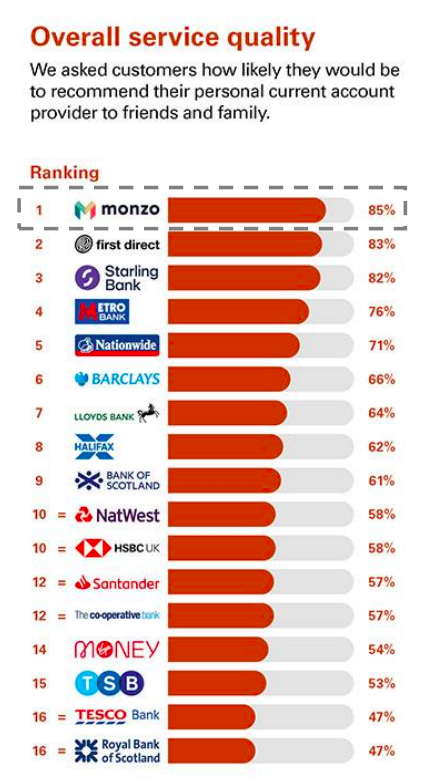
Bank Replacements
- Stark results from a UK survey asking customers if they would recommend their personal current account provider.
- RBS comes last (47%) and Monzo is first (85%) – says all you need to know.
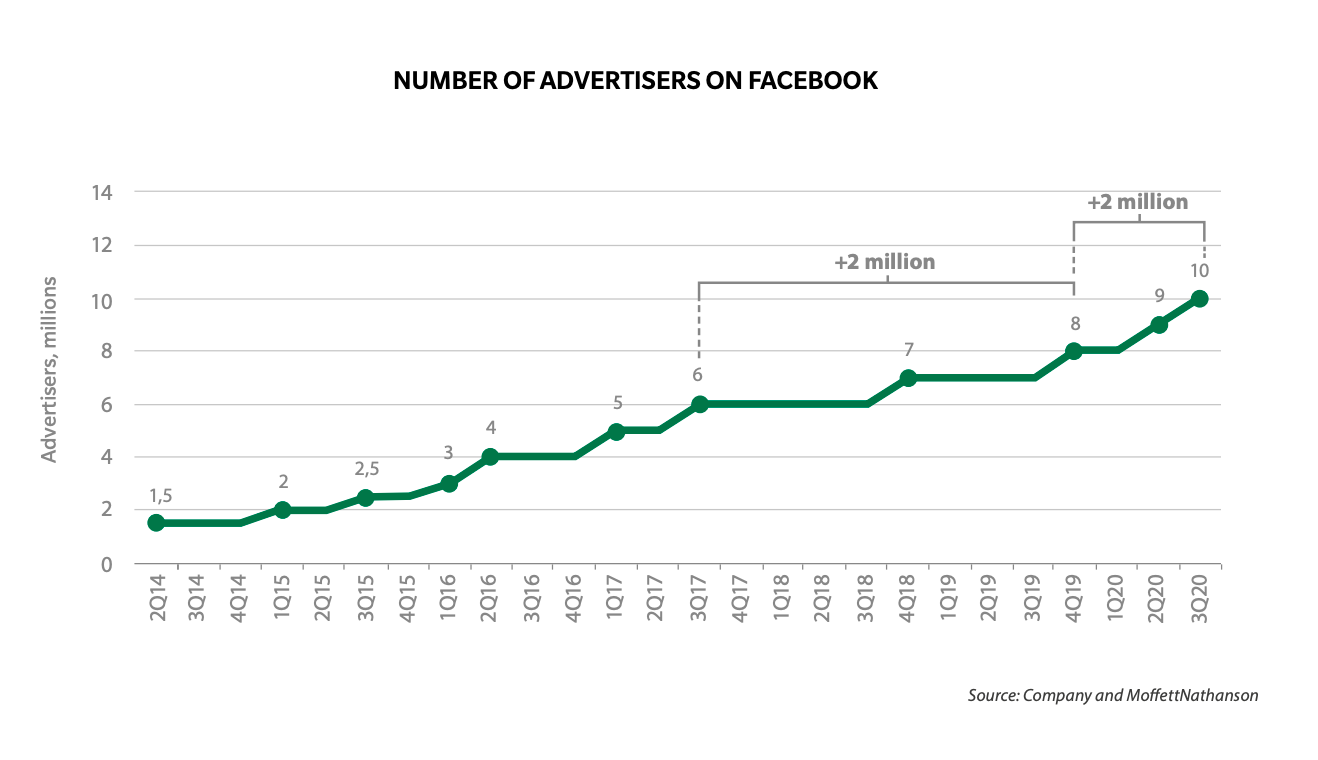
- In the three quarters of 2020 Facebook added 2m advertisers to its platform.
- This is the same amount as in the preceding three years.
- Source.