- Under the radar the FDA has introduced a new regulatory pathway for insulin biosimilars (generic copies of biologic drugs).
- “Today is a milestone for the future of insulin and other important treatments – potentially a new era of proposed biosimilar and interchangeable insulin products.”
- This will increase competition.
- Likely a big issue for the insulin oligopoly Sanofi, Novo Nordisk and Eli Lilly.
Stocks
Interesting, and often contrarian, Snippets on individual companies and the stock market.
Softbank
- Blaming ratings agencies doesn’t exactly fill anyone with confidence.
- Softbank put out this statement asking for Moody’s to withdraw rating due to “excessively pessimistic assumptions regarding the market environment and misunderstanding and speculation that SBG will quickly liquidate assets without any thorough consideration and without making improvements to its financial condition“
Interview with Ventilator Manufacturer
- Really interesting Interview with the CEO of Drägerwerk, the world leader in the production of ventilators.
- On car plants being repurposed to make ventilator components – “There is little point in adapting unused production capacity to manufacture respiratory aids. I spoke with Daimler over the weekend. They would also like to help. But it’s unfortunately not so simple. We can’t build cars either.
- Repurposing devices – “There is a lot of potential there... I believe it’s possible to use devices from ambulance service or anaesthesiology departments. Such devices aren’t meant for long-term respiration, but they can serve that purpose.”
- The real problem is lack of experts – “It’s not about the device, but about the person who is attached to it. You have to be able to evaluate the person’s state and know how to precisely adjust the device to first save the person’s life and then ensure that they quickly grow healthy again. This requires years of experience.”
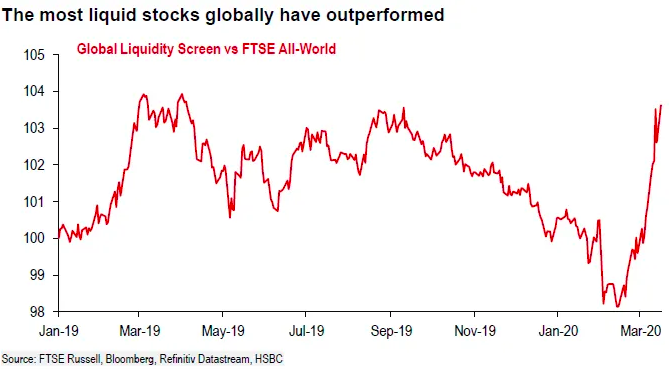
Liquid stocks outperforming
- Staggering outperformance in the sell-off of the most liquid stocks.
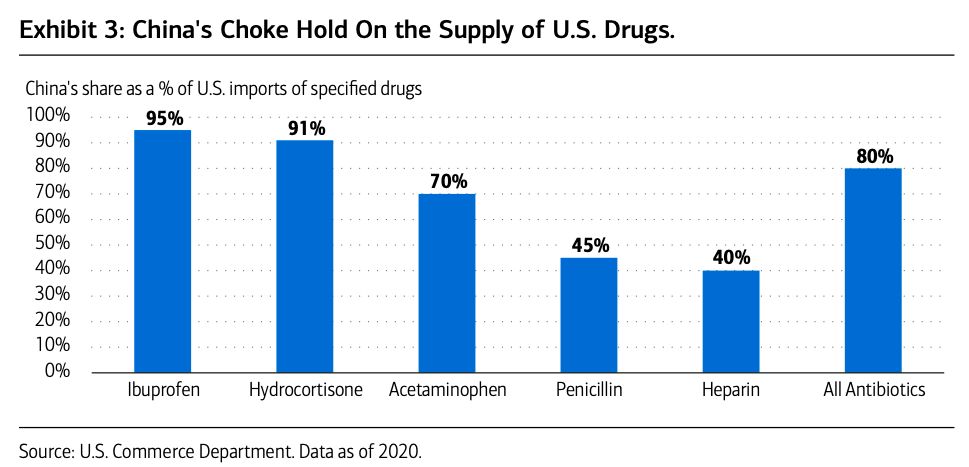
US Drug Imports from China
- China accounts for a huge portion of imports into the US of active ingredients and finished product of various crucial drugs.
- Source: Merrill Lynch.
Pershing Square Letter
- Latest letter from Ackman’s fund.
- Good work on those hedges.
- “On March 3, 2020, we disclosed that we had acquired large notional hedges …
- “On March 23rd, we completed the exit of our hedges generating proceeds of $2.6 billion for the Pershing Square funds ($2.1 billion for PSH), compared with premiums paid and commissions totaling $27 million, which offset the mark-to-market losses in our equity portfolio. Our hedges were in the form of purchases of credit protection on various global investment grade and high yield credit indices. Because we were able to purchase these instruments at near-all-time tight levels of credit spreads, the risk of loss from this investment was minimal at the time of purchase.”
- “We have redeployed substantially all of the net proceeds from our hedges by adding to our investments in Agilent, Berkshire Hathaway, Hilton, Lowe’s, and Restaurant Brands. We have also purchased several new investments including reestablishing our investment in Starbucks which we sold in January. The proceeds of the hedges have enabled us to become a substantially larger shareholder of a number of our portfolio companies, and to add some new investments, all at deeply discounted prices. Even after these additional investments, we maintain a cash position of about 17% of the portfolio. “
Covid Impact
- Interesting impacts of Covid shutdown cited by companies.
- Best Buy – “We are seeing a surge in demand across the country for products that people need to work or learn from home, as well as those products that allow people to refrigerate or freeze food“.
- Music streaming might not actually be going up (here and here).
- Grub CEO interview – “But demand from consumers is really a mixed bag. In some markets it’s staying stable, some are doing much better, and others are slowing. It’s not obvious how it will impact business in the long-term as the supply of restaurants are transitioning now and up to 30% of them could close because it’s too expensive to run.”
- “…when we looked at the Chinese recovery, what we have seen is 90% to 95% of large manufacturers in China are now back to work in some capacity. Closer to 65% to 70% of small businesses in Mainland China are coming back to work from a manufacturing perspective. So we believe output is in around 65% to 75% and we are seeing that rebound.” Fedex Call.
- “There is currently evidence of increased customer activity in the Group’s Casino and Poker products that might, in part, compensate for the sports betting disruption for a period of time.” 888 Trading Update.
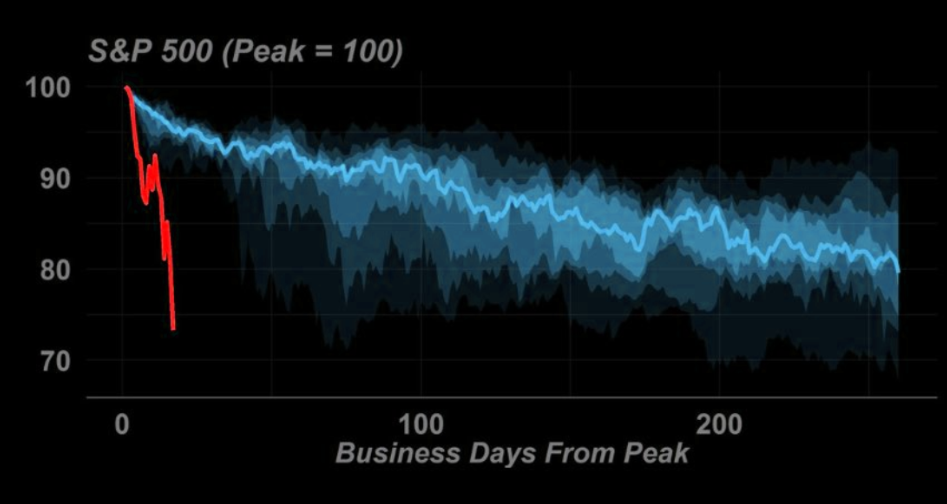
Stock Market Fall
- This has been a really staggering speed of decline.
AMZN
- Amazon are selling their new tech – Just Walk Out – to retail stores.
- They have announced a few signed deals but didn’t disclose with who.
- Reports suggest it is trying to court Walmart, Target.
Media (cont.)
Tik Tok
- Comprehensive article about Tik Tok.
- Worth reading about an asset that went from $1bn valuation in 2017 to $78bn today.
- 45 minutes spent on it per day on average rivals many other media properties.
Private Equity
- Interesting emerging trend of private equity firms buying from themselves – from one generation fund to the next.
- This used to be one-off transactions but now some are raising funds specifically for this.
- For example the TA Associates Select Opportunities Fund.
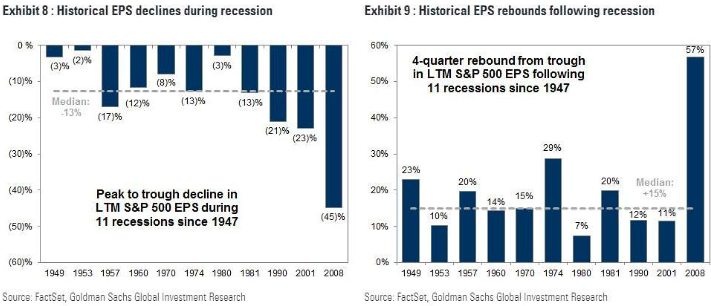
Recession EPS
- For those trying to model a recession this is a good chart to think about – EPS falls and rises during and after recessions respectively.
Walmart+
- Walmart are working on a Prime competitor.
- It is likely at first to be a rebrand of Walmart Delivery Unlimited ($98 per year for free same day delivery).
- They then hope to add perks – prescription drugs, gasoline discounts – things Amazon can’t compete with.
Sucralose
- A recent study has some negative conclusions for the artificial sweetener Sucralose.
- They found that Sucralose + carbohydrates in healthy people can lead to glucose intolerance increasing risk of diabetes.
- This is negative for Tate & Lyle.
- Word of caution – the study had only 60 participants and didn’t control for other food intake during the investigation period.
- Artificial sweeteners have been seeing a lot of negative research.
- This is an interesting start-up that instead of making artificial sweeteners is developing a new delivery mechanism for sugar.
- It has the same taste but 40% less sugar is needed
Coronavirus
- Contrasting coronavirus related transcript quotes.
- “We began to see the impact of the coronavirus on our business in mid-January with occupancy declines gradually spreading from Wuhan to other markets in the Asia Pacific region. In February RevPAR at our hotels in Greater China declined almost 90% versus the same period last year.” – Marriott International CEO Arne M. Sorenson
- “we’re seeing that many of the cities around China, people are actually going back to work. We’re seeing some of the shops in Beijing are opening up. When you’re going on the freeway now, you’re actually seeing traffic jams versus, say, two, three weeks ago, where the roads were pretty empty…we started seeing activity pick up a little bit two weeks ago. And then also, this week, we’re also seeing continued pickup.“- Baidu (BIDU) CFO Herman Yu
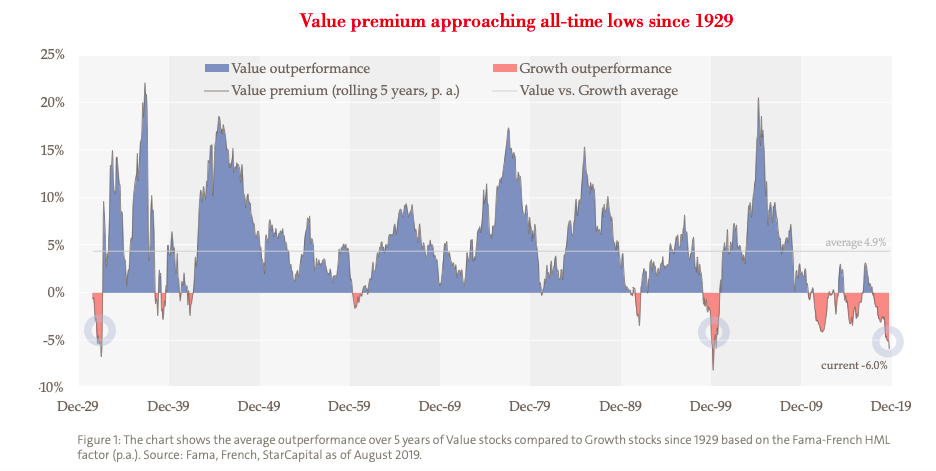
Value
- Interesting long term chart of value and growth outperformance.
- “The development of share prices has long vindicated this theory: from 1926 to 2007, Value stocks recorded around 5% higher annual returns than Growth stocks. Over the last five years, Value stocks have underperformed Growth stocks by an average of nearly 6% per year.”
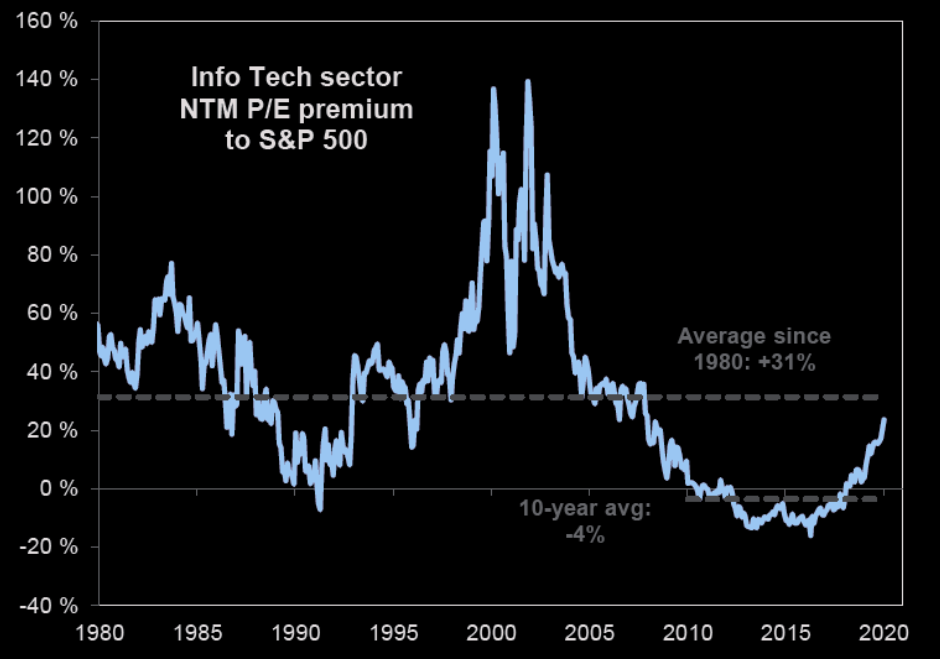
Tech Valuation
- IT sector P/E premium to S&P 500 is around average since 1980s.
- There is a lot of volatility.
Fintechs becoming banks
- LendingClub are acquiring Radius Bank (for $185m).
- First time a US fintech is acquiring a bank outright (vs. applying for license).
- Interesting development.
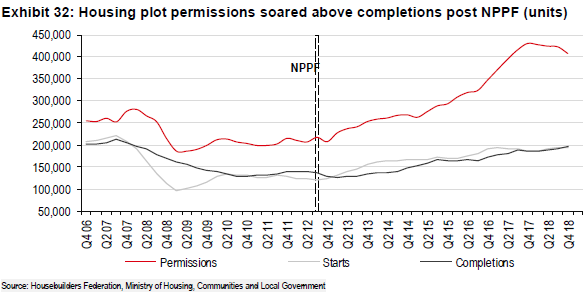
UK Housing
- This is a chart that shows how, after a change in planning policy (NPPF) in the UK in 2012, the amount of land permitted for construction went up.
- New building starts and completions on the other hand didn’t.
- In other words house-builder hoarded the land and constrained supply.
- On the other side help-to-buy continued to keep demand strong inflating prices.
- Margins went up to 20%