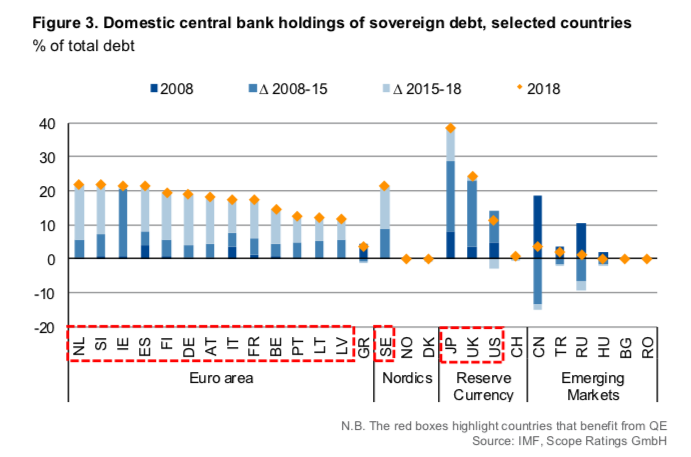
- Great chart showing the current level of sovereign debt held by central banks across different countries (as % of GDP).
- From 2008 (dark blue) until 2018 (orange diamond) and …
- … how we got there (lighter blue lines show changes).
- h/t ScopeRatings
Central Bank as Debt Holders