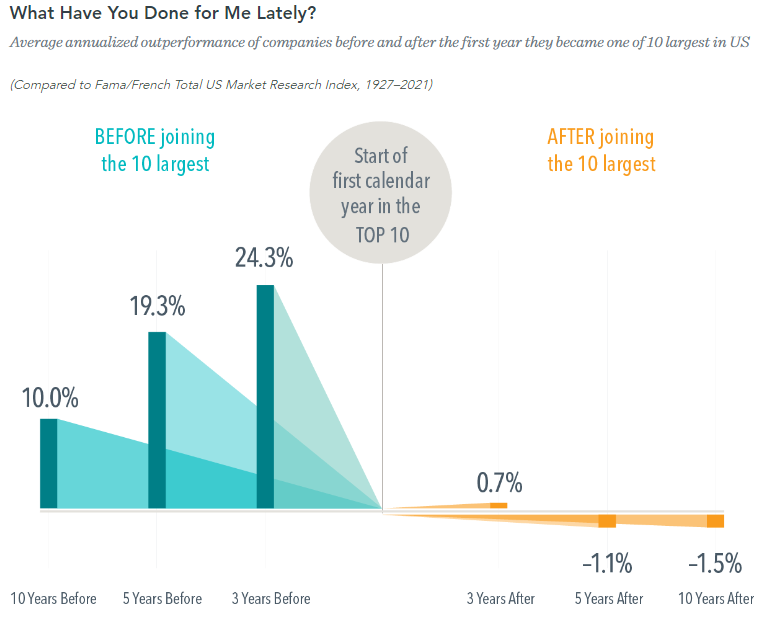
- This chart “shows the average annualized outperformance of stocks after they’ve become one of the largest top 10 in the S&P 500.”
- “As you can see, the top 10 largest companies underperform by an average of -1.5% over the subsequent 10 years.”
- Source.
Concentration Risks