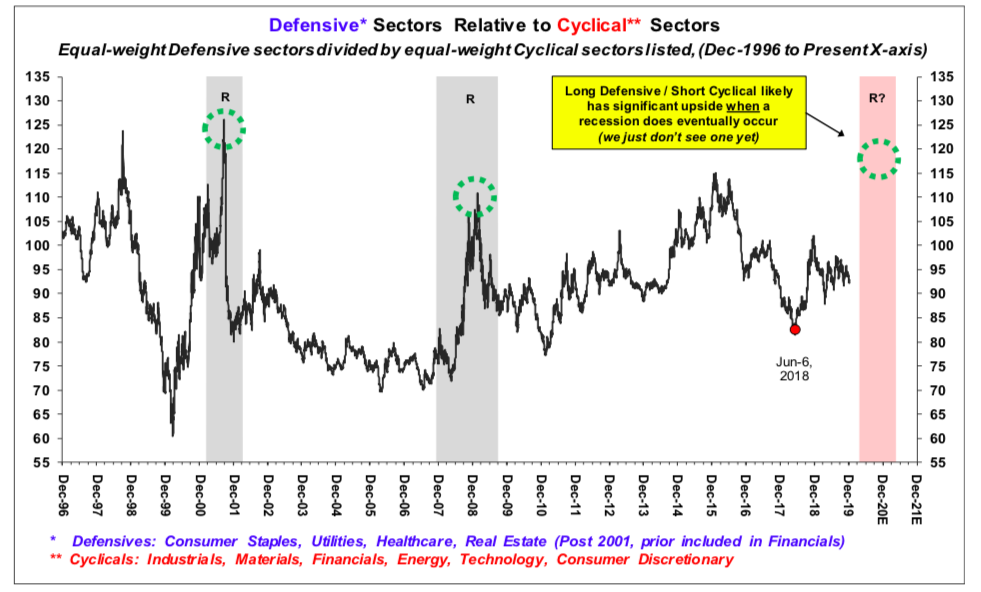
- This is a chart of defensive sectors (think e.g. utilities) vs. cyclical sectors (think industrials).
- Interesting to see how for the majority of the recovery defensive sectors actually outperformed. This stopped only after 2016.
- The most recent rally has been mostly led by defensives as well.
Defensive vs. Cyclical