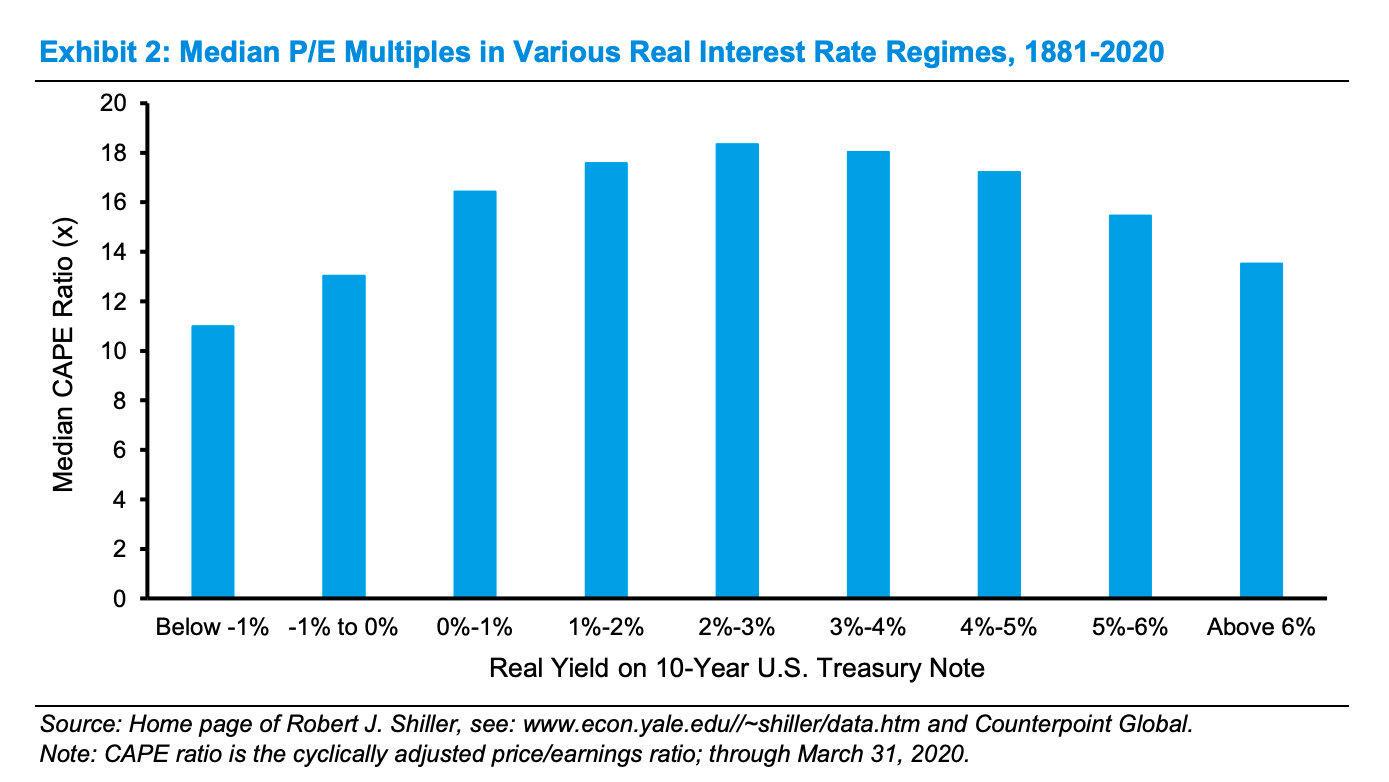
- A great historic (1881-2020) chart showing median cyclically adjusted P/E multiples (CAPE) during various interest rate regimes.
- There is a balance – low interest rates mean future cash flows are worth more discounted but are associated with weaker growth.
- The chart suggests a goldilocks principle – highest P/Es associated with real interest rates in the middle of the range.
Equity Valuation and Interest Rates