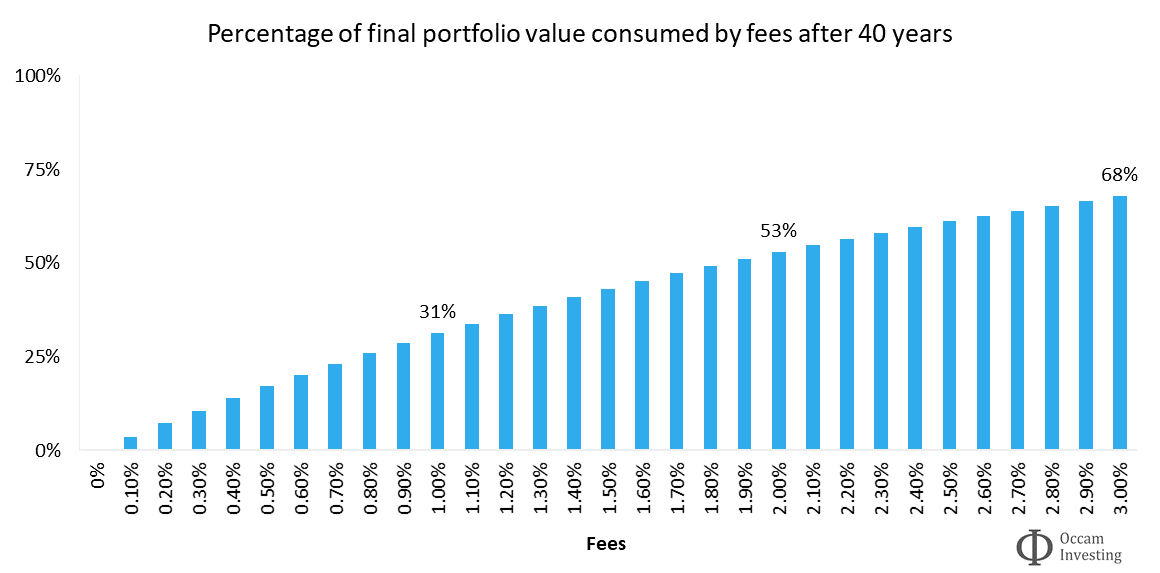
- Pretty staggering chart on how much of the final value of a portfolio is consumed by fees at various fee rates (x-axis).
- It assume a portfolio returning 7% pa (this could be 0-10% and not change the analysis) over 40 years.
- A 1% fee consumes 31% of the final value.
- Definitely worth reading the full article – which discusses the question of whether fees predict performance.
Fund Management Fees