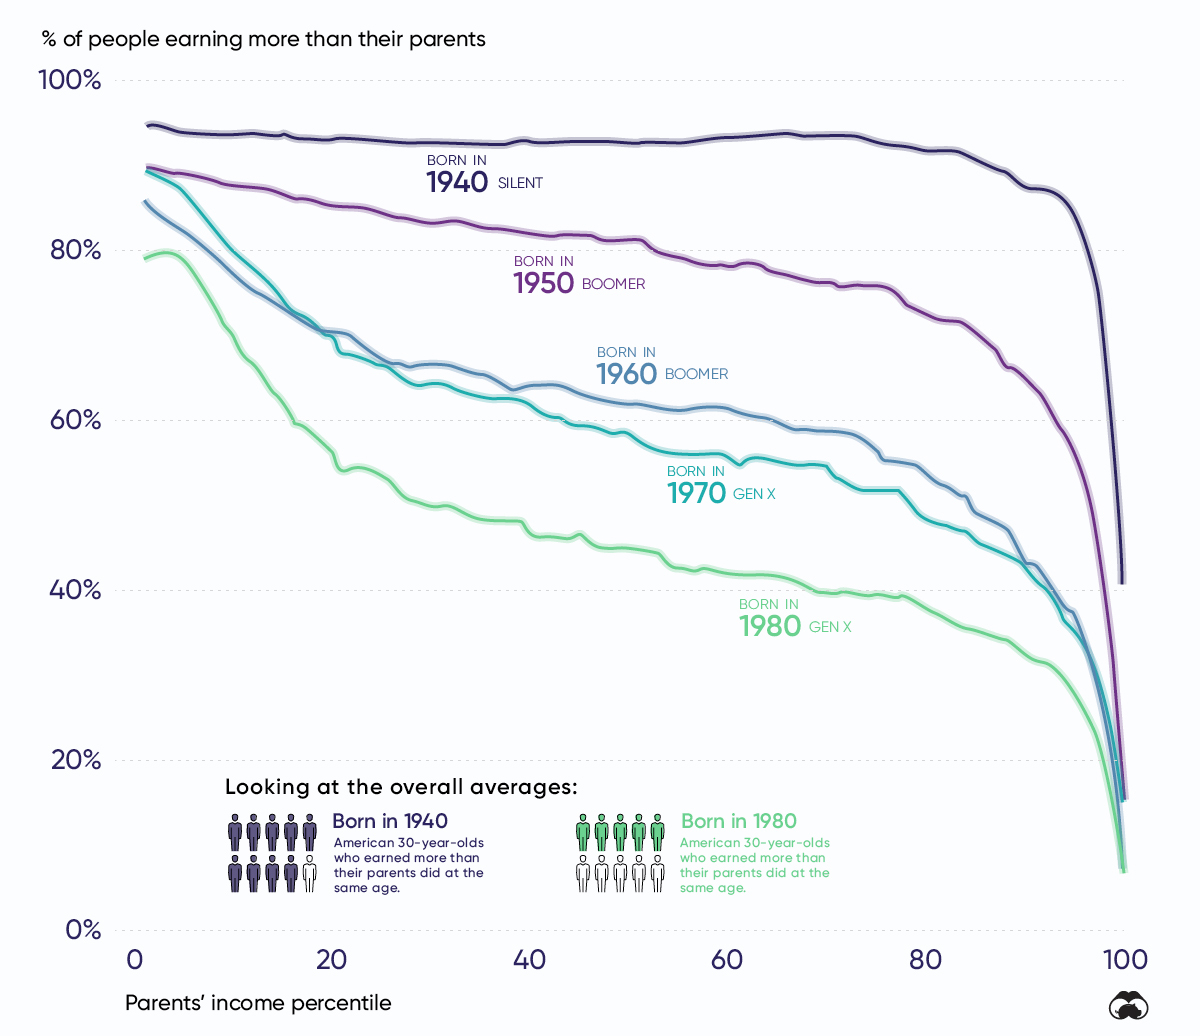
“This graphic plots the probability that a 30-year-old American has to out earn their parents (vertical axis) depending on their parent’s income percentile (horizontal axis). The 1st percentile represents America’s lowest earners, while the 99th percentile the richest.“
Take the 50th percentile (“middle class”) – the probability of someone out-earning their parents has fallen precipitously – it was 93% for people born in 1940 and dropped to 45% for those born in 1980.