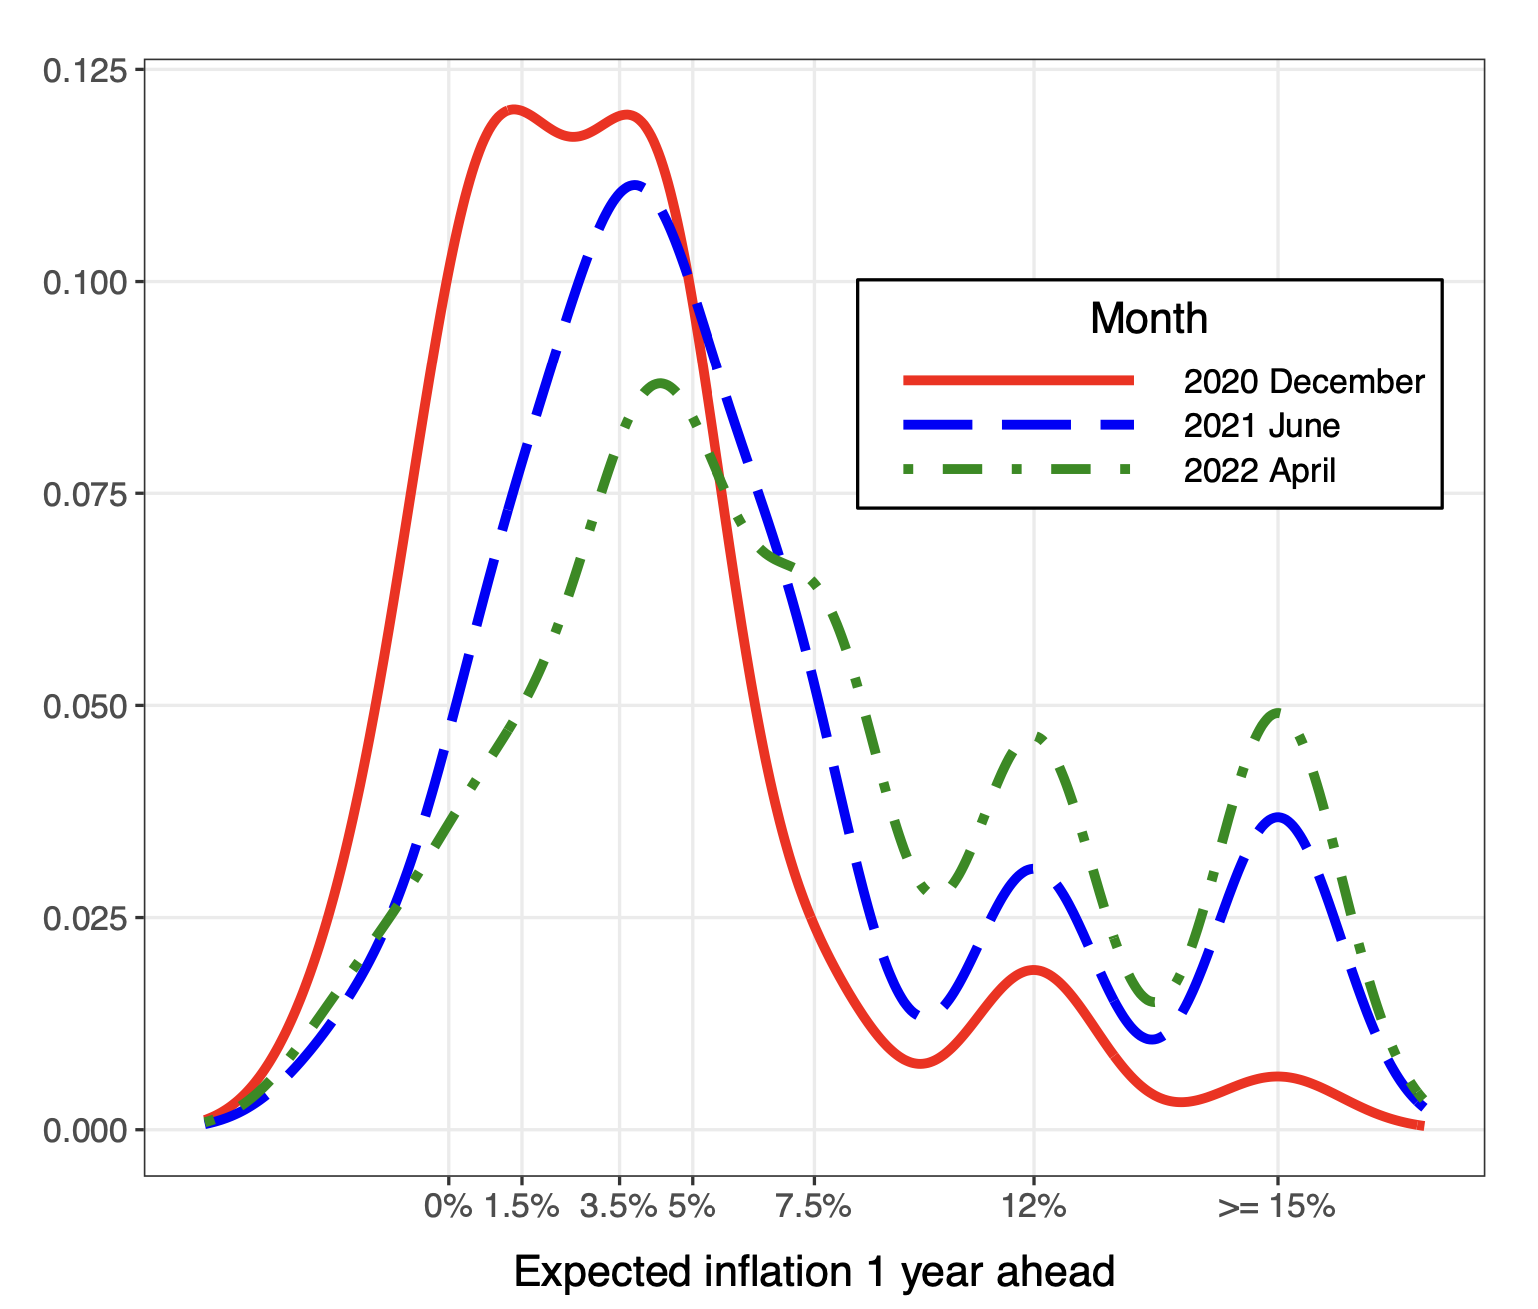
- Fascinating chart from BIS on how survey inflation expectations shift over time.
- As they say – first you get skewness, then variance, then both decline and the mean shifts.
- Temporary shocks become persistent in expectations.
- This happened in 1960s into 1970s in the US and 2010s in Brazil (see page 11 of deck).
Inflation Expectations