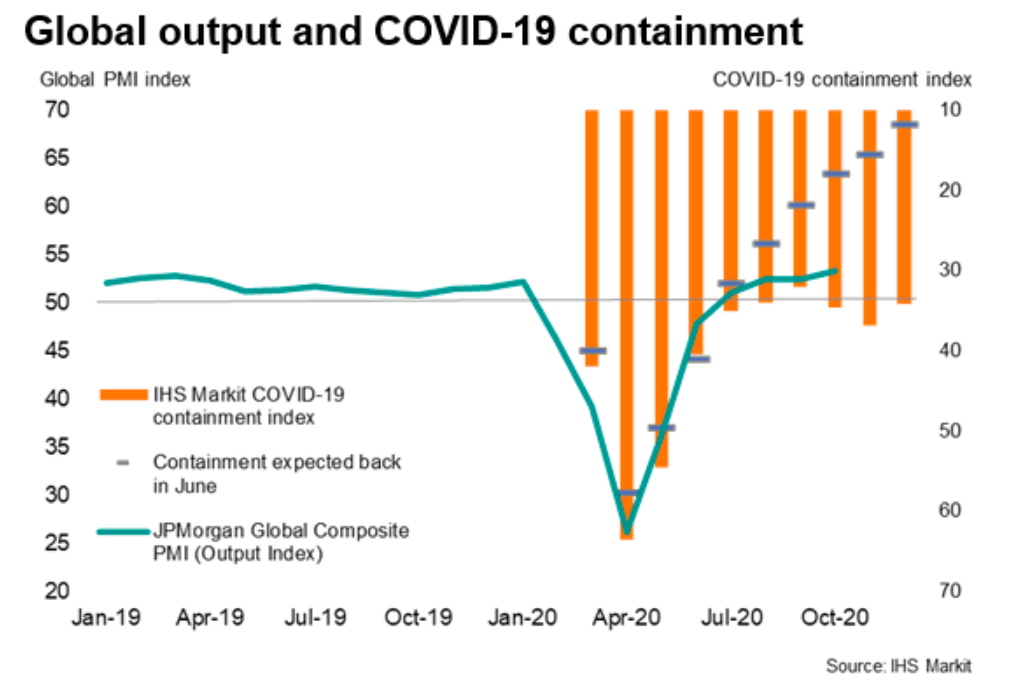
- Interesting chart plotting global PMI (green line) against an index of containment (orange line, degree to which economies are locked up).
- This index eased from a peak of 64 in April to 32 in September, helping PMIs rise.
- In October it has started to rise to 35, and throughout has remained higher than what was expected a few months ago (dashes) – it should have been 18 by now.
- Suggests PMIs could start to weaken again?
PMIs and Containment