A nice article showing that holding winners is a trying experience.
For example Amazon – “The near-95% crash following the tech bust is the one most people point to. The stock was underwater from 1999 to 2009! But there was a 54% crash from 2005-2006, a 58% dive in 2008 and 5 separate losses of 25% or worse since 2009.“
Why is it so hard – “Since 1980, more than 40% of all companies in the U.S. stock market have experienced a decline of 70% or worse without recovering.“
This link has a full analysis of the business “failures” 2017-2020 which is worth reading.
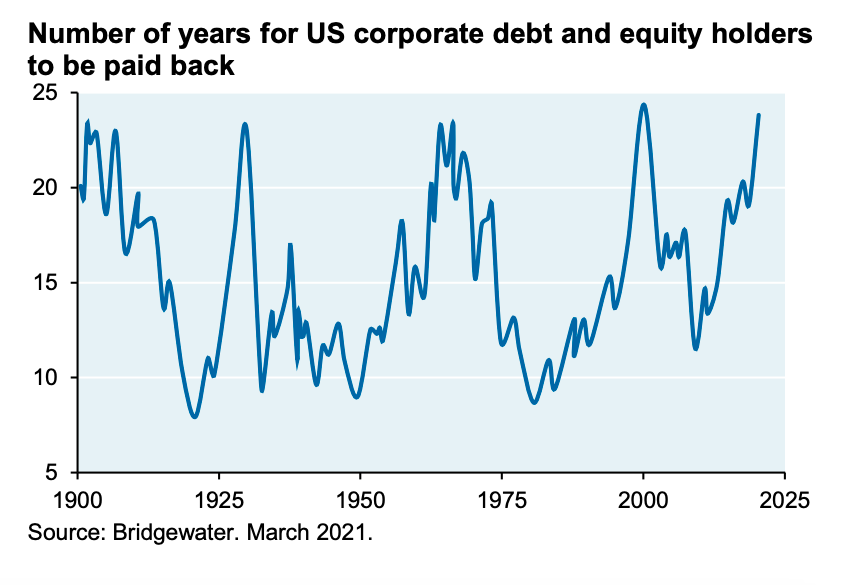
Interesting measure from Bridgewater – it shows the number of years it would take for US companies to repay all their corporate debt and equity capitalisation via internal cash flow.
The measure reflects leverage and market cap to cashflow equity valuation.
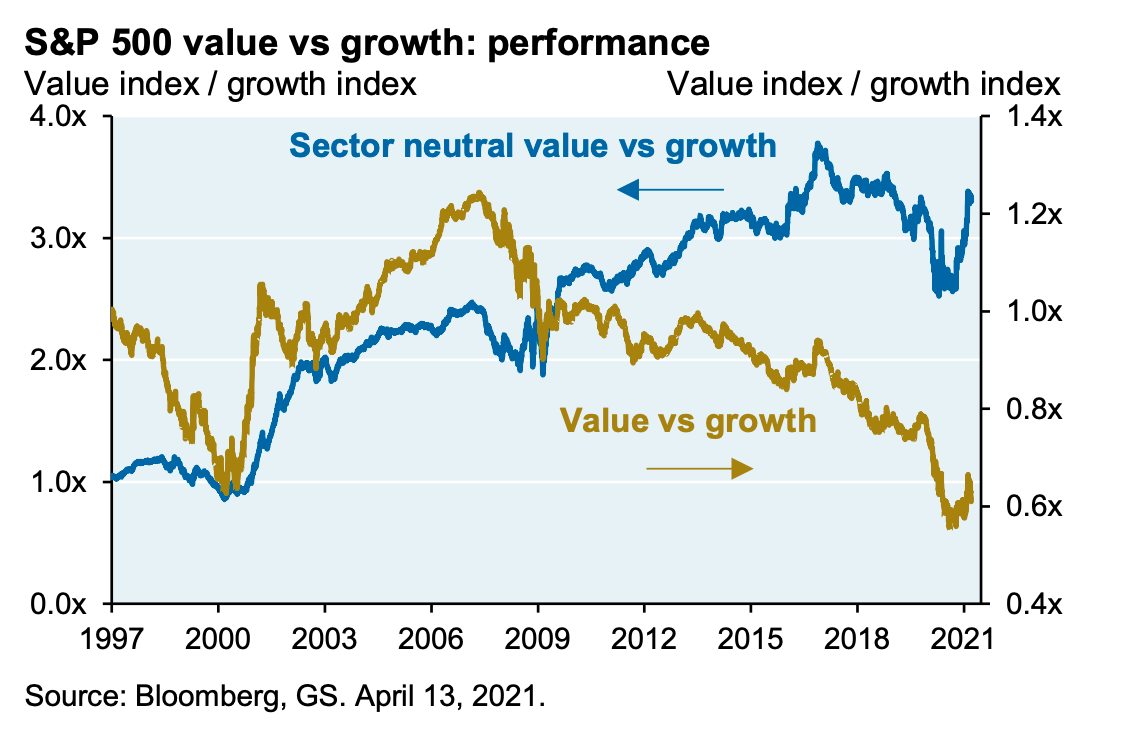
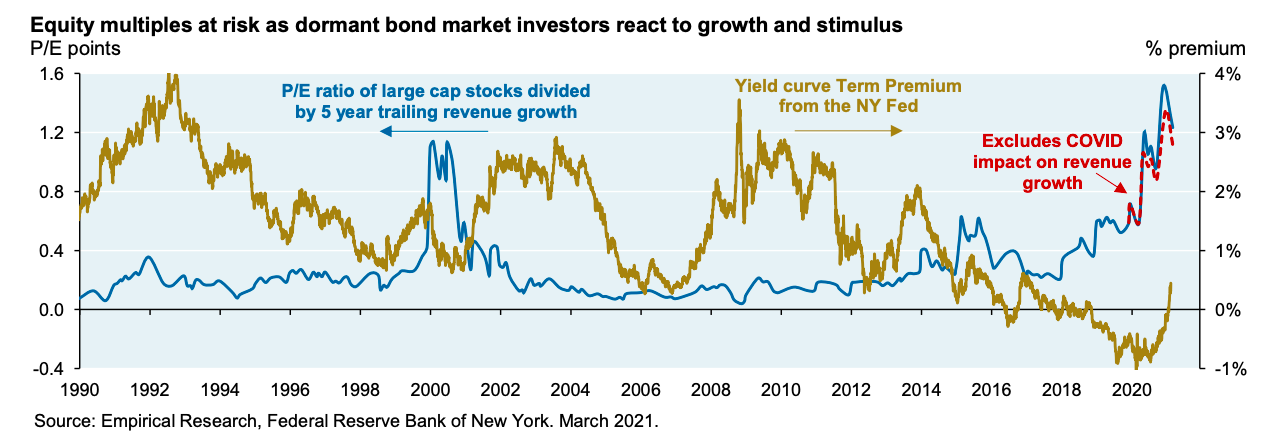
Chart from Empirical Research shows price paid for growth (P/E multiple divided by trailing 5 year revenue growth) against the term premium in the bond market.
“We’re now exiting a unique period of negative term premiums and growth multiples are still high. As a result, growth stocks are at risk for possibly minor changes in perceptions of future interest rates and inflation, irrespective of what the Fed decides to do and when.“
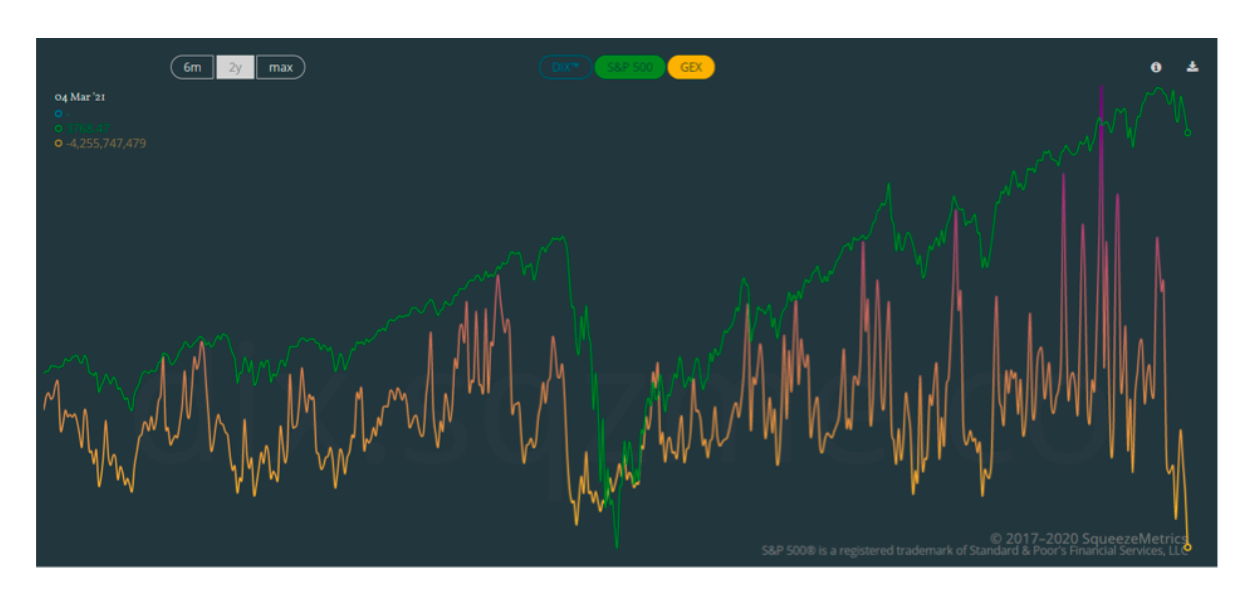
This chart shows the S&P 500 (green line) vs. dealer gamma exposure (yellow/purple line).
“The read is simple: positive dealer gamma means that dealer flow attenuates market flow (i.e. the brakes are on); negative dealer gamma means that dealer flow amplifies market flow (i.e. pedal to the metal).”
The level on the 4th of March is 30% more than this time last year – which ever direction the market moves it will be get an extra boost.
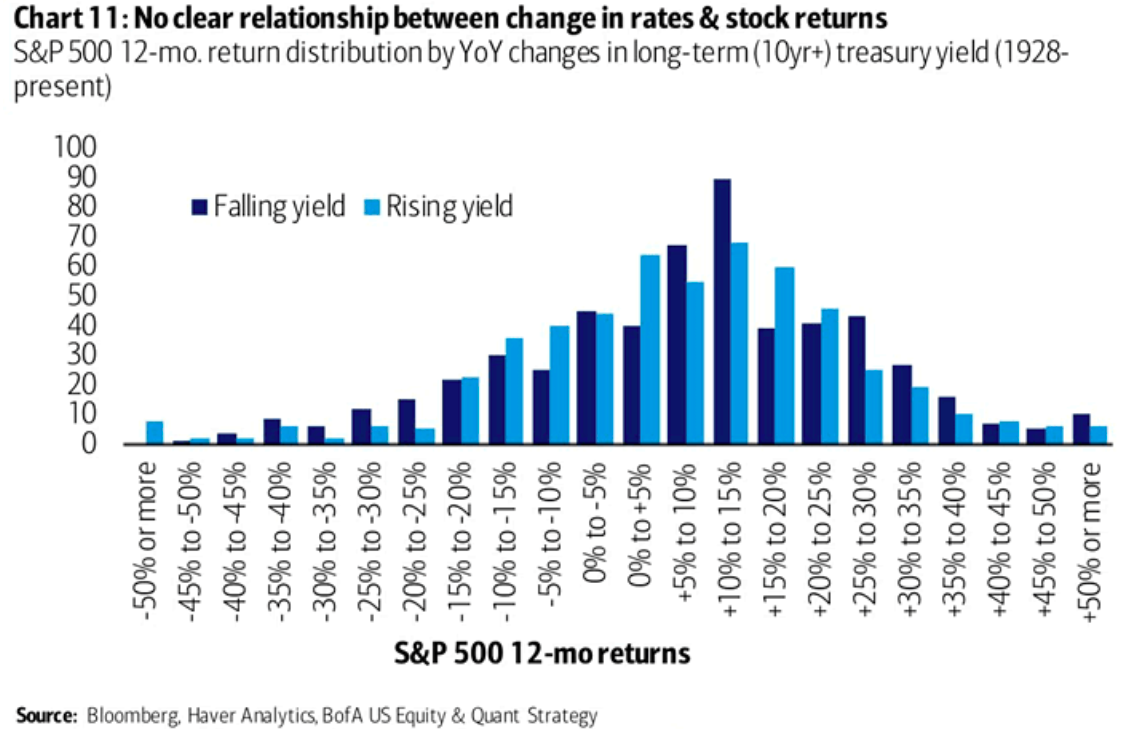
This chart suggests there is no clear relationship between changes in rates (captured by 10-year treasury yield) and S&P 12 month returns using data from 1928 – today.
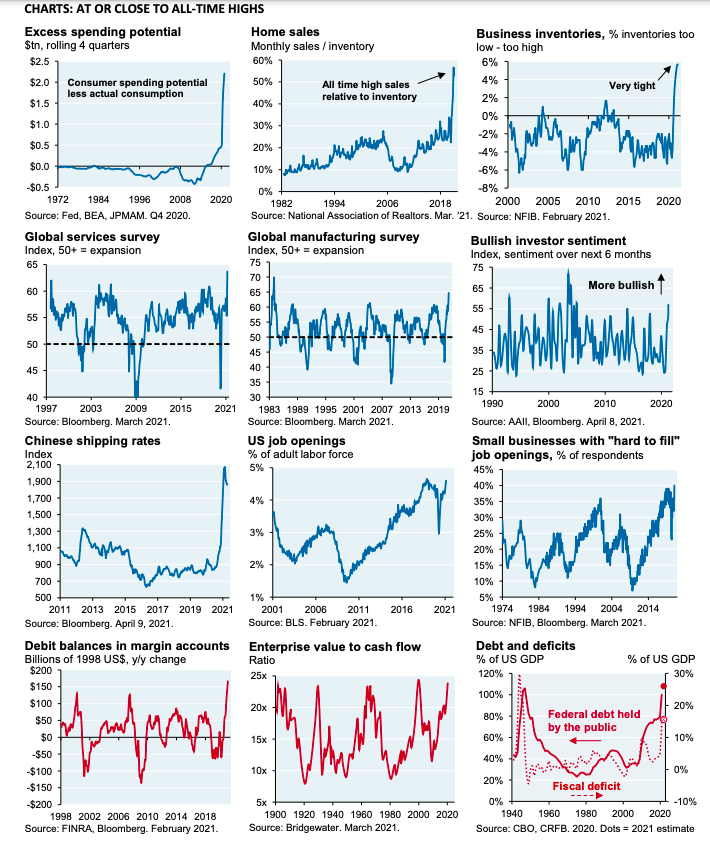
Some amazing stats on the state of US federal finance – debt levels are about to hit World War II peaks (as % of GDP), and the projected 2020 deficit (at 16% of GDP) is the largest since 1945.
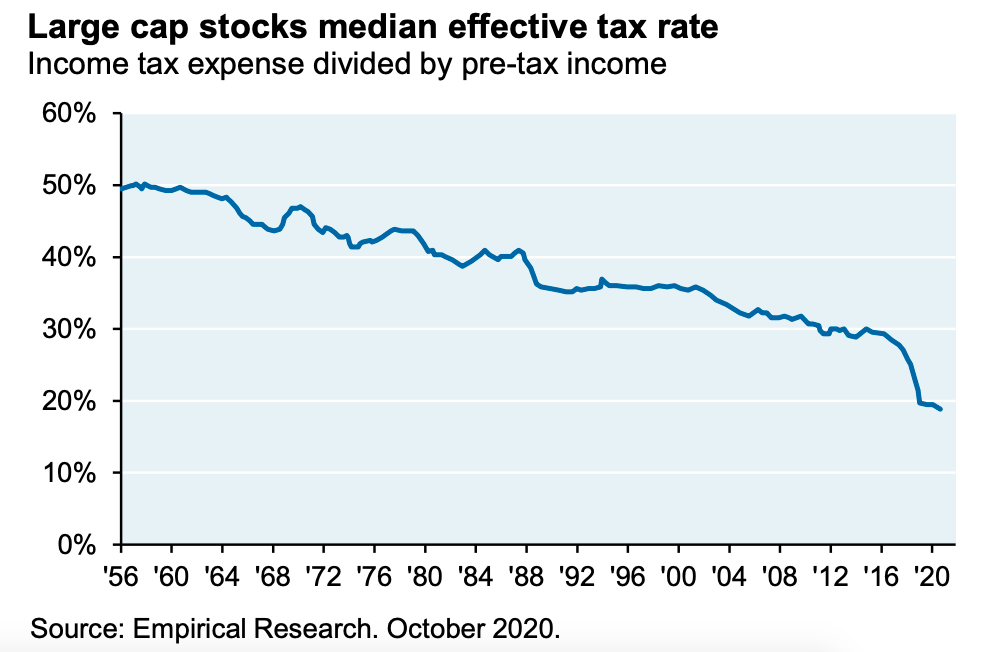
This interesting chart shows the fall in the corporate effective tax rate for large cap stocks over the years.
Under Biden’s plan – which will raise $2.2trn by raising and broadening corporate taxes (vs. $700bn Trump corporate tax cuts) – this trend could reverse (costing 10% of S&P EPS).
We covered the topic of the misuse of intangibles by some participants in our innugral blog post.
This is an interesting academic paper that corrects this by appreciating that the question is one of developing better valuation metrics.
The authors improve on the classic value factor by adding intangible assets (based on cumulative SG&A spending) – creating a new and better performing valuation measure.