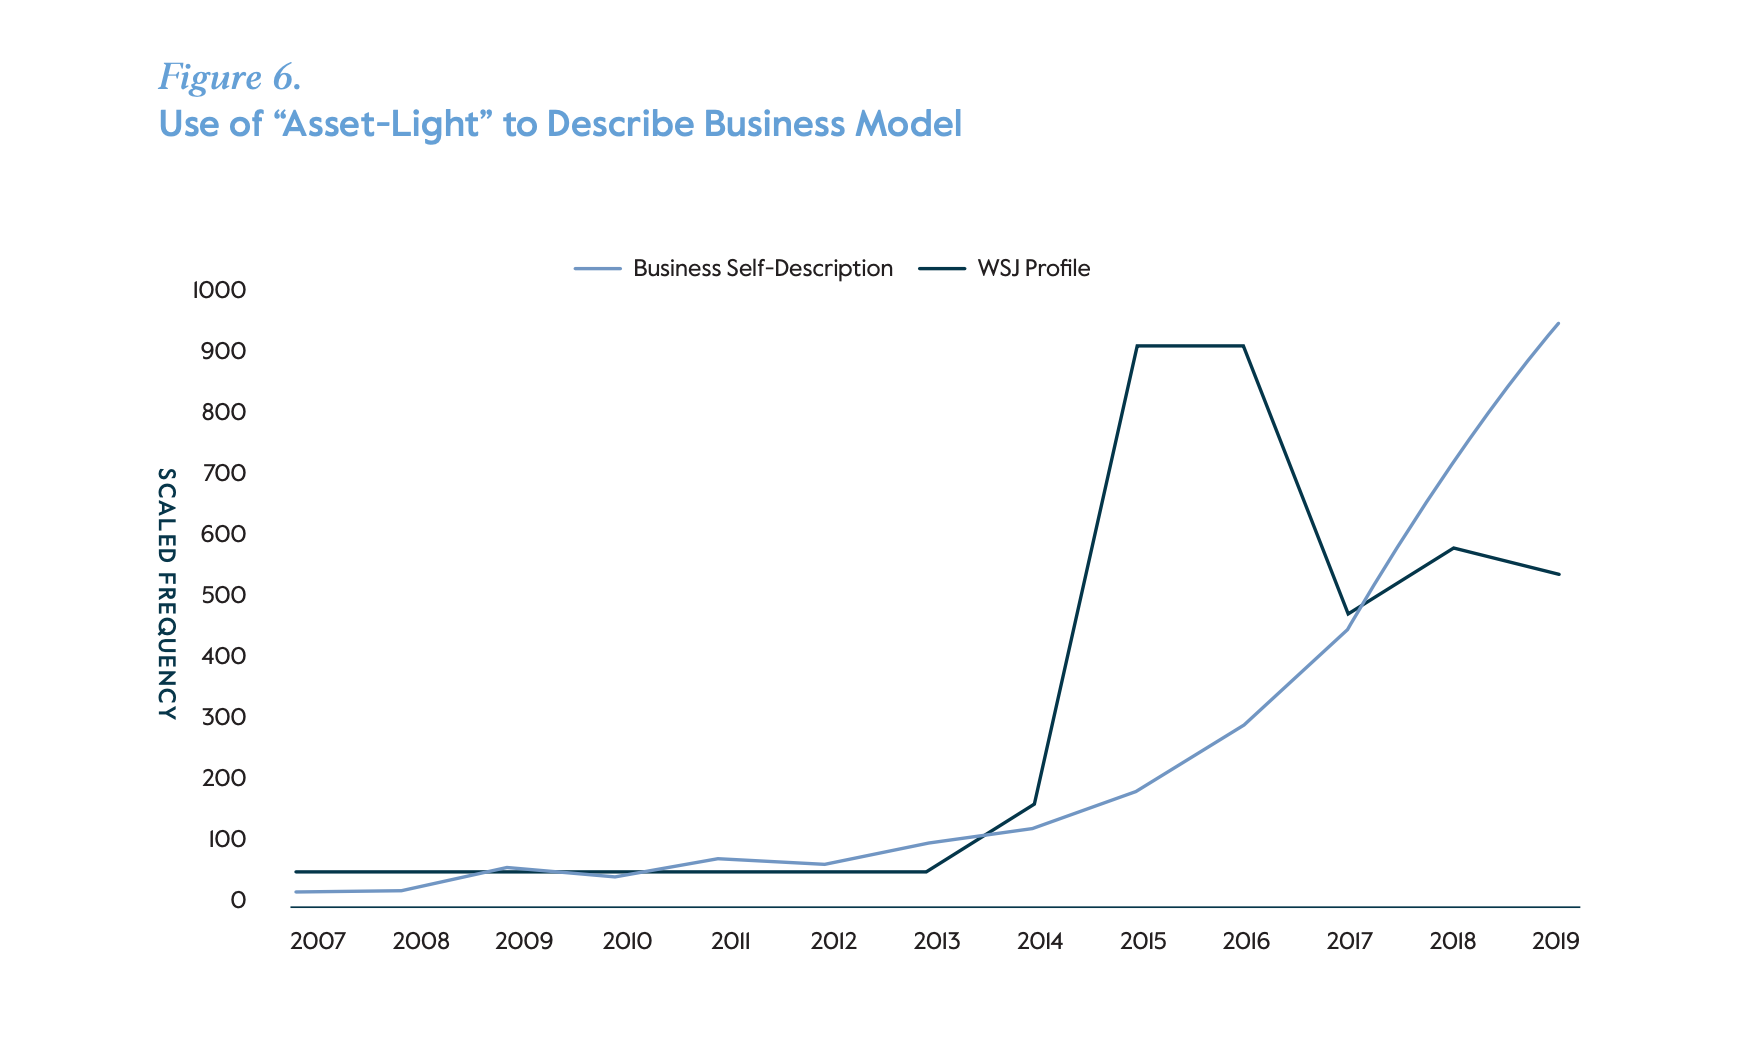
Suddenly, “size,” “footprint” and “incumbency” came to be understood as an expensive legacy rather than a competitive advantage. Investors wanted companies that were smarter instead of larger, as reflected in the new patois of sell-side flipbooks which now marketed businesses as “agile,” “disruptive,” “nimble” and – especially – “asset light”.
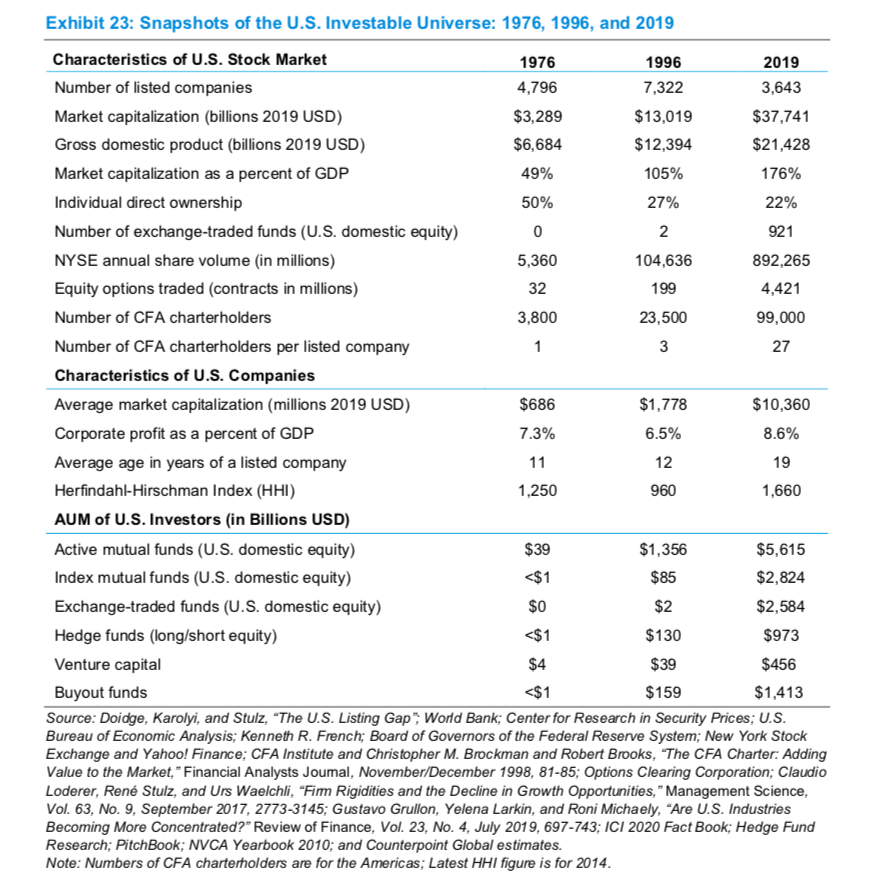
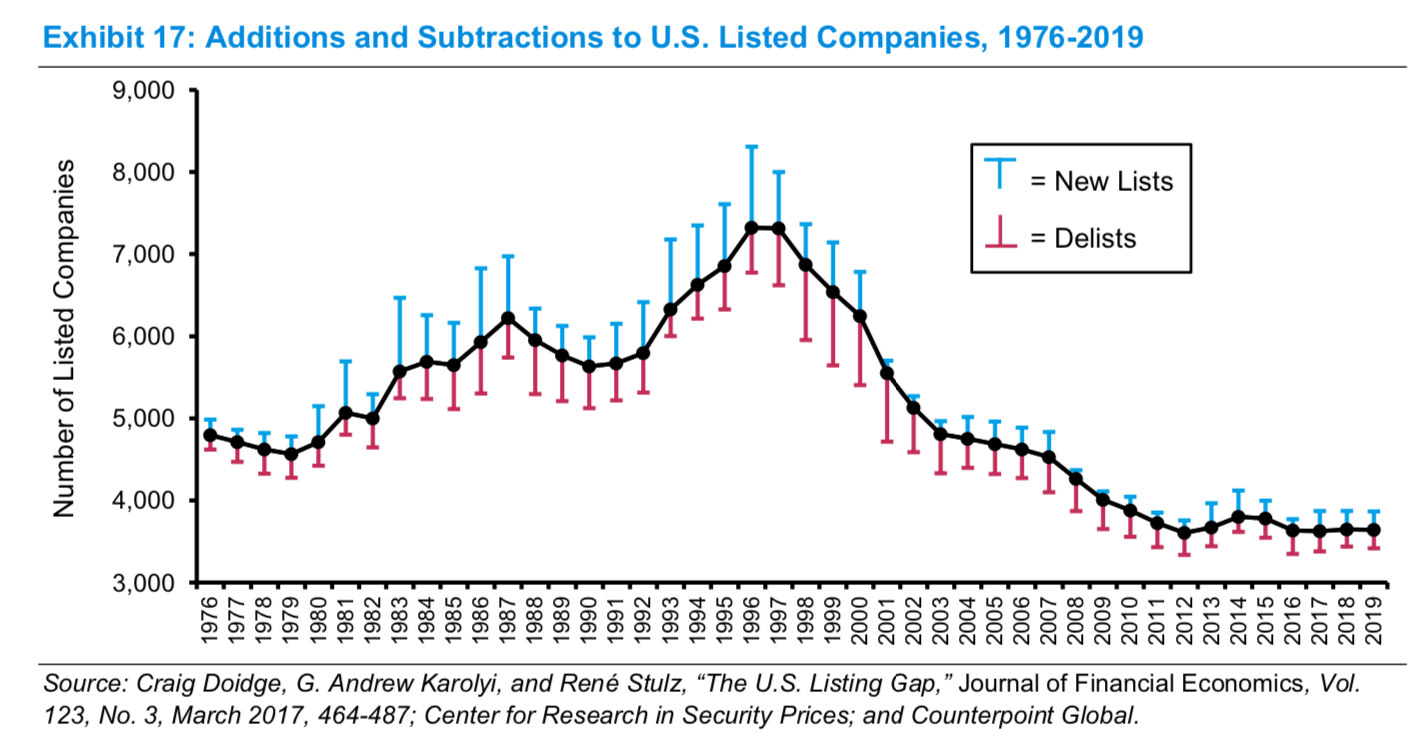
The number of publicly listed companies in the US has fallen since the mid-1990s.
This chart captures this decline in the total number of listed stocks, including additions and subtractions each year from 1976 to 2019.
“There are one-half as many public companies as there were in 1996 and three-quarters as many as there were in 1976. The Wilshire 5000 Total Market Index, launched in 1974 to reflect the complete U.S. equity market, had 3,473 stocks as of December 31, 2019.”
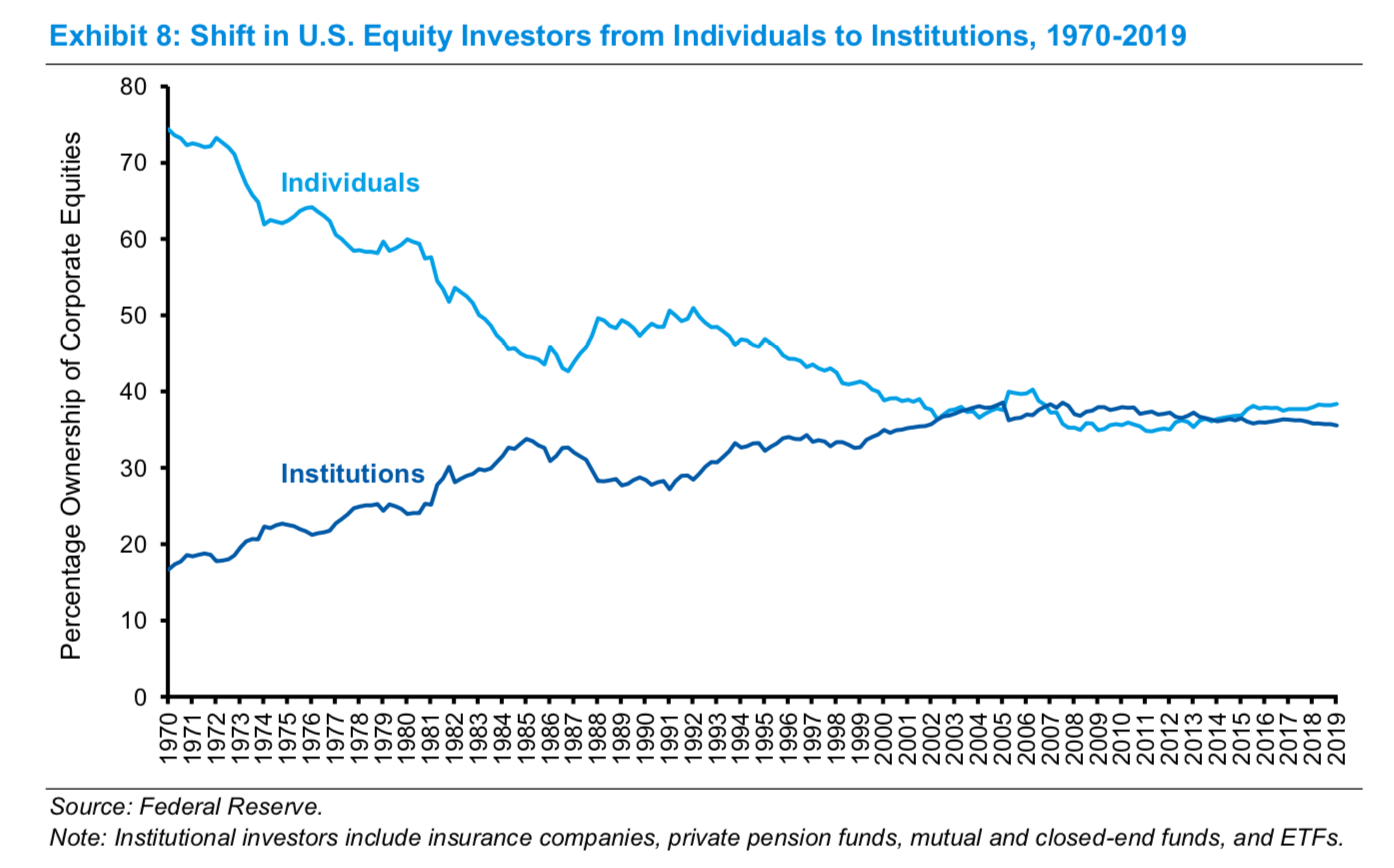
“Over the past quarter century there has been a marked shift in U.S. equities from public markets to private markets controlled by buyout and venture capital firms. This change has had reverberations for asset managers, investors, executives, and policy makers.“
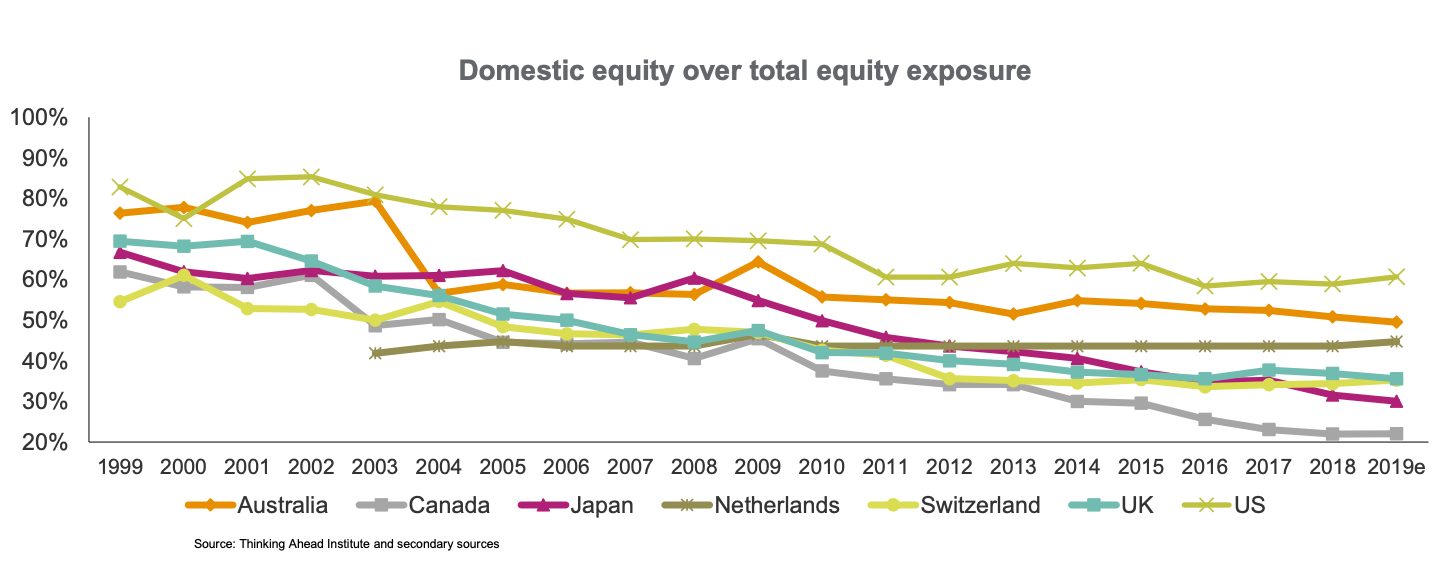
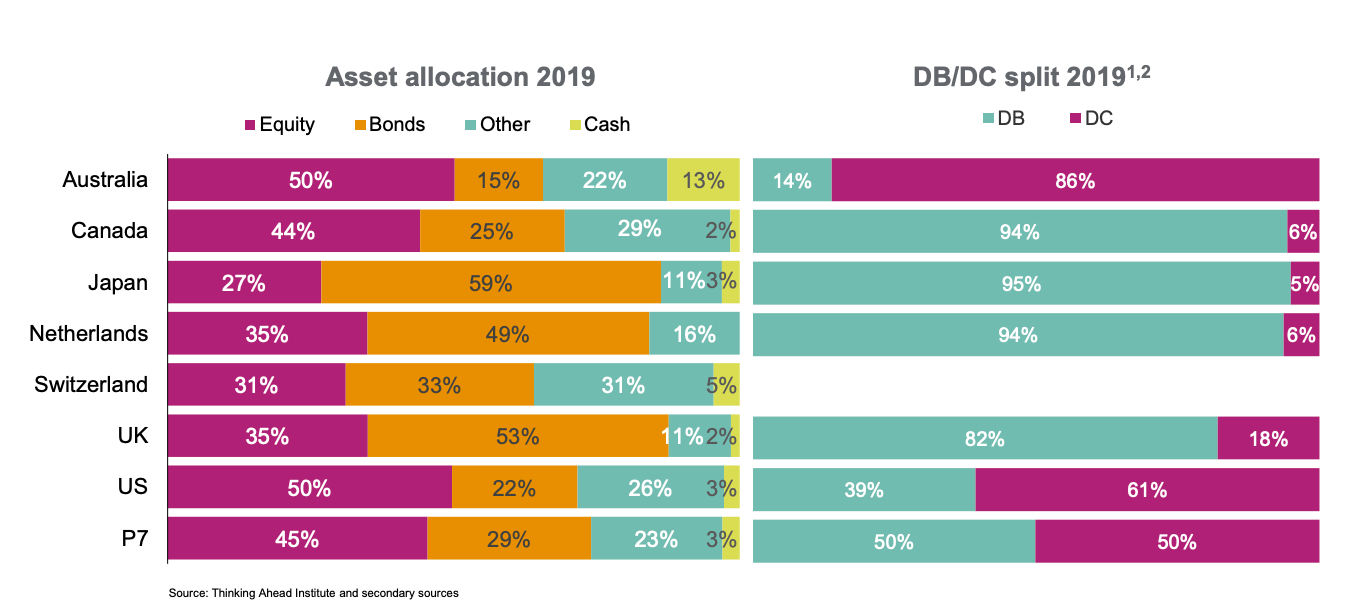
For Pensions – “There is a clear sign of a reduced home bias in equities, as the weight of domestic equities has fallen, on average, from 68.6% in 1999 to 39.7% in 2019.”
Interesting chart showing the asset allocation of pension fund assets and the split between defined contribution and defined benefit in different countries.
The UK really stands out.
For the top 7 countries (P7) the allocation to equities has been reduced dramatically in favour of “other assets” since 1999.
Defined contribution has also crossed 50% for the first time last year.
Alta Fox have done a massive analysis of all the best performing stocks over the last five years.
Overall – they find that financially healthy companies with advantageous business positioning tend to do better.
Acquisitions are a feature of these top performing stocks (perhaps because of the five year time frame).
The analysis is a bit too micro cap focussed and only concentrates on Australia, Europe and North America and excludes some sectors (e.g. materials), but is nonetheless useful.