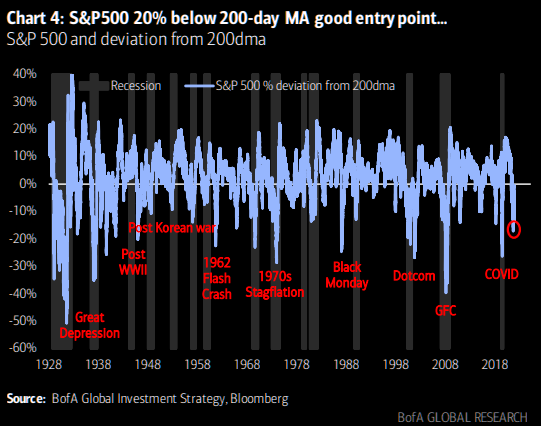
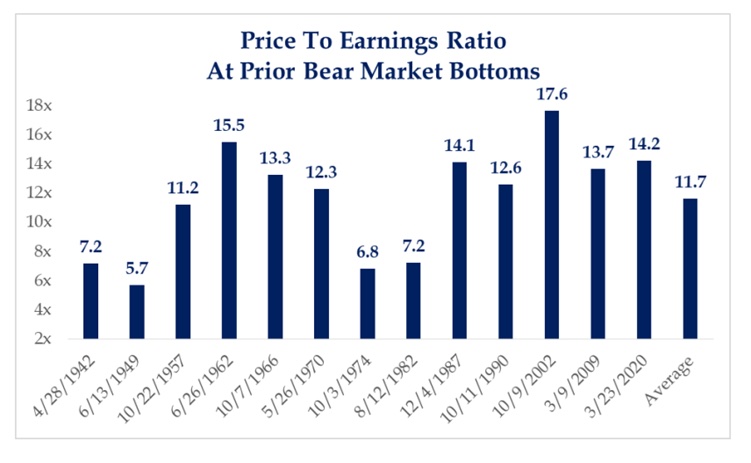
“His reasoning regarding the oversold entry level is basically buying some 20% below the 200 day moving average: currently at 3374. This has worked over the past century (except 1931/37/74 and 2008). He adds: “…monster undershoot requires monster credit event & recession”.”
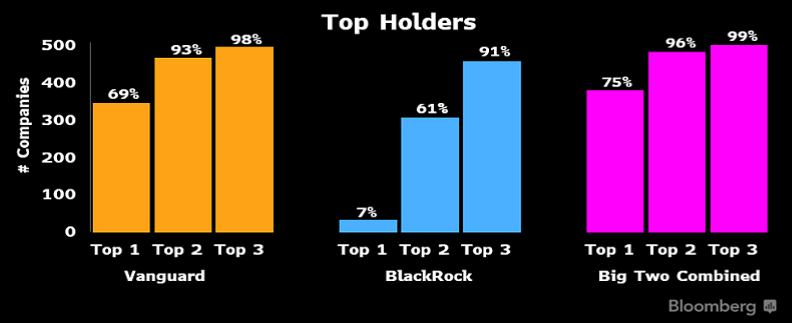
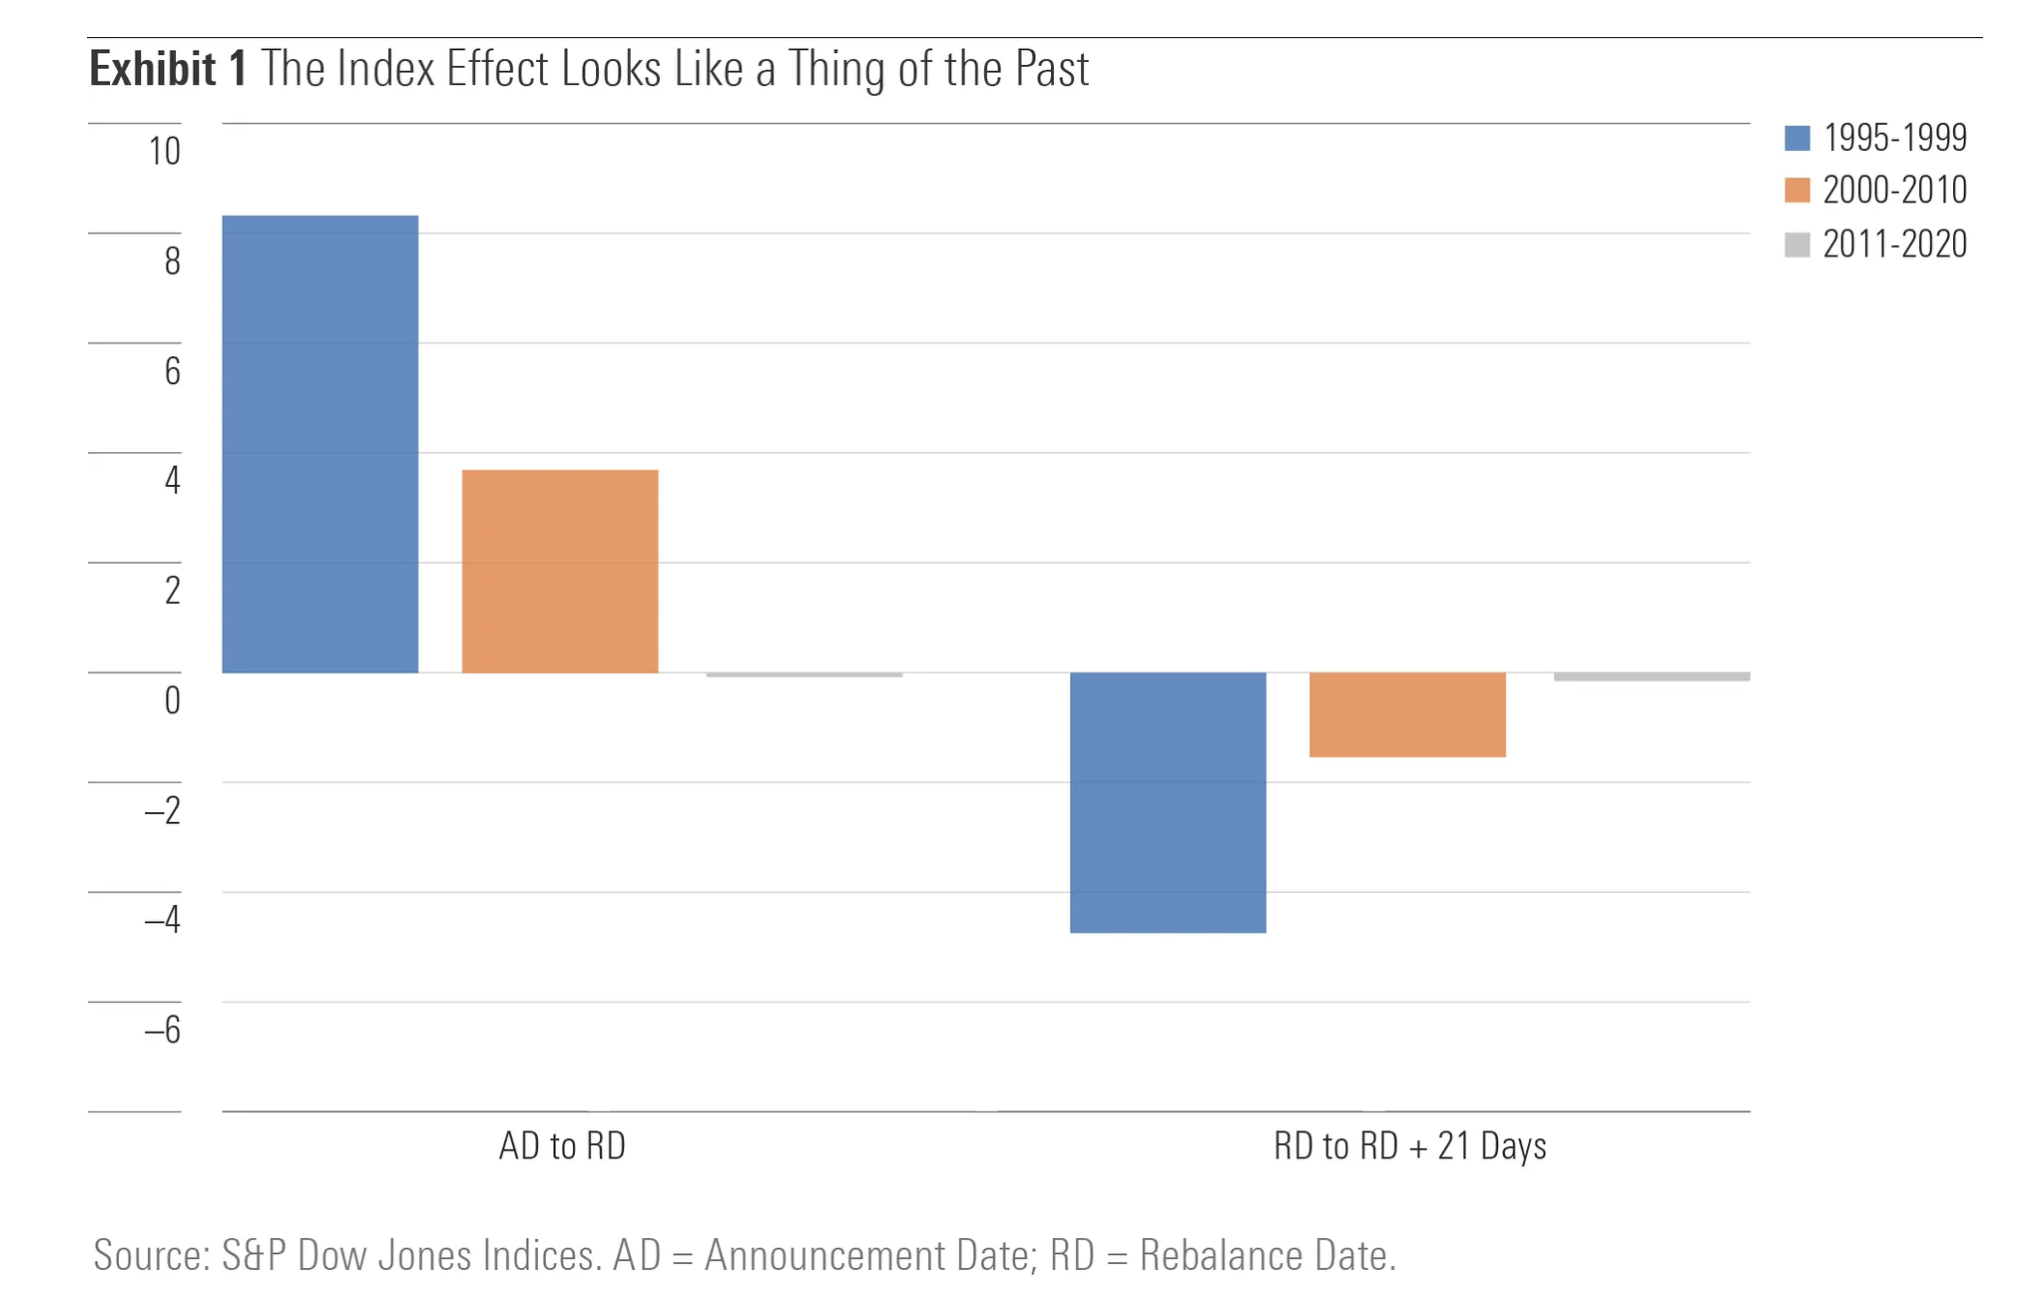
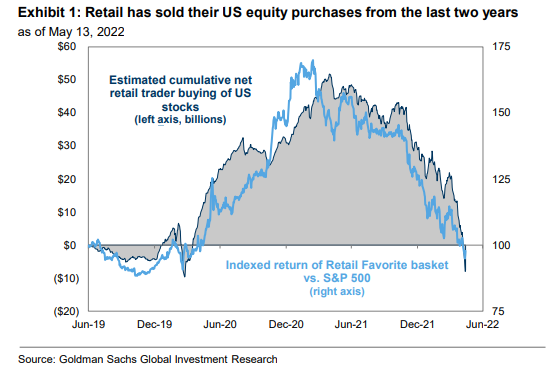
According to Morningstar data, inclusion into an index no longer attracts the usual rise (on announcement) and then fall in stock price.
“Indeed, the up-and-down trajectory that was once the fingerprint of the index inclusion effect now resembles a flat line that runs from announcement date through the weeks following inclusion in the S&P 500.“
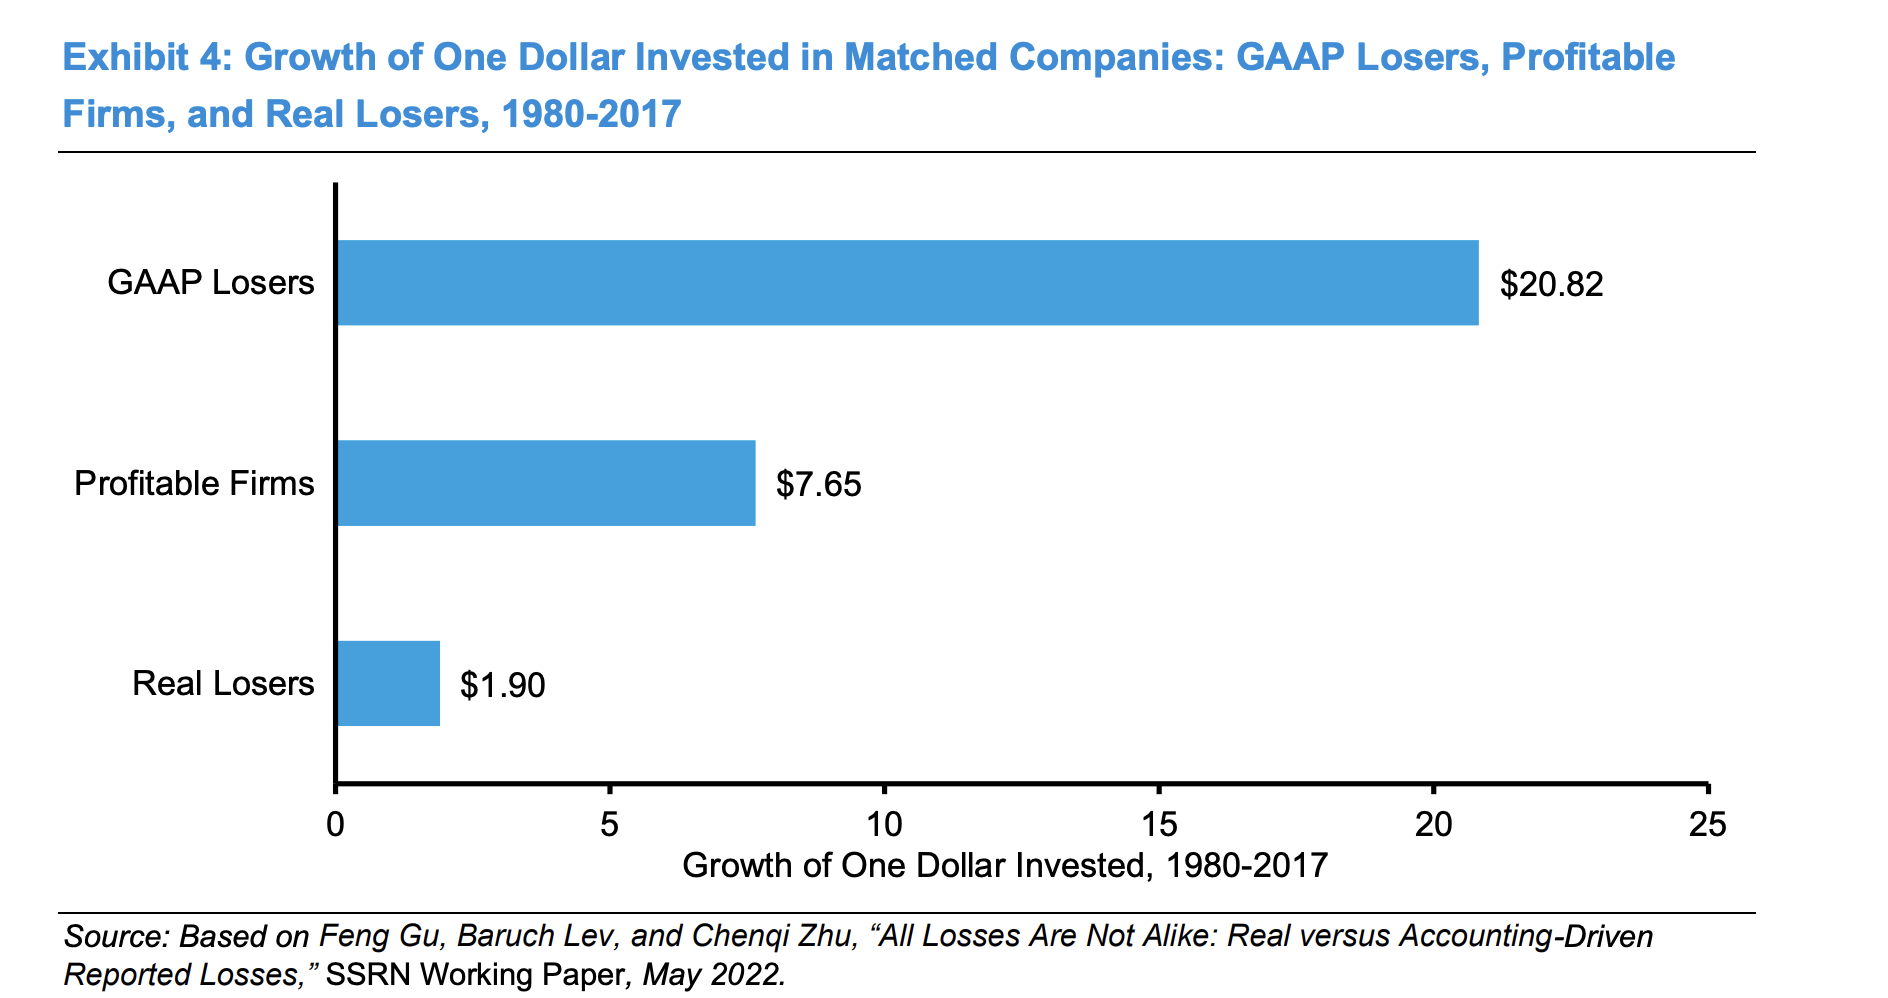
This chart shows the performance of three groups of firms.
GAAP losers – firms where expenses exceed sales, but once an intangible investment adjustment is made they turn profitable. In other words they are investing.
Real losers – these are firms that even after the adjustment is made are still loss making.
Profitable firms – at the outset these firms are profitable i.e. sales exceed all expenses.
From 1980 – 2017, GAAP losers substantially outperformed
NB the outperformance vs. profitable firms really shows up post 1996. “The message is that the market ultimately recognizes and pays for intangible investments that create value, even if they create losses in the short term.“
This chart comes via Investment Talk, a brilliant curation of all manner of investment resources.
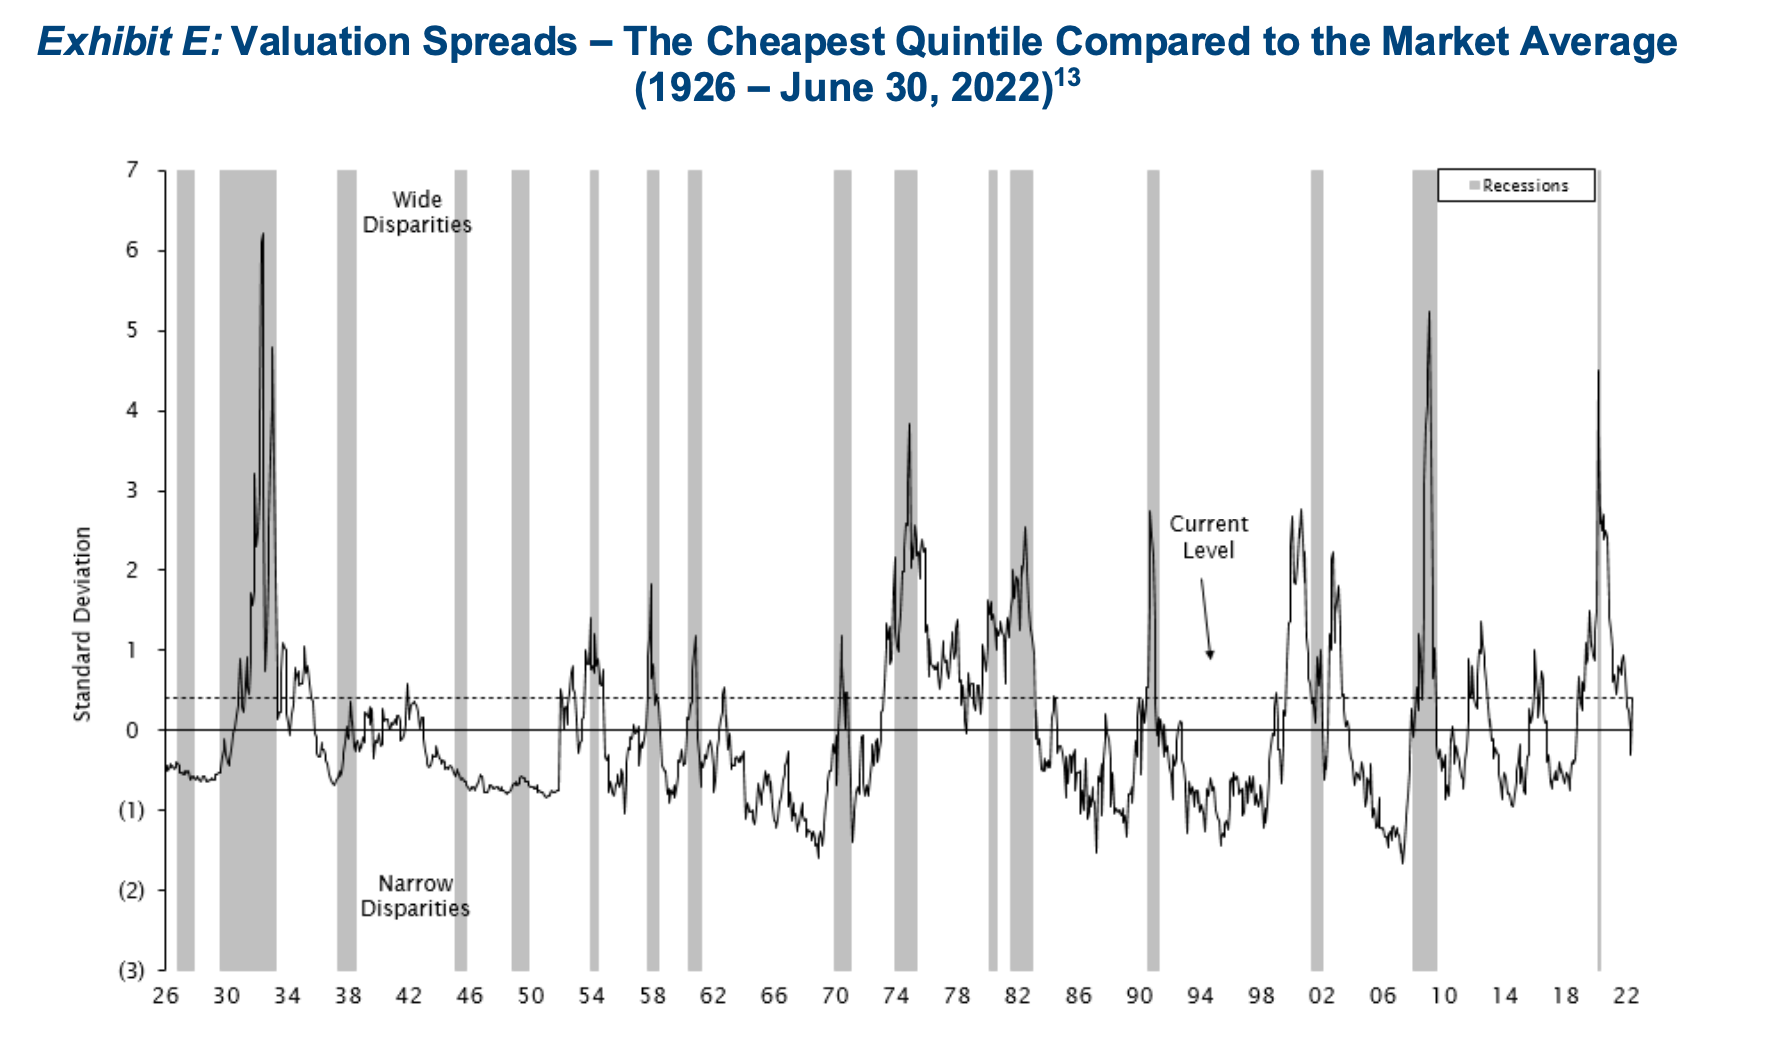
Footnote: Empirical Research Analysis, National Bureau of Economic Research. As of June 30, 2022. Cheapest quintile refers to the most undervalued 20% of stocks in an analysis of large-capitalization US stocks. Standard Deviation is a measure of dispersion of a data set from its mean. Prior to 1952, the spread is measured using the price-to-book data of the largest 1,500 stocks. Current Level refers to the valuation spread as of June 30, 2022 which is 0.4 standard deviations above the mean.
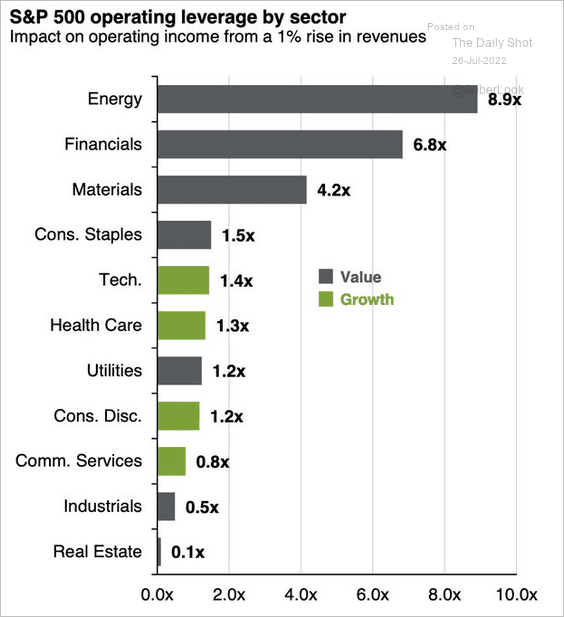
“Despite record 1Q 2022 results and continued capital discipline, the disconnect between the energy sector weighting in the MSCI Wold Index relative to the oil market value is at its widest level since 2000“.
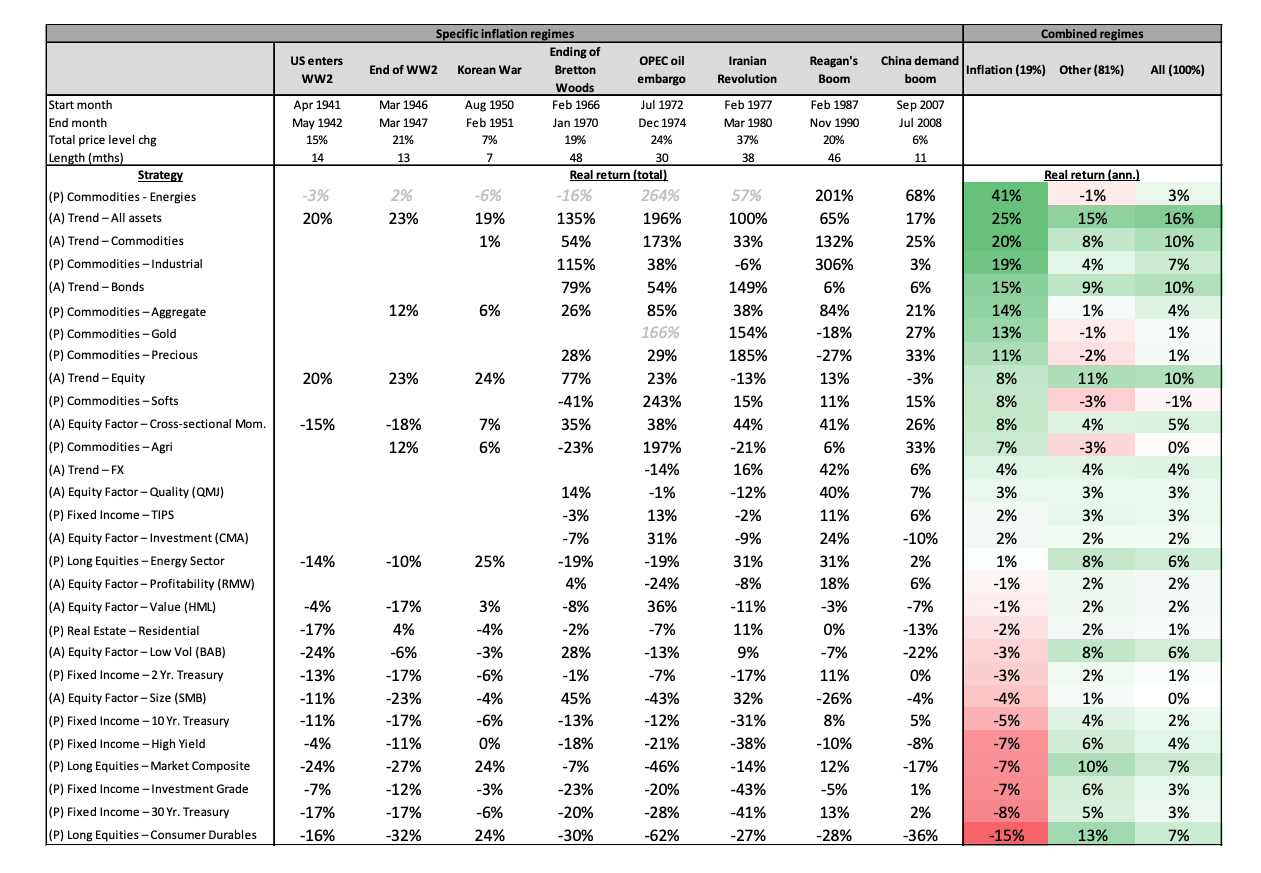
Most investors, including me, have limited experience of inflationary risk.
This paper, from 2021, is an excellent guide – looking at passive/active strategies across asset classes over the past 95 years.
As we have seen it is tough – unexpected inflation is bad for traditional assets (bonds, equities). Commodities do well but depends which ones. Trend following and active equity are the best protection.