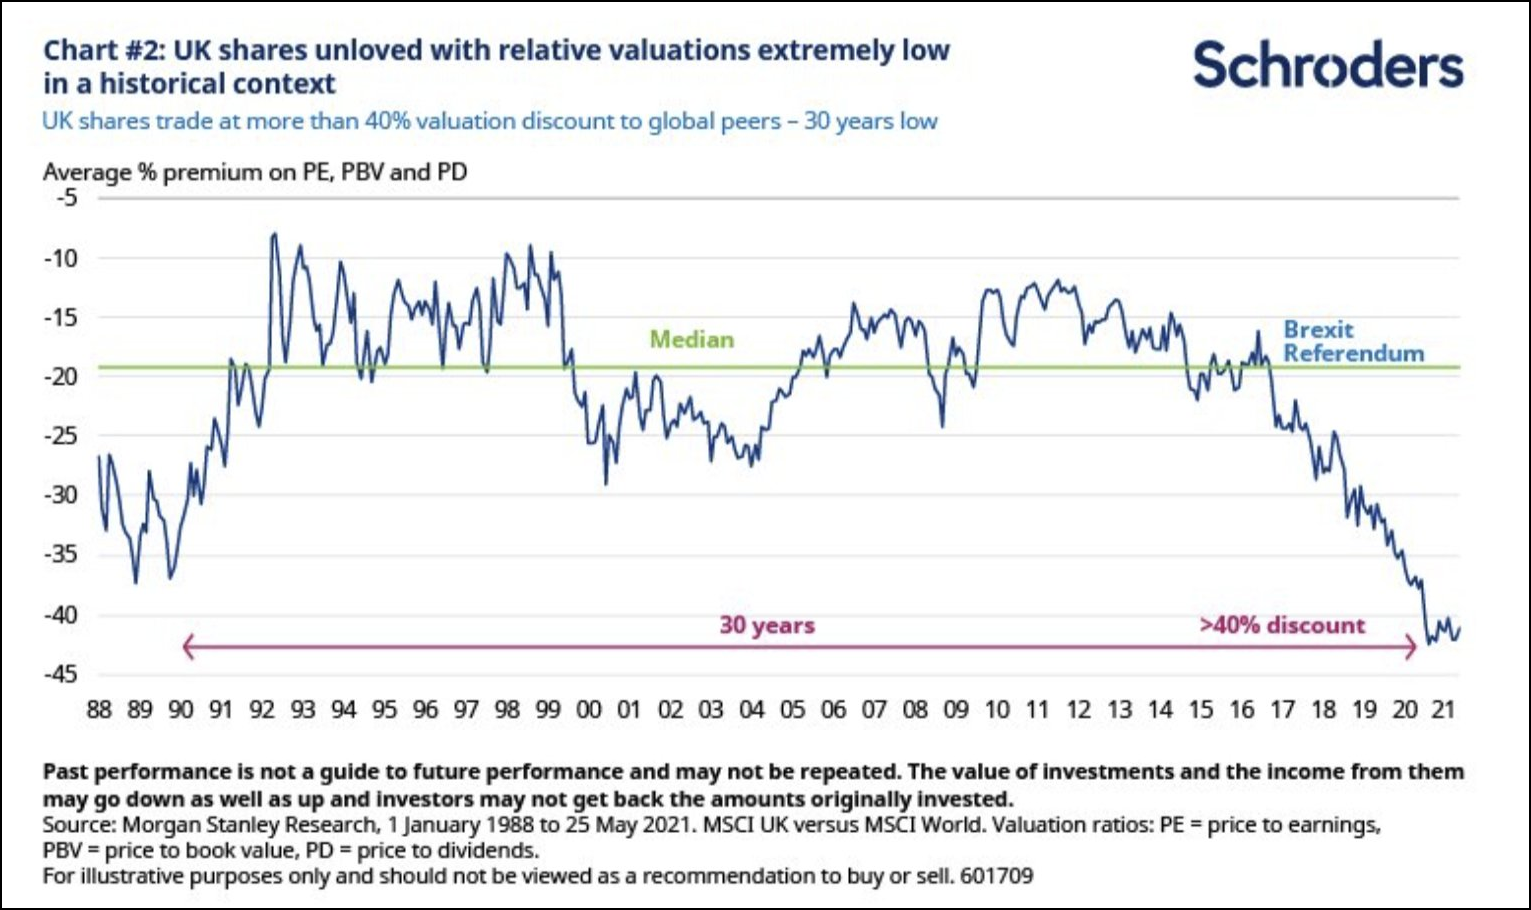
Mergers and acquisitions (M&A) activity has spiked to 12% of market cap in the UK, double the global average.
This is driven by cheapness of UK listed firms, stabilisation post Brexit, and record private equity dry powder.
Interestingly this spike is driven by a larger number of deals (25) when compared to the previous spike in 2015 (where mega deals for SAB Miller and BG Group dominated).
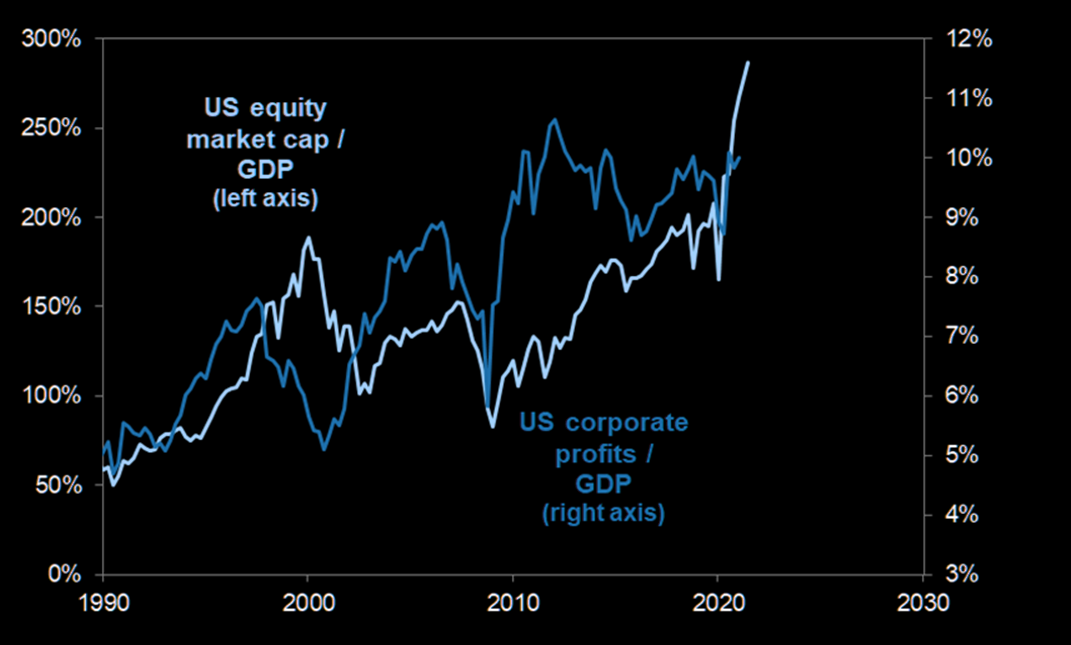
It is well documented that the Warren Buffett indicator, which measures equity market cap as a ratio of GDP, is at an all time high, surpassing the dotcom boom.
It is less well documented that the ratio of profits to GDP is also strong and has been trending up.
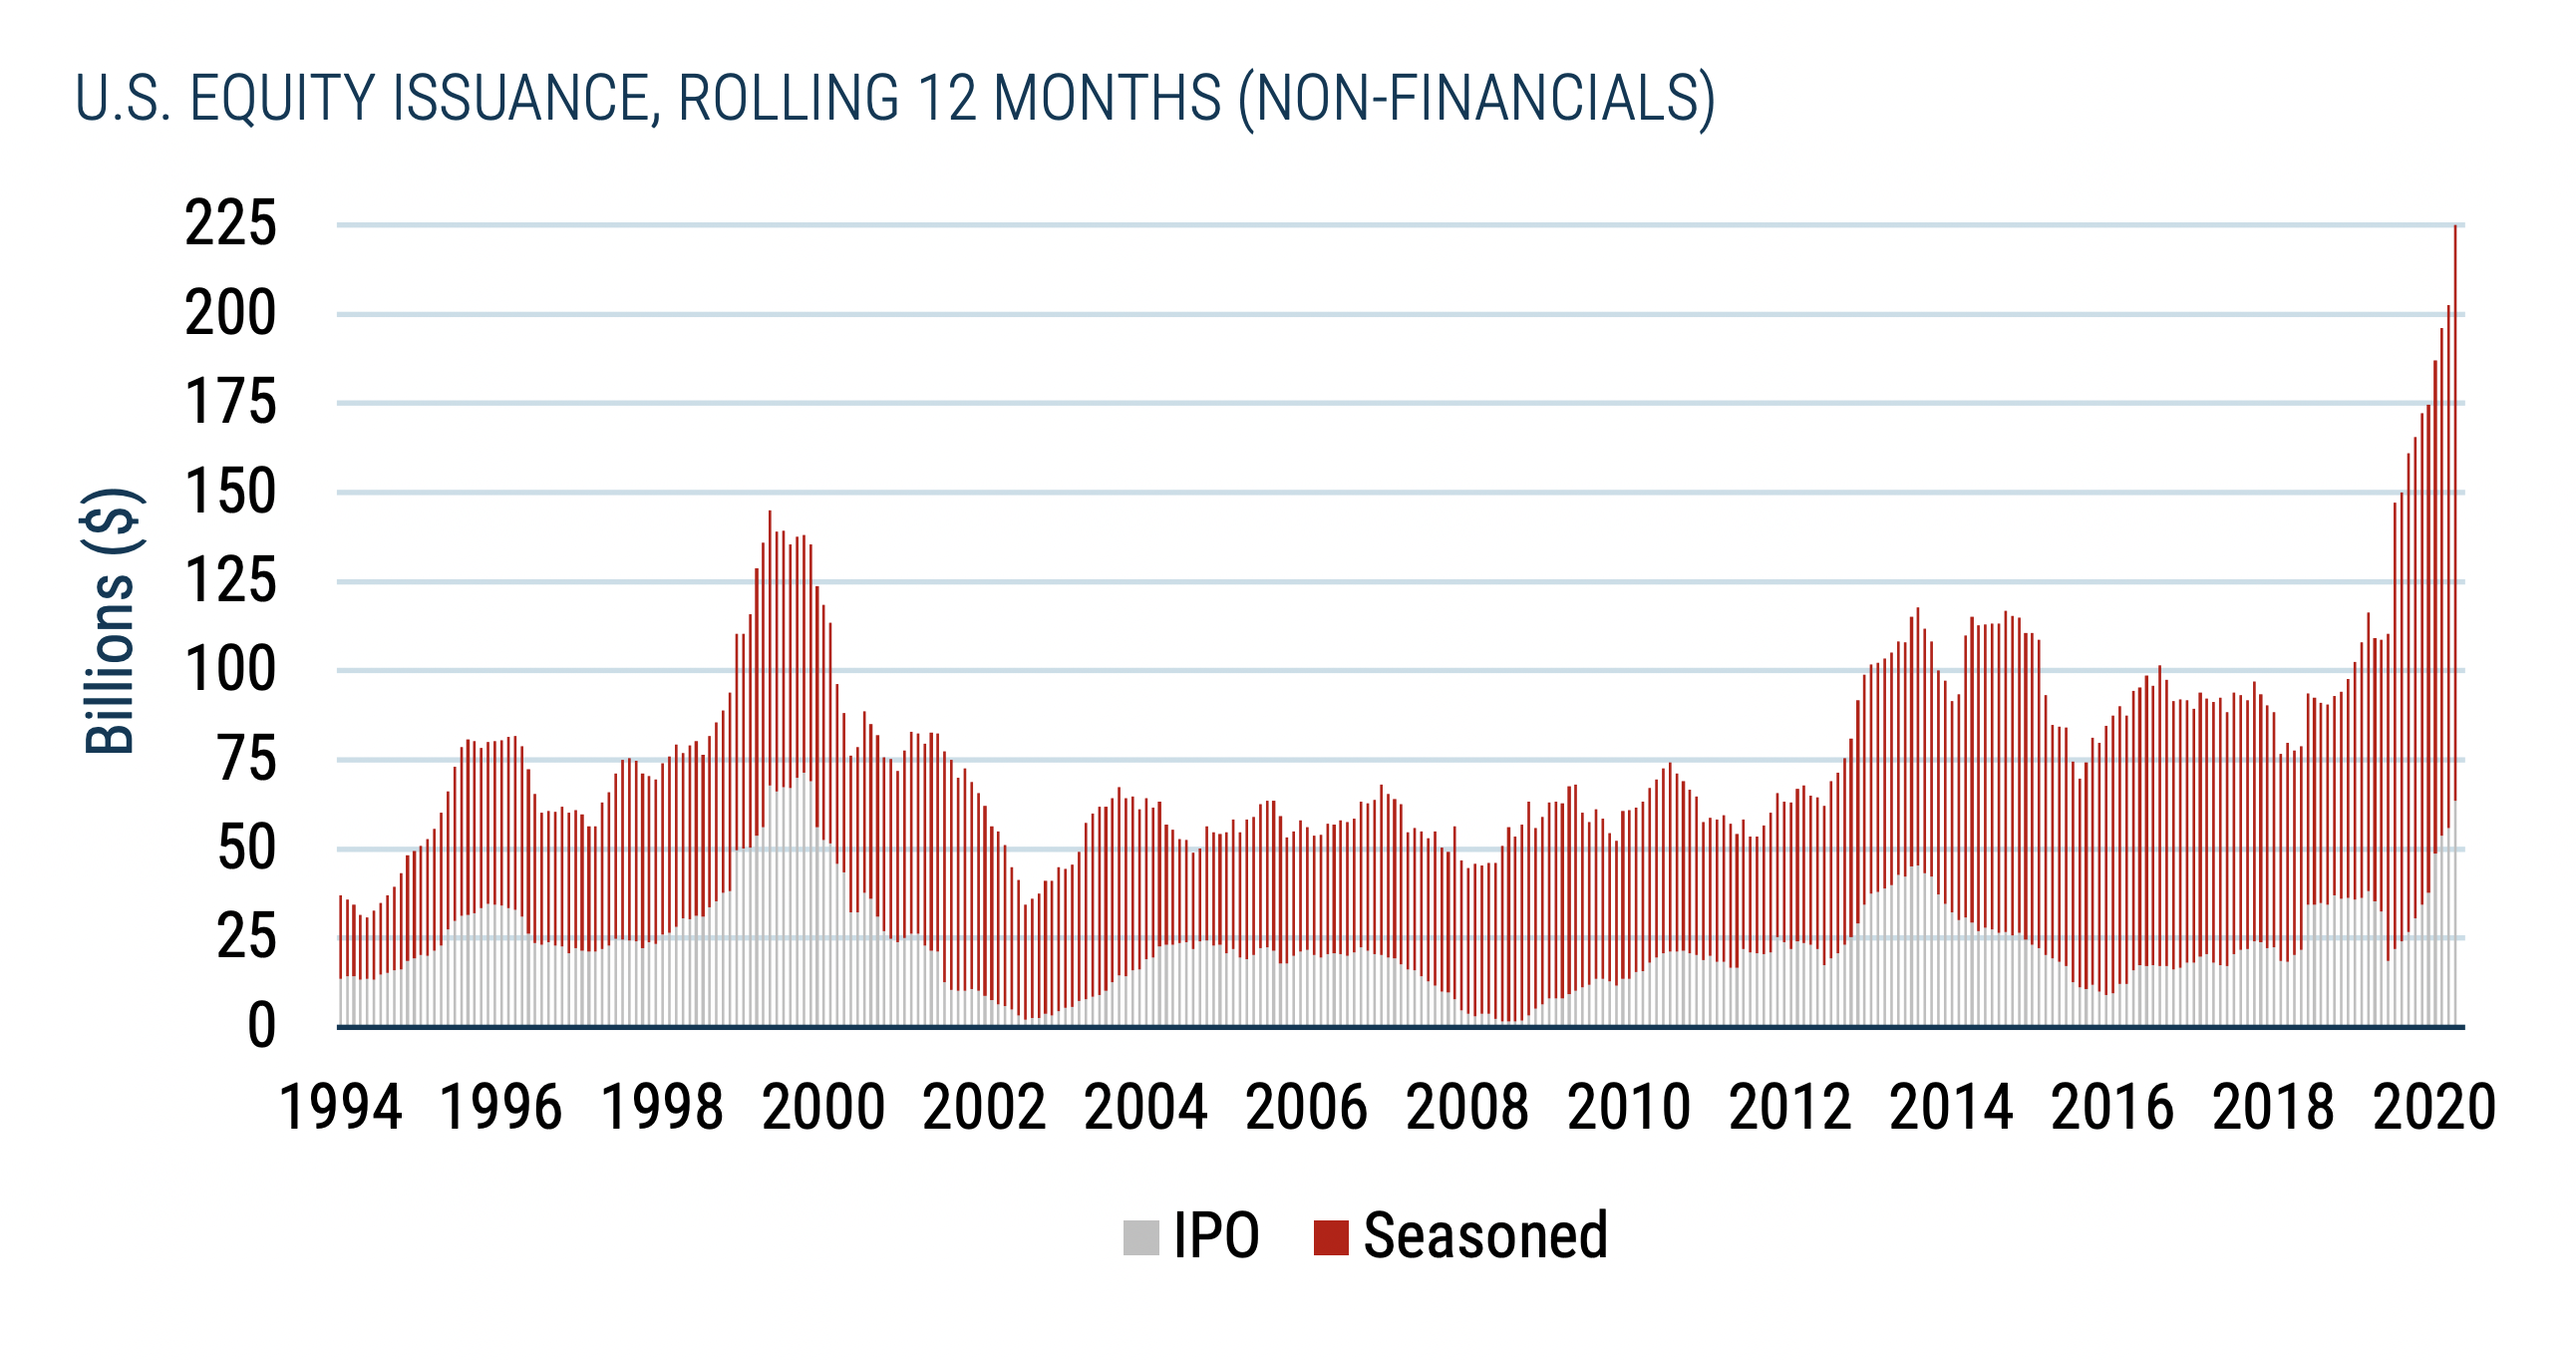
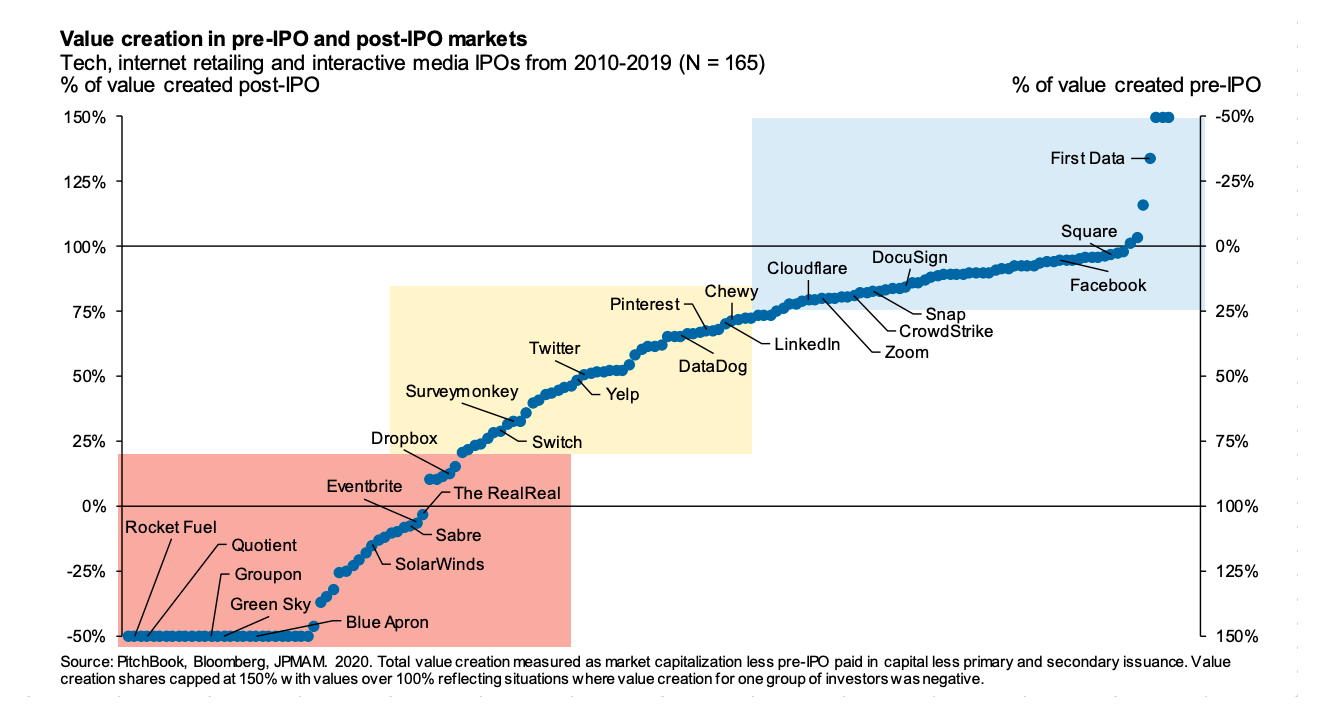
Who reaps the majority of the rewards from venture backed companies – VC or public markets?
“Over the last decade when measured in terms of total dollars of value creation accruing to pre- and post-IPO investors: post-IPO investor gains have often been substantial.“
Of the 165 IPOs analysed – the vast majority had a large share of value accrue to public markets (blue region).
There are some exceptions (red region), and some shared (yellow region).
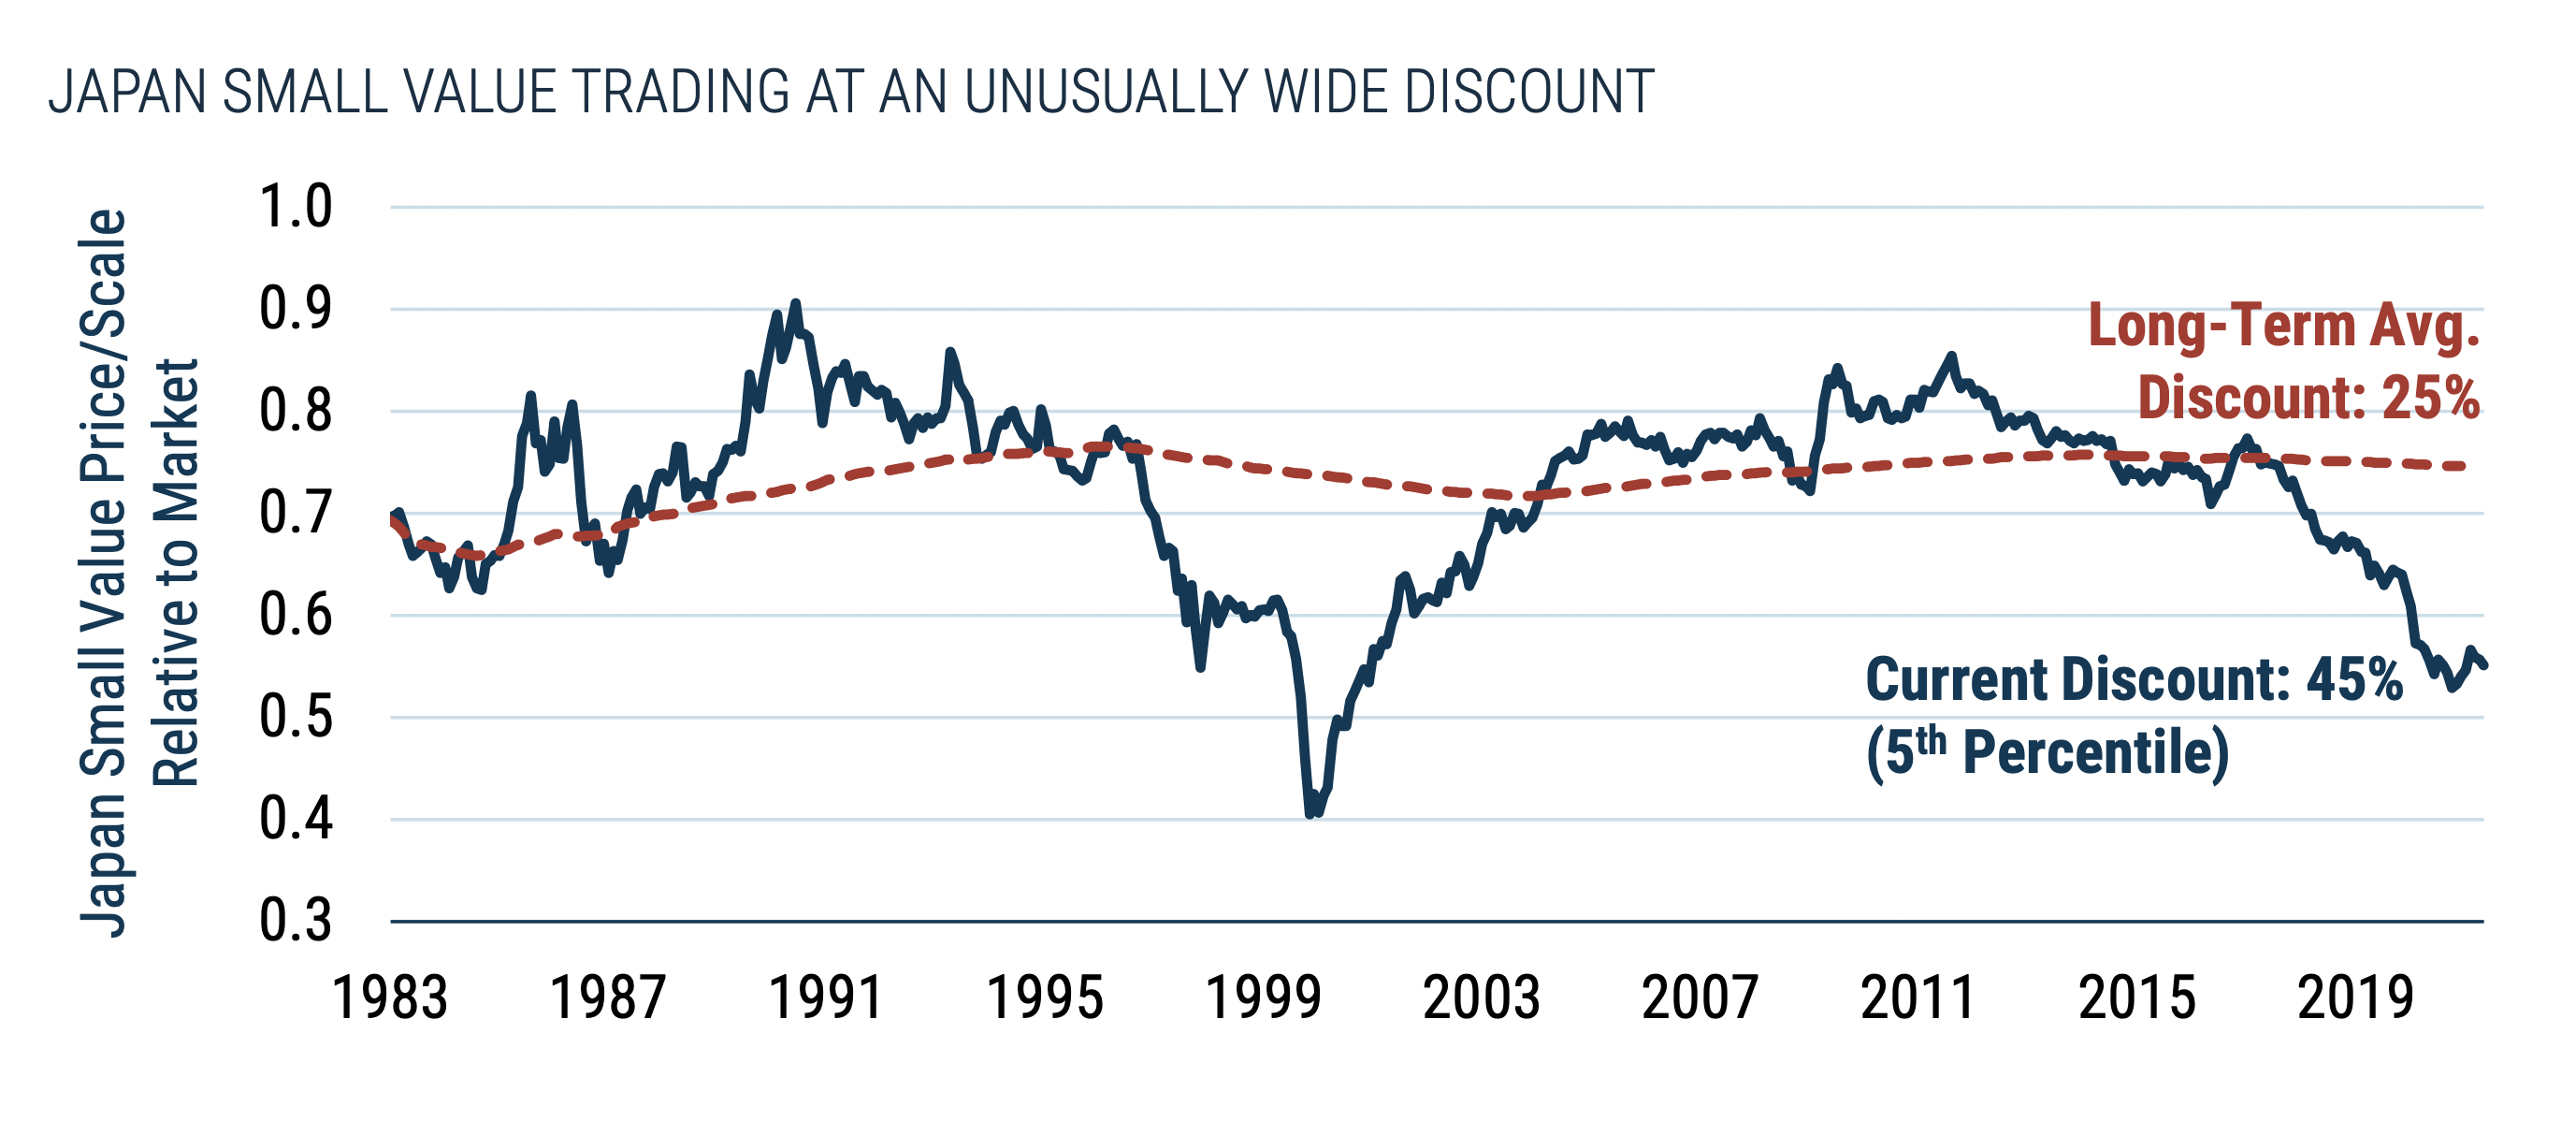
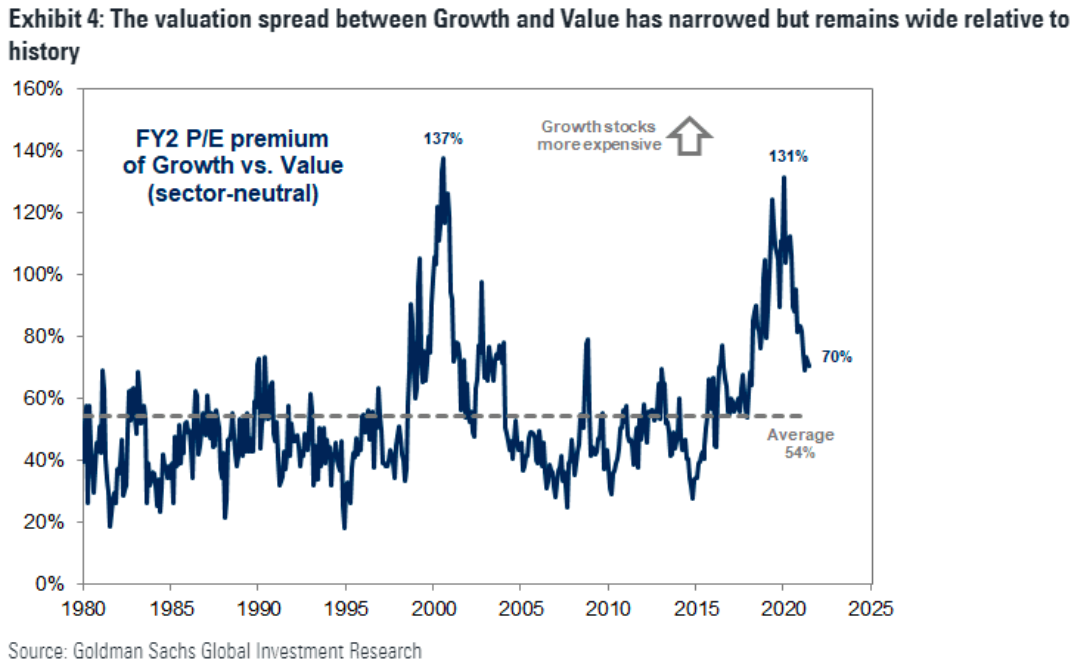
Interesting latest piece (page 15) from Hosking Partners on why the rotation into value stocks will persist.
(1) They perform well at the end of recessions (2) stimulus favours value (3) Covid recovery will be long and is only getting underway now in some countries (4) fund managers are entrenched (5) Interesting ESG angle.
There is also a full webcast that is worth listening to.
This is a useful paper on a new metric – the market expected return on investment – that aims to give a more accurate view of returns in a world increasingly dominated by intangible assets.