STR data for 26 April through 2 May 2020 showed slightly higher U.S. hotel occupancy compared with previous weeks.
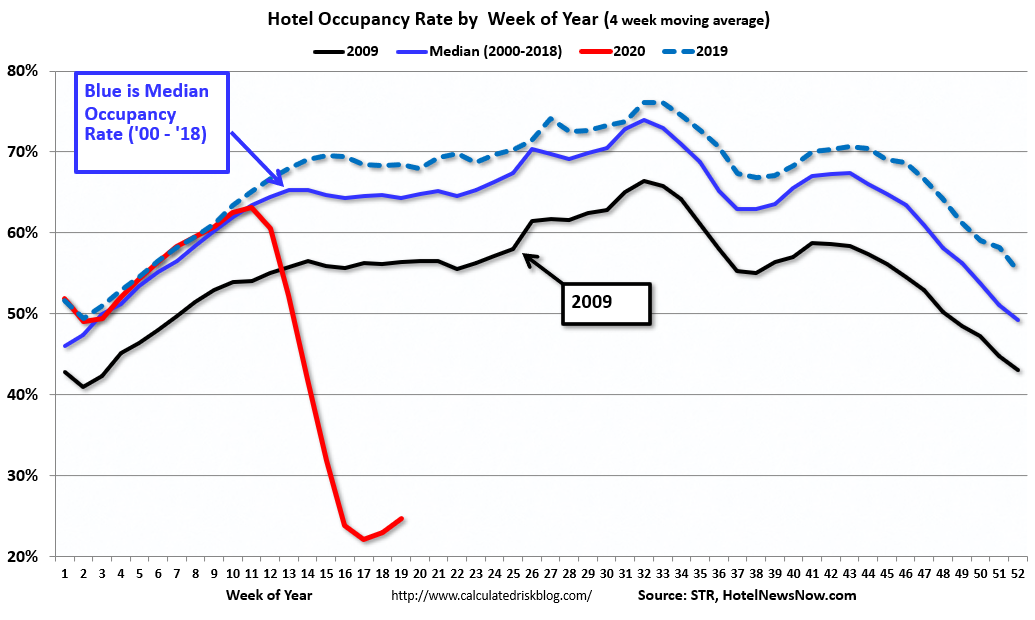
The black line in the chart is 2009 – the worst year for hotels since the Great Depression.
“Week-to-week comparisons showed a third consecutive increase in room demand, which provides further hope that early-April was the performance bottom,”
TSA (Transport Security Administration) numbers have indeed ticked up and are at the highest level since March 30th.
“At the same time, this past week was the first to show solid evidence of leisure demand as weekend occupancy grew in states that have significantly eased mitigation efforts.”