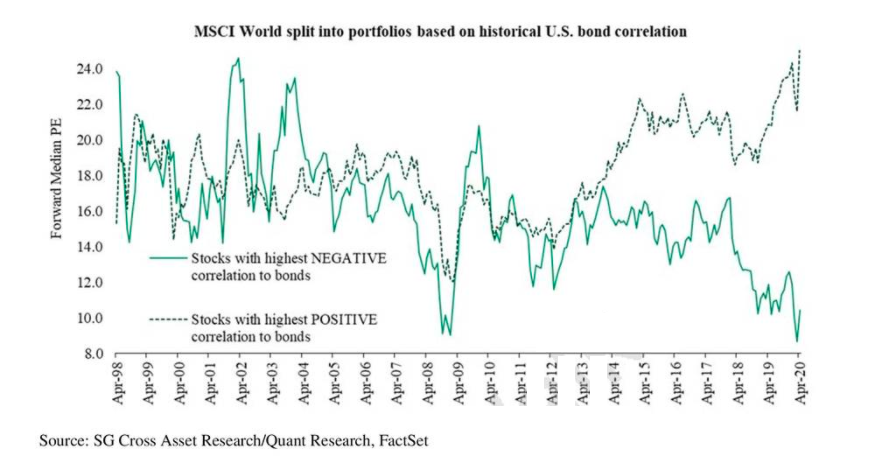
- Interesting chart from SG via Einhorn’s Q1 Letter.
- It shows the median forward P/E ratio of MSCI World Stocks split into two groups.
- The first (dotted line) are stocks with the highest positive correlation to bonds. These trade on 24x.
- The second (green line) are stocks with the highest negative correlation to bonds. These trade at 10x.
Valuation Chart