- Yesterday we showed how the concentration of the top five stocks in the S&P 500 index is back to highs.
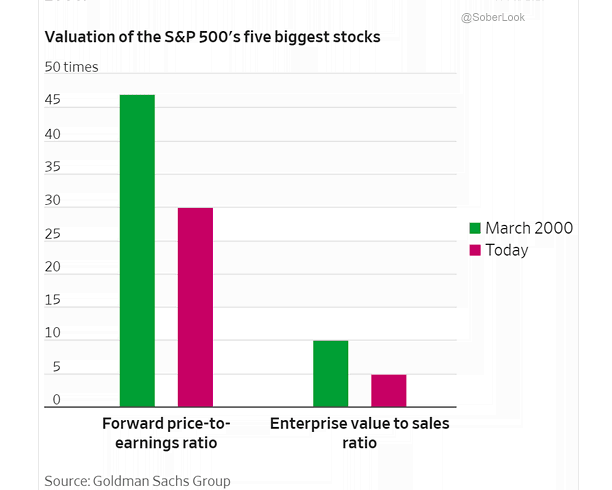
- This chart looks at the valuation of the top five today compared to March 2000 (the last record).
- Suggests that the multiples are a lot more acceptable.
Valuation of Top 5