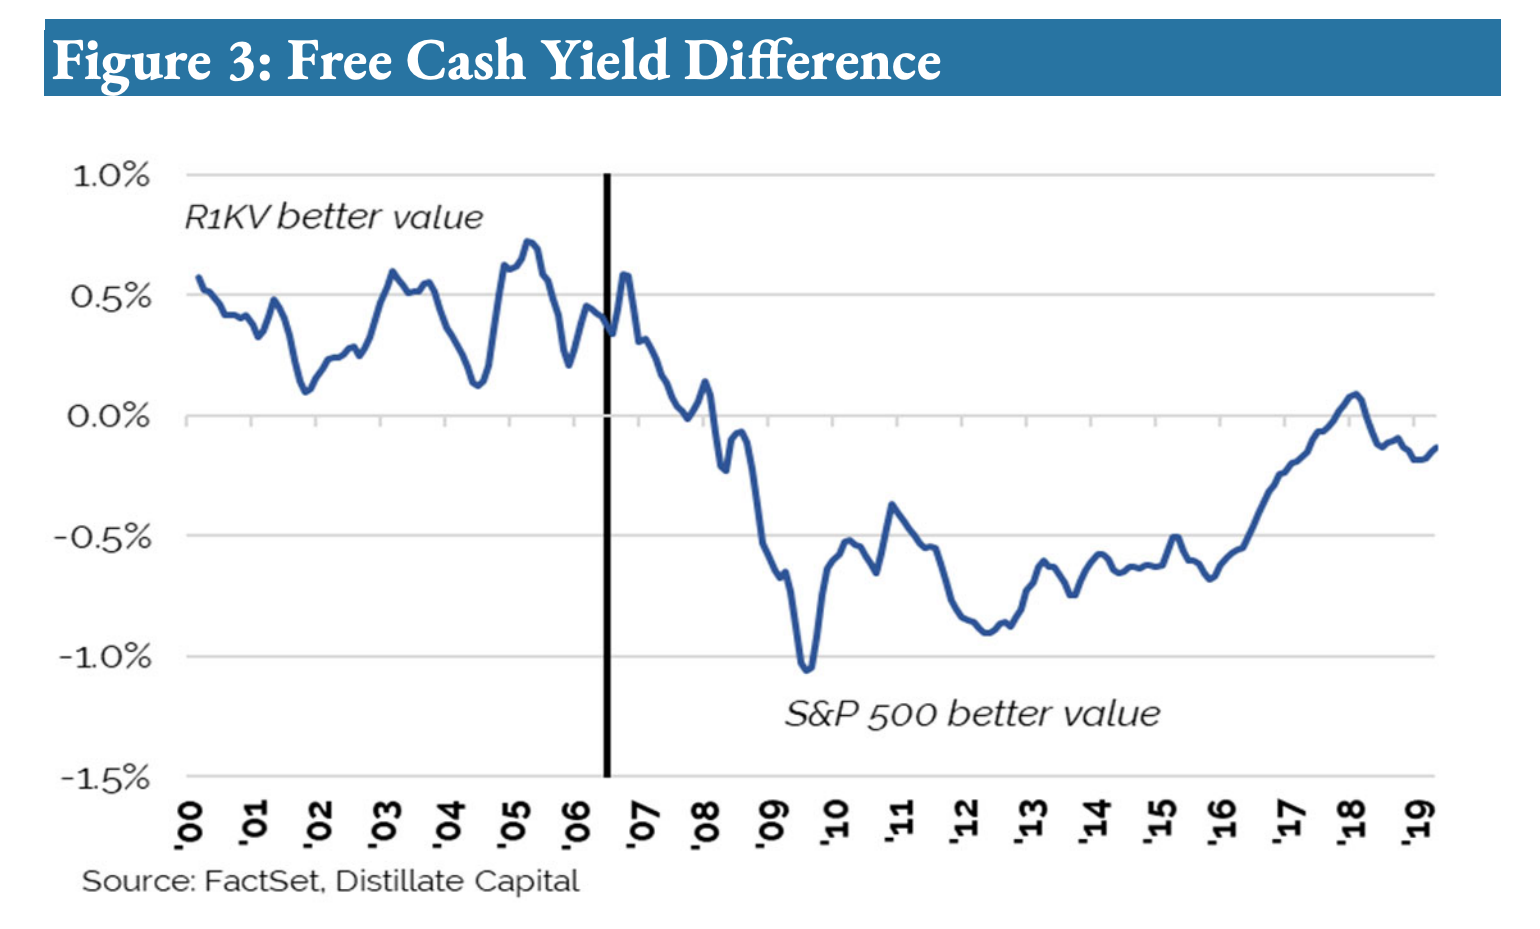
- Interesting chart that suggests that the underperformance of value investing since 2006 is down to valuation.
- The reason is that the valuation metric to look at is free cash flow yield to enterprise yield and not P/B or P/E.
- On this metric the Russel Value Index has been expensive since 2007.
- This is partly because in 1985 68% of the market value of the S&P 500 was tangible assets, today that number is 16%.
Value Investing