“In 2021, the journal Nature declared arXiv one of the “10 computer codes that transformed science,” praising its role in fostering scientific collaboration.“
Interview with the founder of this site that now hosts 2.6m papers and has 5m active users.
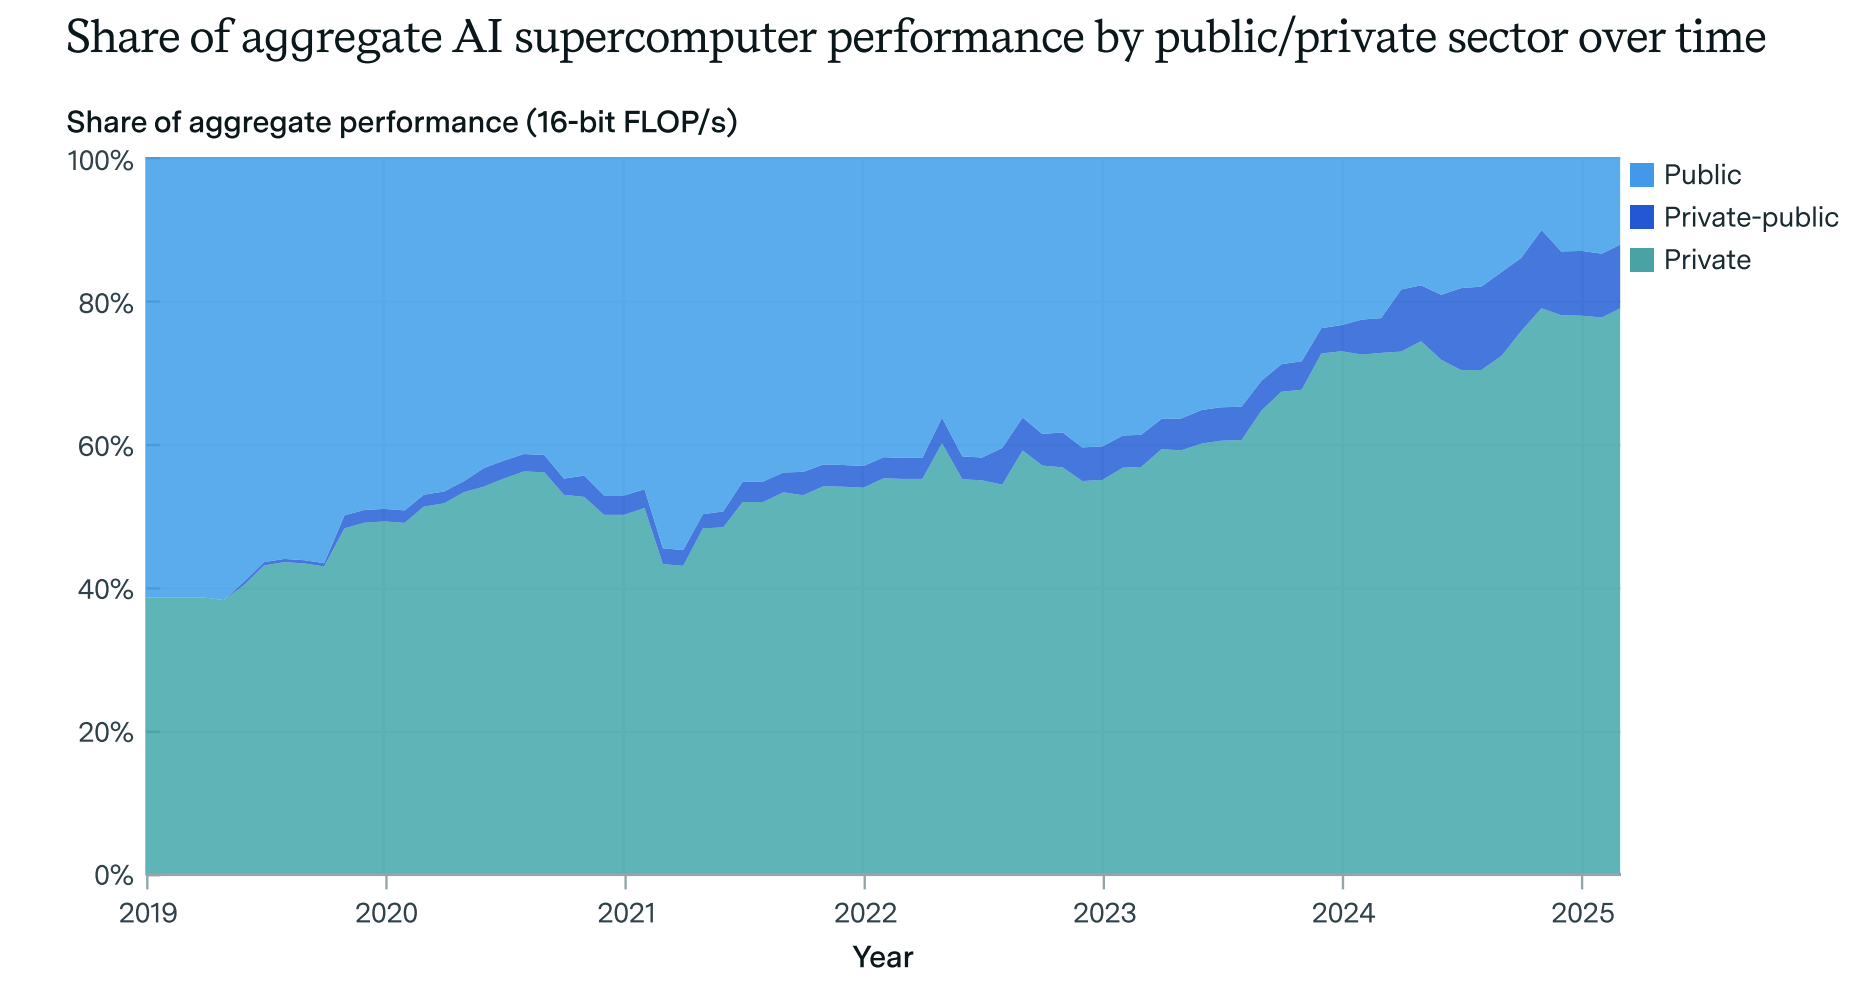
“The computational performance of leading AI supercomputers has doubled every 9 months“.
“Power requirements and hardware costs of leading AI supercomputers have doubled every year.“
“If the observed trends continue, the leading AI supercomputer in June 2030 will need 2 million AI chips, have a hardware cost of $200 billion, and require 9 GW of power.“
“We find that the share of private sector compute rapidly increased from less than 40% in 2019 to about 80% in 2025.” (see chart).
Exhibits are uploaded daily giving unparalleled insights into the inner workings of the company.
From Ben Evans – “There’s a lot of email on the daily struggles of running social networks (people worrying that US growth is slowing (2022), or that WhatsApp is overtaking Messenger (2013), and I didn’t know that Meta tracks consumer sentiment towards Meta the company. There also a few tantalising ideas – a project for a paid, premium version of Facebook from 2020, for example. And there are charts of how the ad load has doubled. But really, what you see across all of these documents is a relentless focus from the top on making the current thing work better while worrying about the next thing.“
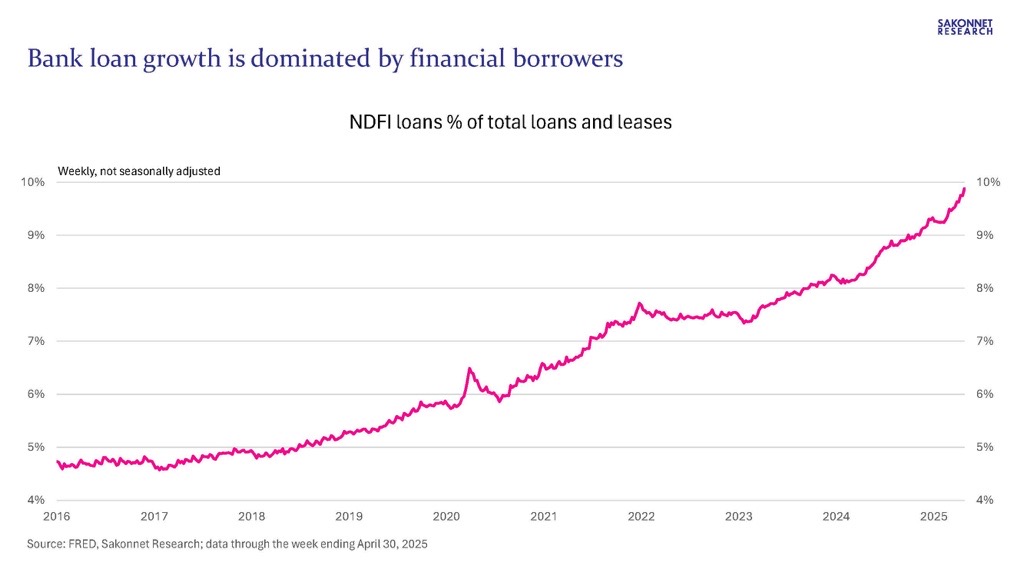
Bank lending to nondepository financial institutions (NDFIs) is booming.
What’s going on? The financialization of the U.S. economy; banks are lending ever more money to broker-dealers, hedge funds, private equity/credit firms, securitization vehicles, etc., all part of the levered investment industry.
“The number of homes actively for sale remains on a strong upward trajectory, now 30.6% higher than this time last year. This represents the 79th consecutive week of annual gains in inventory. There were more than 1 million homes for sale last week, the highest inventory level since December 2019.“
“So if you look at just traffic from Google, 10 years ago, for every 2 pages, Google crawled, they send you 1 visitor. 6 months ago, that was up to 6:1. The call rate hadn’t changed. But what’s changed is now 75% of queries to Google, Google Answers on Google without sending you back to the original source. But even in the last 6 months, the rate has increased even further where now it’s up to 15:1, 15 crawls for every one visitor. And if you look at OpenAI, which is 25:1, Anthropic, which is 6,000:1. It’s putting a lot of pressure on the media companies that are there that are making money through either subscriptions or ads on their pages.” Cloudflare CEO.
Moore’s law stands out for its speed against improvements in other industrial processes.
“The speed of intercontinental travel rose from about 35 kilometers per hour for large ocean liners in 1900 to 885 km/h for the Boeing 707 in 1958, an average rise of 5.6 percent a year. But that speed has remained essentially constant ever since—the Boeing 787 cruises just a few percent faster than the 707. Between 1973 and 2014, the fuel-conversion efficiency of new U.S. passenger cars (even after excluding monstrous SUVs and pickups) rose at an annual rate of just 2.5 percent, from 13.5 to 37 miles per gallon (that’s from 17.4 liters per 100 kilometers to 6.4 L/100 km). And finally, the energy cost of steel (coke, natural gas, electricity), our civilization’s most essential metal, was reduced from about 50 gigajoules to less than 20 per metric ton between 1950 and 2010—that is, an annual rate of about –1.7 percent.“
What stands out from this deep analysis is the renewed optimism in China on advanced semiconductor design and manufacturing.
“Ren [Huawei founder] further said that he is leading a network of more than 2,000 Chinese companies who are collectively working to ensure that China achieves self-sufficiency of more than 70 percent across the entire semiconductor value chain by 2028. These predictions should be taken seriously.“
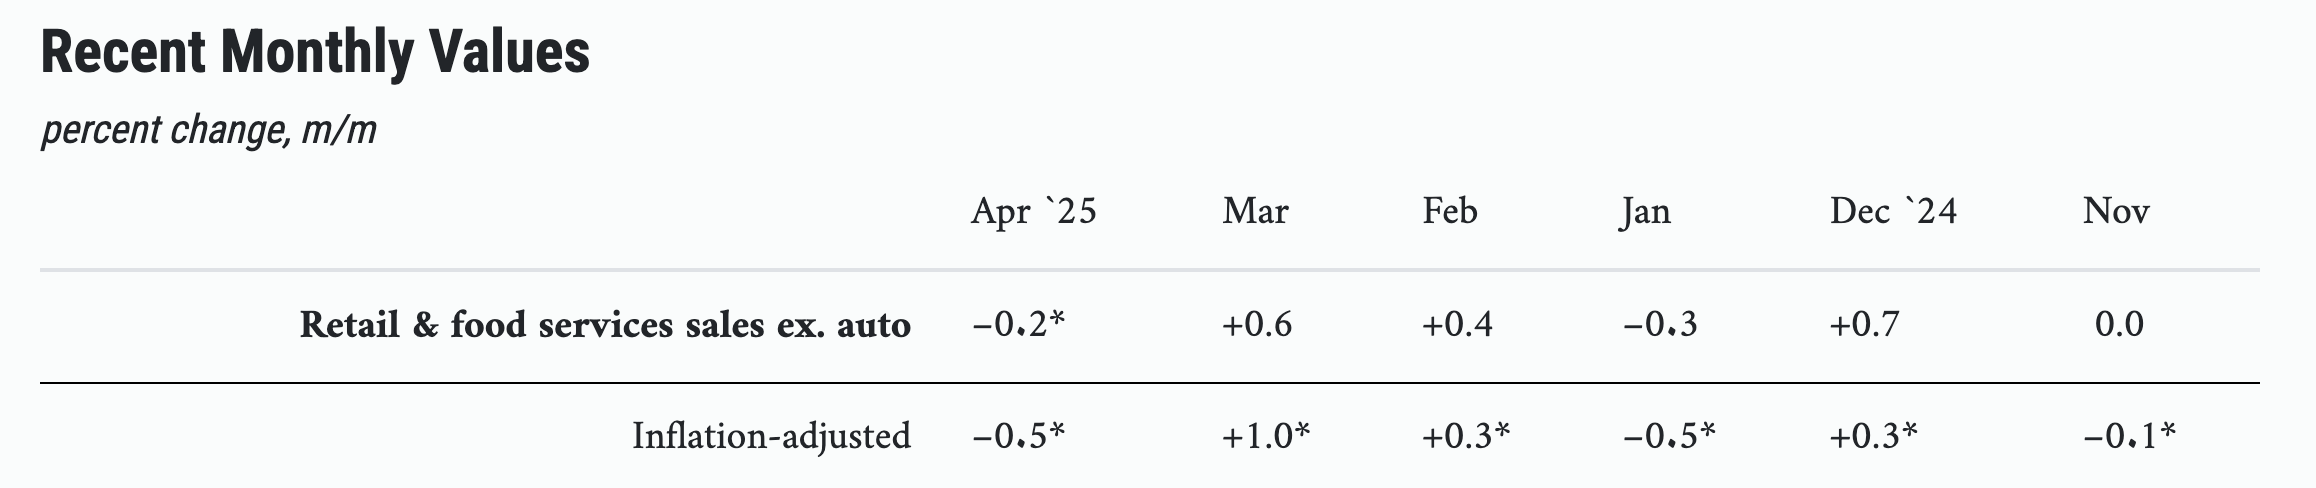
The Chicago Fed Advance Retail Trade Summary (CARTS) tracks the U.S. Census Bureau’s Monthly Retail Trade Survey (MRTS) on a weekly basis, providing an early snapshot of national retail spending.
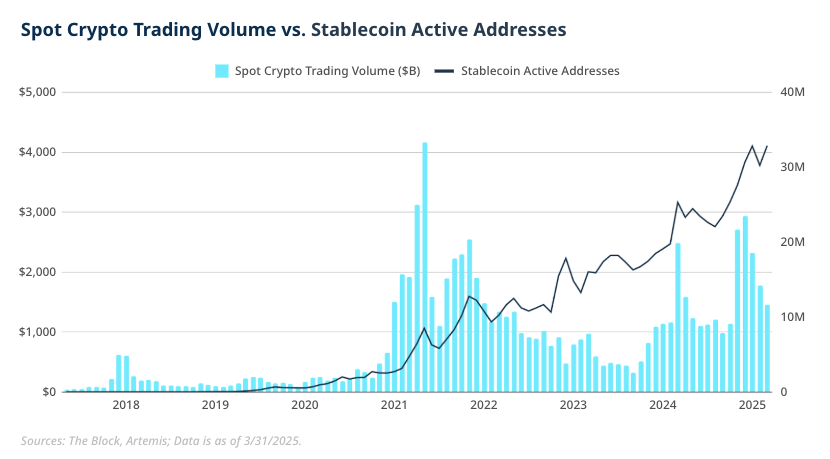
“While cryptocurrency trading volumes fluctuate with market sentiment, stablecoin usage is growing steadily, driven by practical applications rather than speculation.”