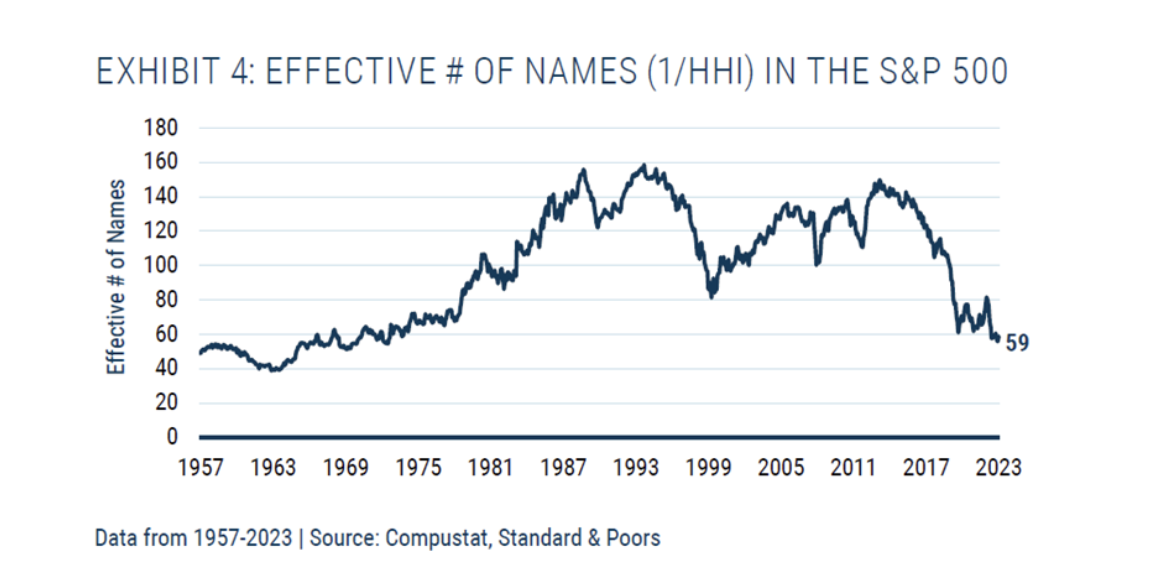
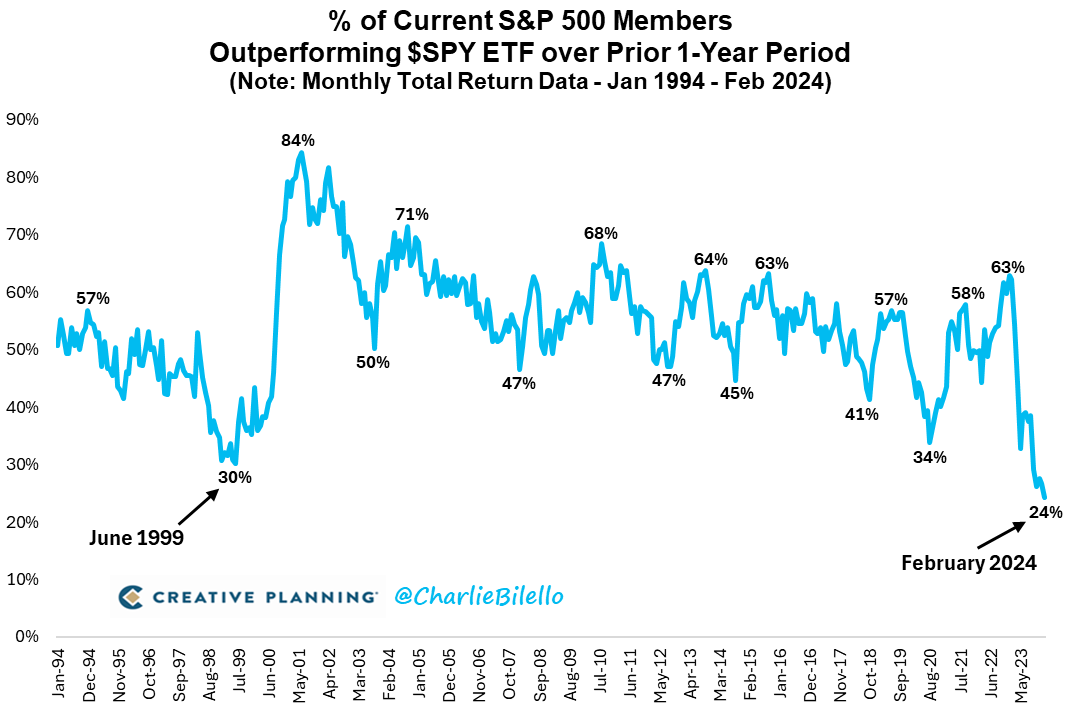
“The S&P 500’s total concentration, which we can measure using a Herfindahl-Hirschman Index (or HHI), is equivalent today to that of an equal-weighted, 59-stock portfolio. Ten years ago, the index was more than twice as diversified. We have never seen – over any 10-year period – a decline (or increase) in diversification of the magnitude we have just witnessed.“
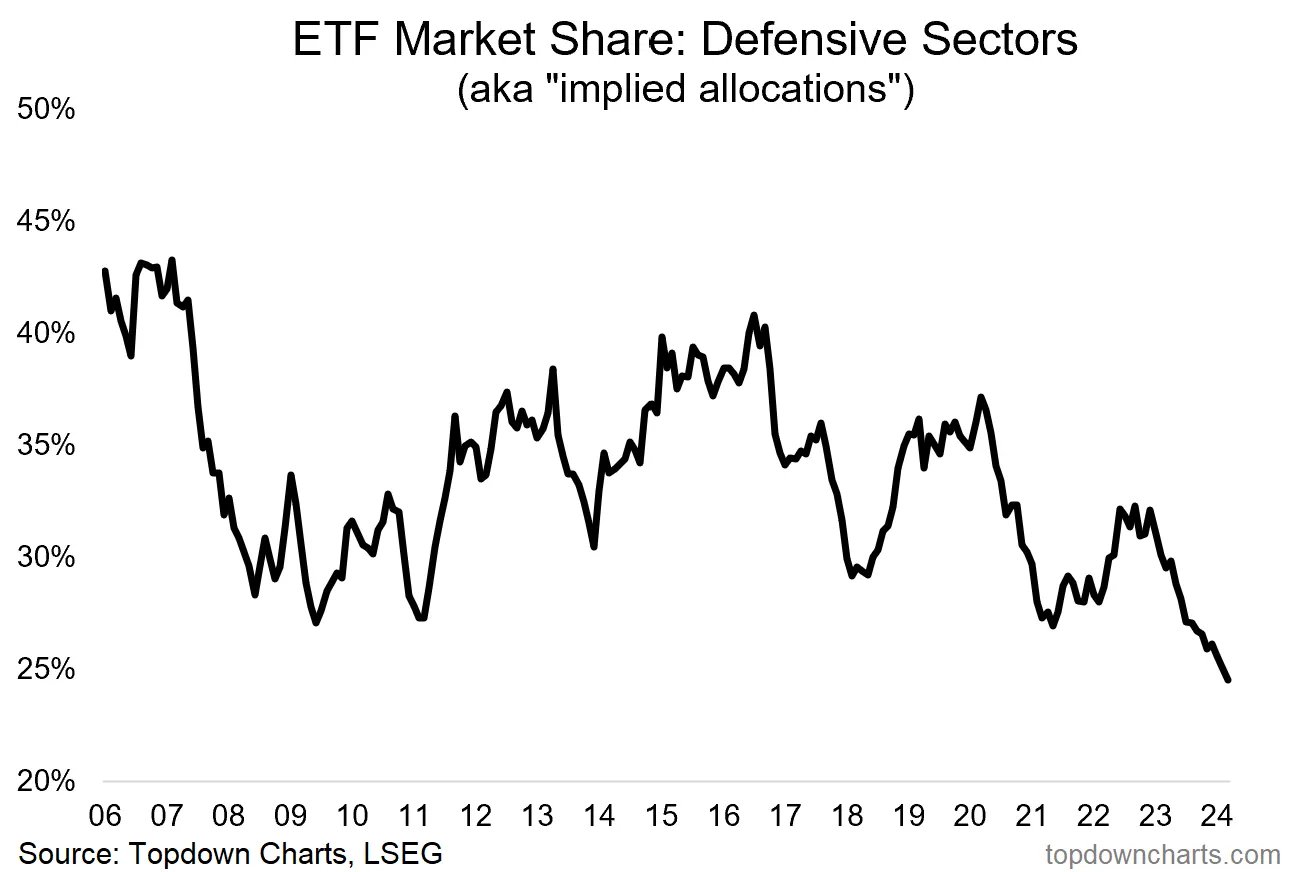
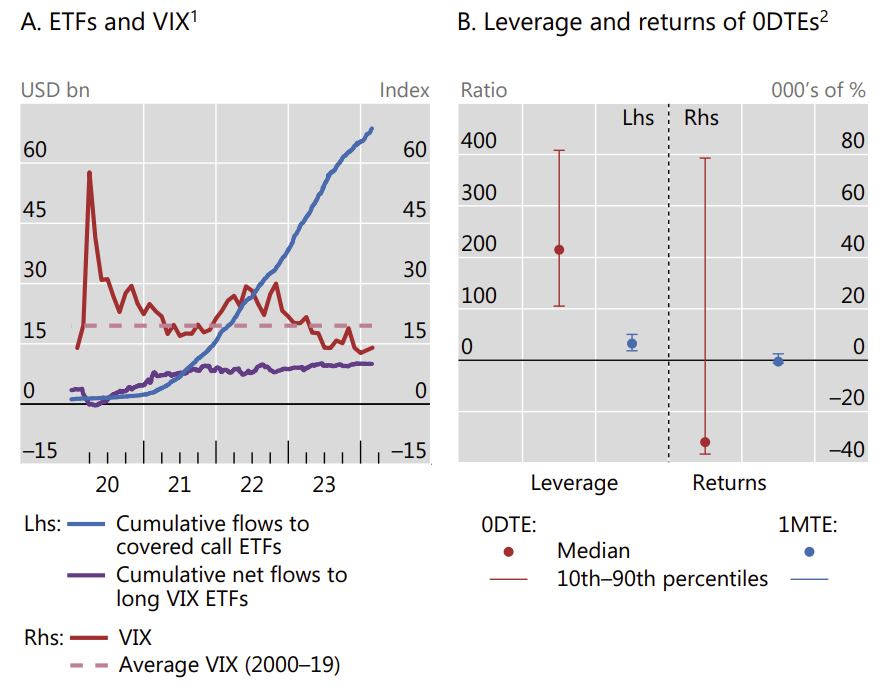
Latest BIS quarterly thinks it is not because of the rise of 0DTE options (those that expire the same day). This week these hit a new record volume share at 57%.
Rather the rise of yield-enhancing ETFs that sell options (in various forms) is the real culprit – see lhs of chart. JPM has some further analysis via FT.
While on the topic of 0DTE the rhs chart shows their truly lottery-like payoff structure.
“Investing in 0DTE options loses money on average, with annualised returns of -32,000%, but on rare occasions generates extremely high returns of up to 79,000%. These returns are much more volatile than the returns on one-month options, which have an average return of -550% annualised and a maximum of 2,500%.”
“Boston Consulting Group believes that AI and regular data center demand will grow to 7% of total electricity demand by 2030. To put this in context, this is the equivalent of the electricity used for lighting in every home business and factory across the United States. It’s a huge amount of energy. Most traditional data centers that were built 10 years ago were 10 megawatts or less. Today, it’s not uncommon to see 100-megawatt data centers. And with our clients, we’re talking about data centers that approach 1,000 megawatts. And they require 24/7 power. This is something that doesn’t get talked about enough in my opinion.”
That is from Constellation Energy’s CEO Joseph Dominguez (Source: The Transcript) – who of course is talking his own book but still.
Others confirm this, like the IEA – which thinks AI energy demand will double by 2026 – “that’s equivalent to adding a new heavily industrialized country like Germany to the planet”.
There are other huge environmental impacts – e.g. water.
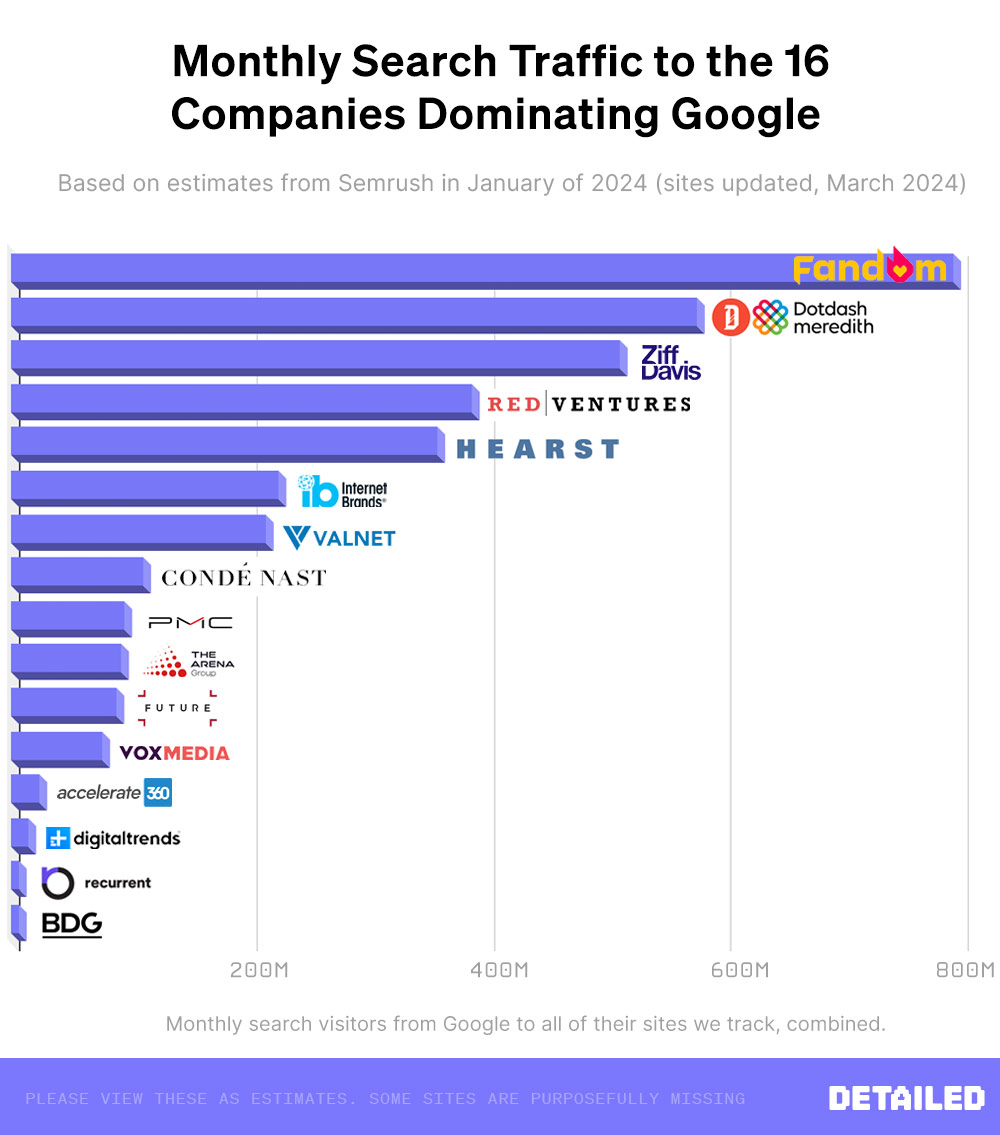
These 16 companies dominate Google search results. Odds are you haven’t heard of any of them.
“Across 10,000 terms where affiliates are ranking, which cover products in every niche you can think of (home, beauty, tech, automotive, cooking, travel, sports, education and many more), these 16 companies ranked on the first page of 8,574 (or 85%) of them.“
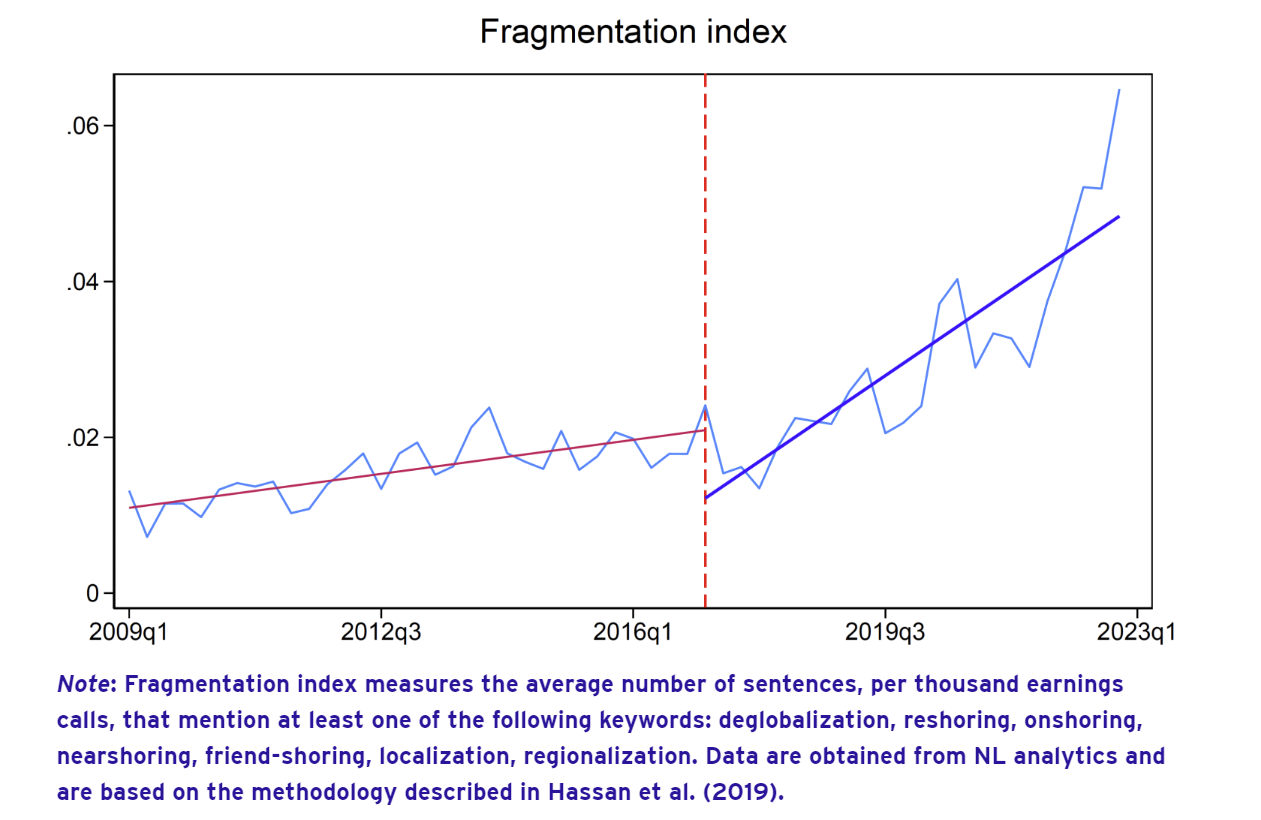
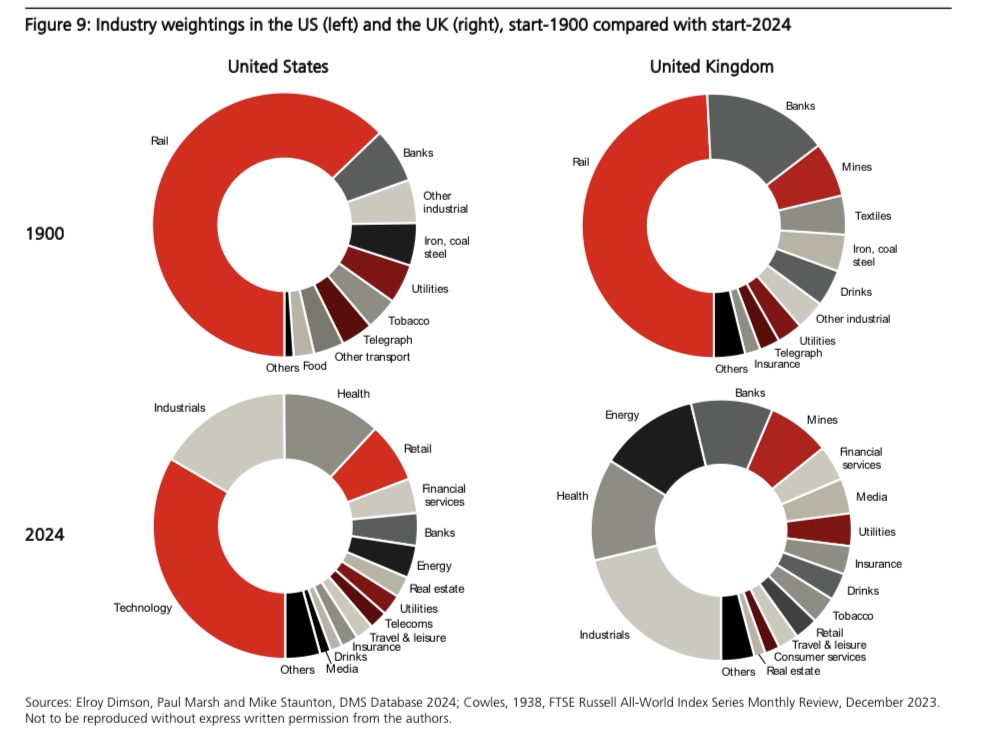
Let this sink in – “Of the US firms listed in 1900, some 80% of their value was in industries that are small or extinct today; the UK figure is 65%“
Many of these industries have simply moved to lower-cost countries.
“Yet similarities between 1900 and 2024 are also apparent. The banking and insurance industries continue to be important. Similarly, such industries as food, beverages (including alcohol), tobacco, and utilities were present in 1900 and continue to be represented today. In the UK, quoted mining companies were important in 1900 just as they are in London today“
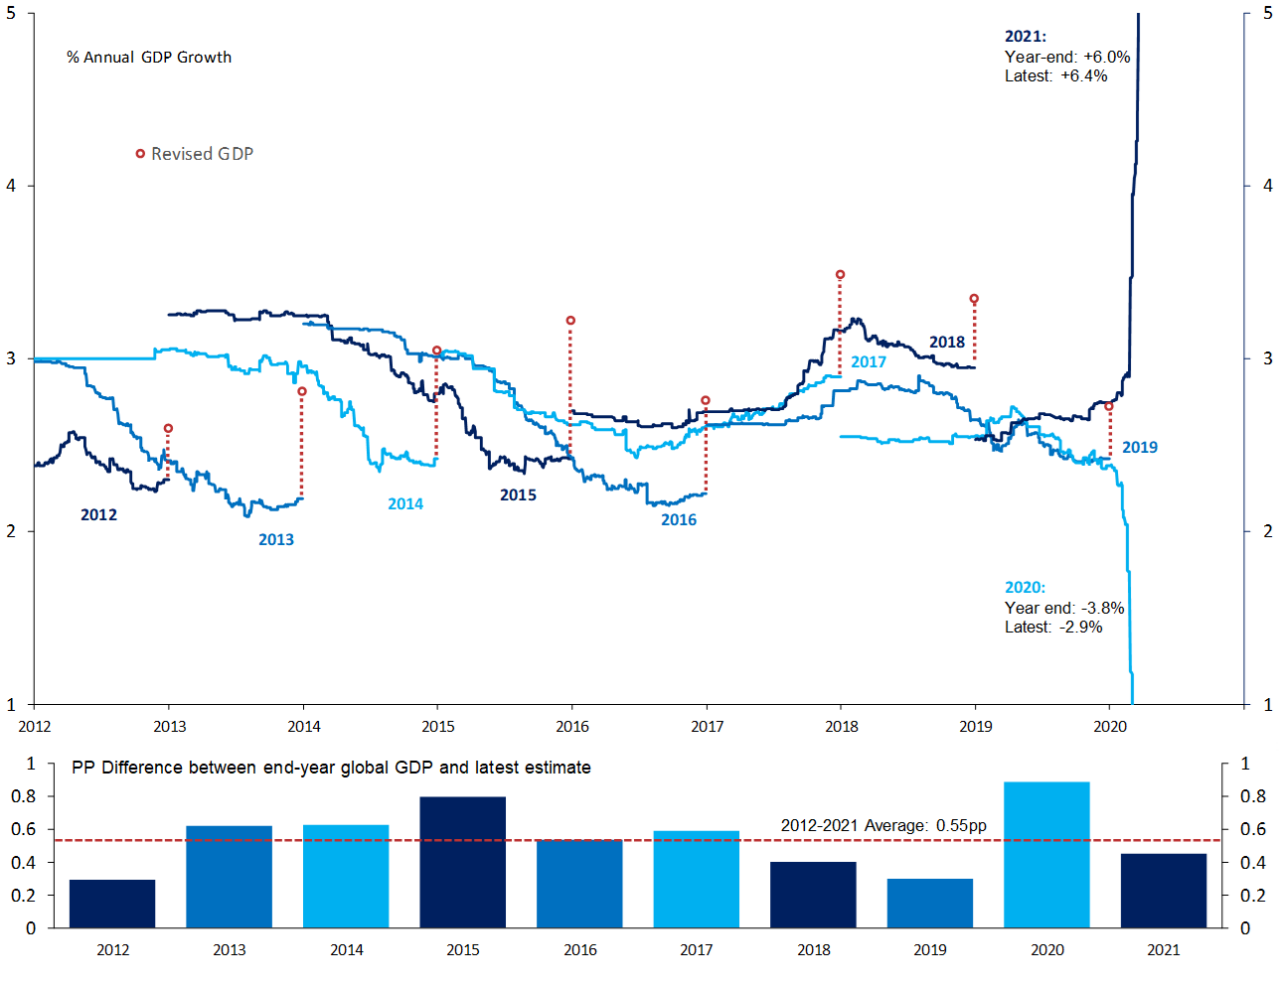
“As you can see, with the notable exception of 2020 — which was, well, an unusual year — initial estimates of global growth have been consistently too pessimistic, and final revisions have on average pushed up GDP growth by 0.55 percentage points a year in the 12 years to 2021.“
“Conveniently, the Philly Fed publishes monthly coincident indicators for each state. Aggregating the 50 signals into a composite index provides a somewhat different view of the US business cycle vs. traditional top-down metrics.“