It is business lore now that Gillette originated the business strategy of selling cheap razor handles to lock in customers to relatively more expensive razor blades, or so the story goes, recreated in board rooms and strategy meetings around the world today.
However, as this paper shows, Gillette never actually pursued this strategy – even when patent protection meant their handles couldn’t be used with any other blade.
Fascinating history of how we all ended up doing PowerPoint slides all the time.
The creator of PowerPoint also has a colourful story – “It’s hard now to imagine deafening applause for a PowerPoint—almost as hard as it is to imagine anyone but Bob Gaskins standing at this particular lectern, ushering in the PowerPoint age. Presentations are in his blood. His father ran an A/V company, and family vacations usually included a trip to the Eastman Kodak factory. During his graduate studies at Berkeley, he tinkered with machine translation and coded computer-generated haiku. He ran away to Silicon Valley to find his fortune before he could finalize his triple PhDs in English, linguistics, and computer science, but he brought with him a deep appreciation for the humanities, staffing his team with like-minded polyglots, including a disproportionately large number of women in technical roles. Because Gaskins ensured that his offices—the only Microsoft division, at the time, in Silicon Valley—housed a museum-worthy art collection, PowerPoint’s architects spent their days among works by Frank Stella, Richard Diebenkorn, and Robert Motherwell.”
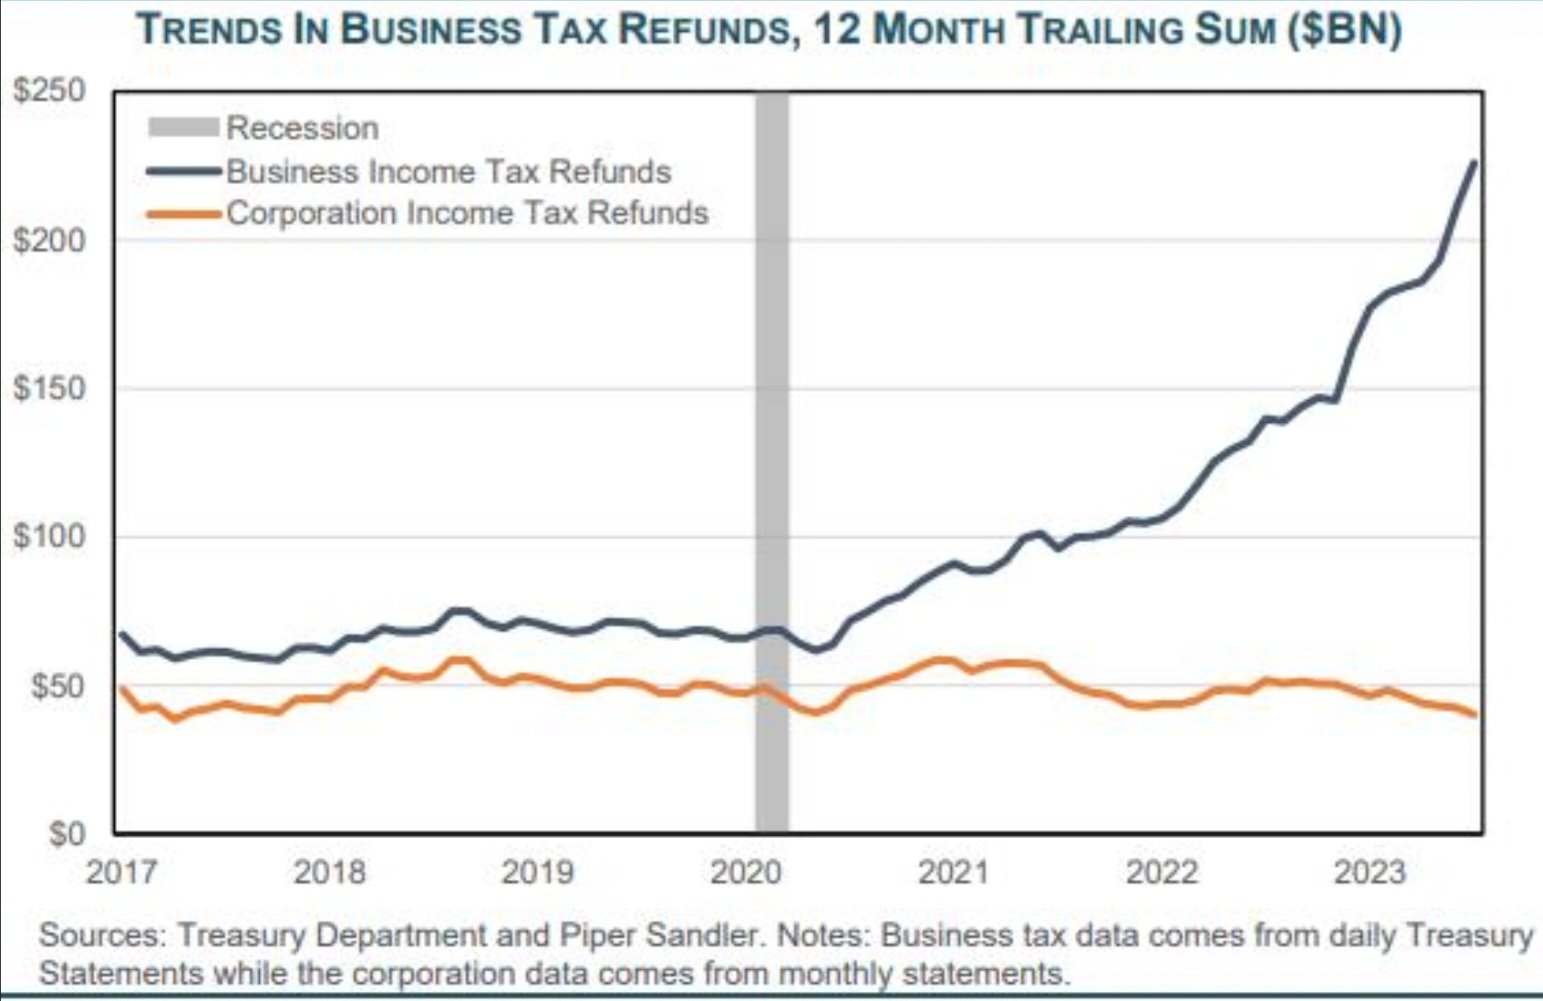
“Recently, the IRS has accelerated payouts from a pandemic-era tax benefit known as the Employee Retention Credit (ERC). We estimate over $220 billion has been disbursed so far ($130 billion this fiscal year) and data on outstanding claims suggests there’s at least another $120 billion yet to be distributed. The use (and in some cases abuse) of this benefit should provide a meaningful tailwind for small business balance sheets and consumption through the end of the year and into 2024.“
More and more anecdotal evidence suggests that GLP-1 agonists (like semaglutide, the active ingredient in popular weight loss drugs Wegovy and Ozempic (off label)) could dampen cravings for alcohol.
A survey of individuals taking these drugs by Morgan Stanley has confirmed this phenomenon.
Up to six clinical trials are testing semaglutide in alcohol use disorder – which could provide conclusive proof.
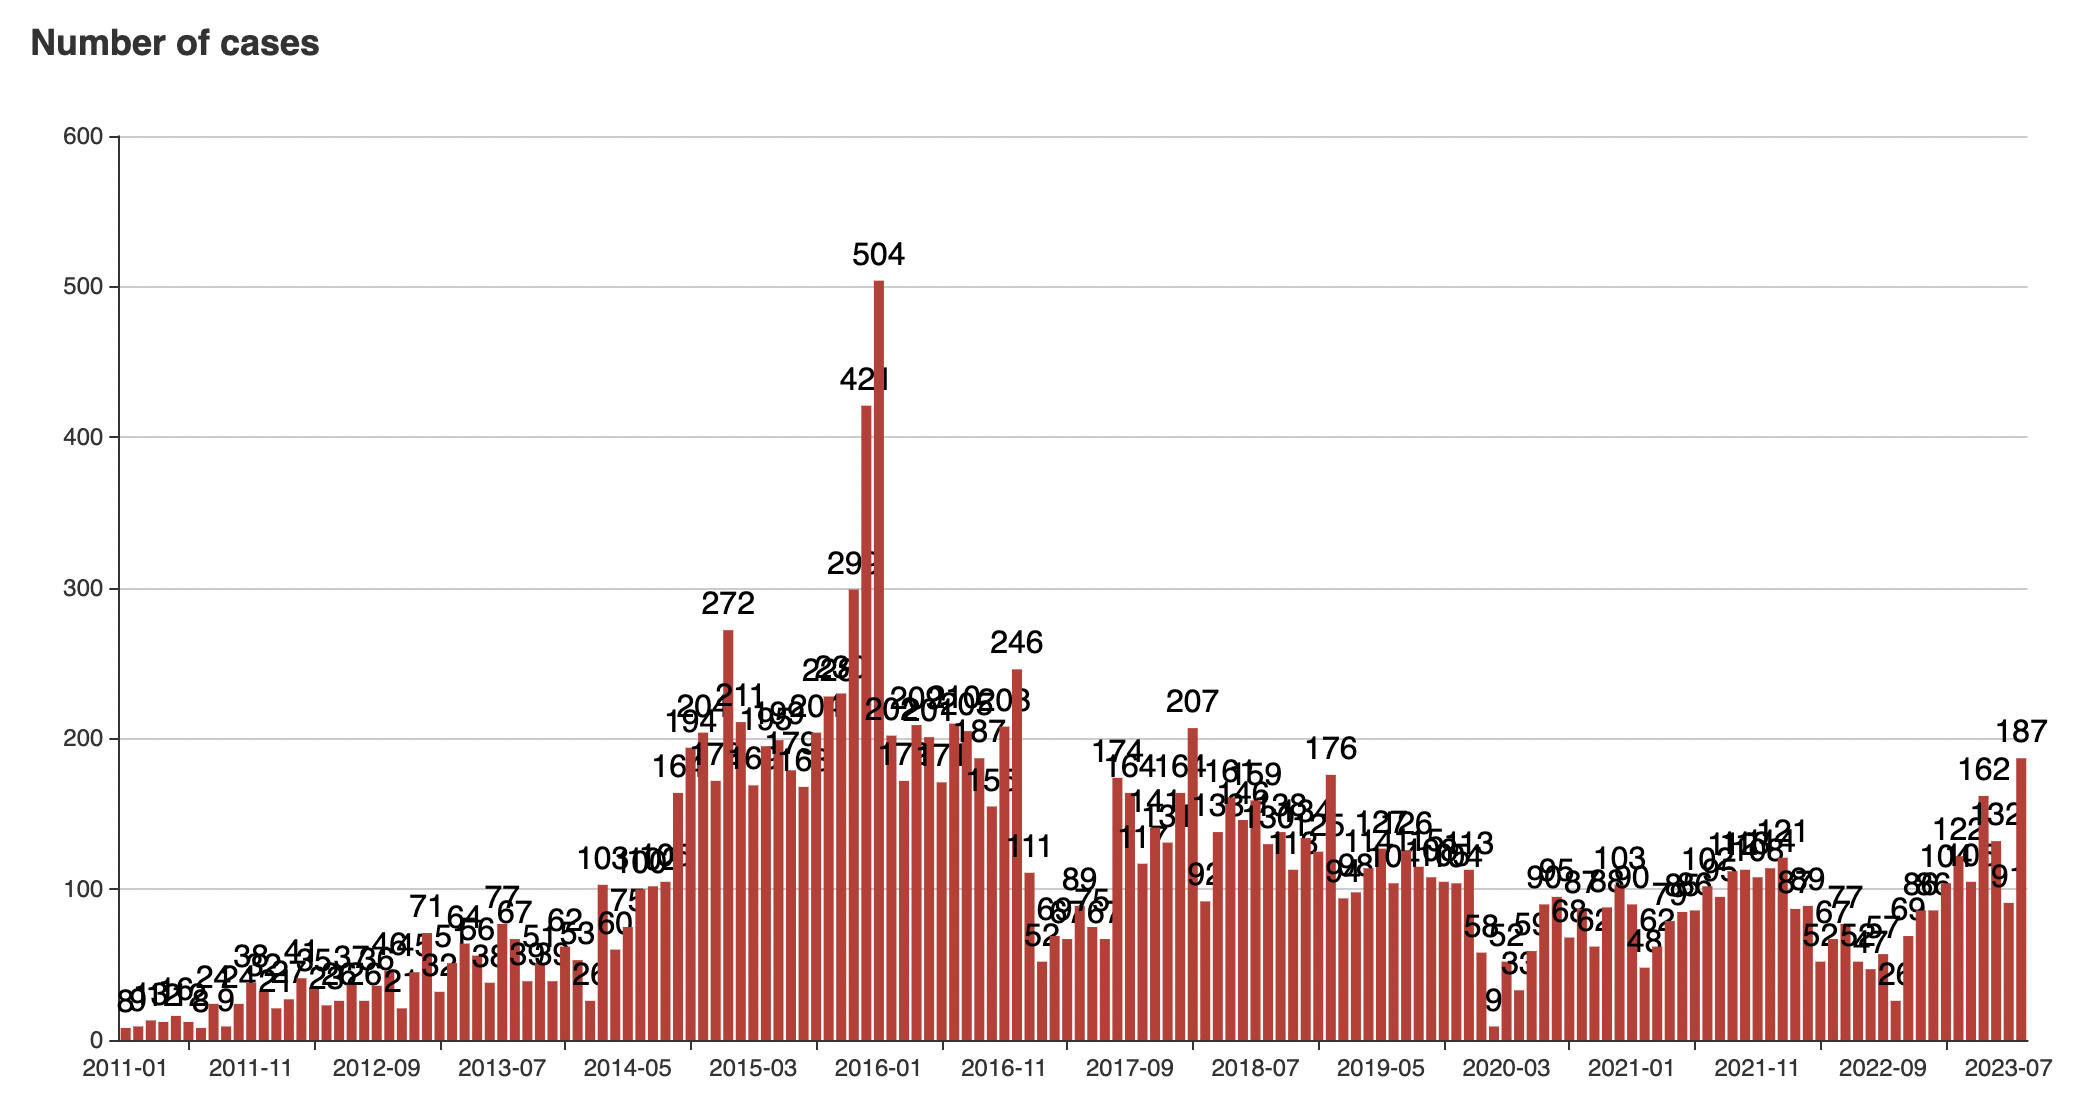
Investors are generally trying to determine the implications of the weight-loss revolution. As this chart shows the number of expert calls done by investors on AlphaSense on the topic has risen rapidly.
Alpha Sense also has a handy guide to the Obesity space here (need to sign up).
It is a bit technical but left me with a feeling that though LLMs are a big breakthrough, they have big limitations.
Models beyond the autoregressive LLM that start to mimic some of the planning and reasoning required to rival human intelligence are a lot more complicated with not-so-neat solutions.
A very handy tool that tracks strikes in China – both statistics and as a map.
Latest monthly numbers have seen a spike.
“Worker strikes have reached a new height after the pandemic,” Aidan Chau, a researcher at CLB, told Nikkei Asia. “Many protests are related to slowing demand in international trade.” (Nikkei Asia).
The rise of the AfD (the right-wing populist party) in German polls has been remarkable.
With elections looming in October 2025, this political risk will soon be on investor’s horizons.
In this context, this interview with Wolfgang Munchau, former co-editor of FT Deutschland, is a must-read to understand the woes of Europe’s largest economy and how these reflect in politics.
Interestingly he highlights another possible surprise on the left political spectrum – “there may soon be a party on the Left led by Sahra Wagenknecht, a very sort of maverick politician, who has left or who is on the verge of leaving the Left Party, who may be forming a new party of the Left. And that party was also on opinion polls at potentially 20% of the electorate.”
Everyone is trying to figure out what AI means for GPU demand.
It’s hard as the true picture is muddied by providers investing in their own customers, demand-pull forward, and strategic buying ahead of having a real use case (see Saudi, UAE, U.K.)
Confounding all this is Meta releasing Llama 2 for almost free, followed most recently by its coding version (by far the most useful application of AI so far).
This matters because training is a lot more GPU-intensive than inference. Free models mean less training needed. This specifically matters for Nvidia’s H100 chip (which by the way weigh over 30 kgs!).
Qualcomm actually thinks processing might happen right in our phones (they of course would benefit most from this).
“Eventually, a lot of the AI processing will move over to the device for several use cases. The advantages of doing it on the device are very straightforward. Cost, of course, is a massive advantage. It’s — in some ways, it’s sunk cost. You bought the device. It’s sitting there in your pocket. It could be processing at the same time when it’s sitting there. So that’s the first one. Second is latency. You don’t have to go back to the cloud, privacy and security, there’s data that’s user-specific that doesn’t need to go to the cloud when you’re running it on the device. But beyond all of these, we see a different set of use cases playing out on the device.” Qualcomm CFO Akash Palkhiwala (via The Transcript).
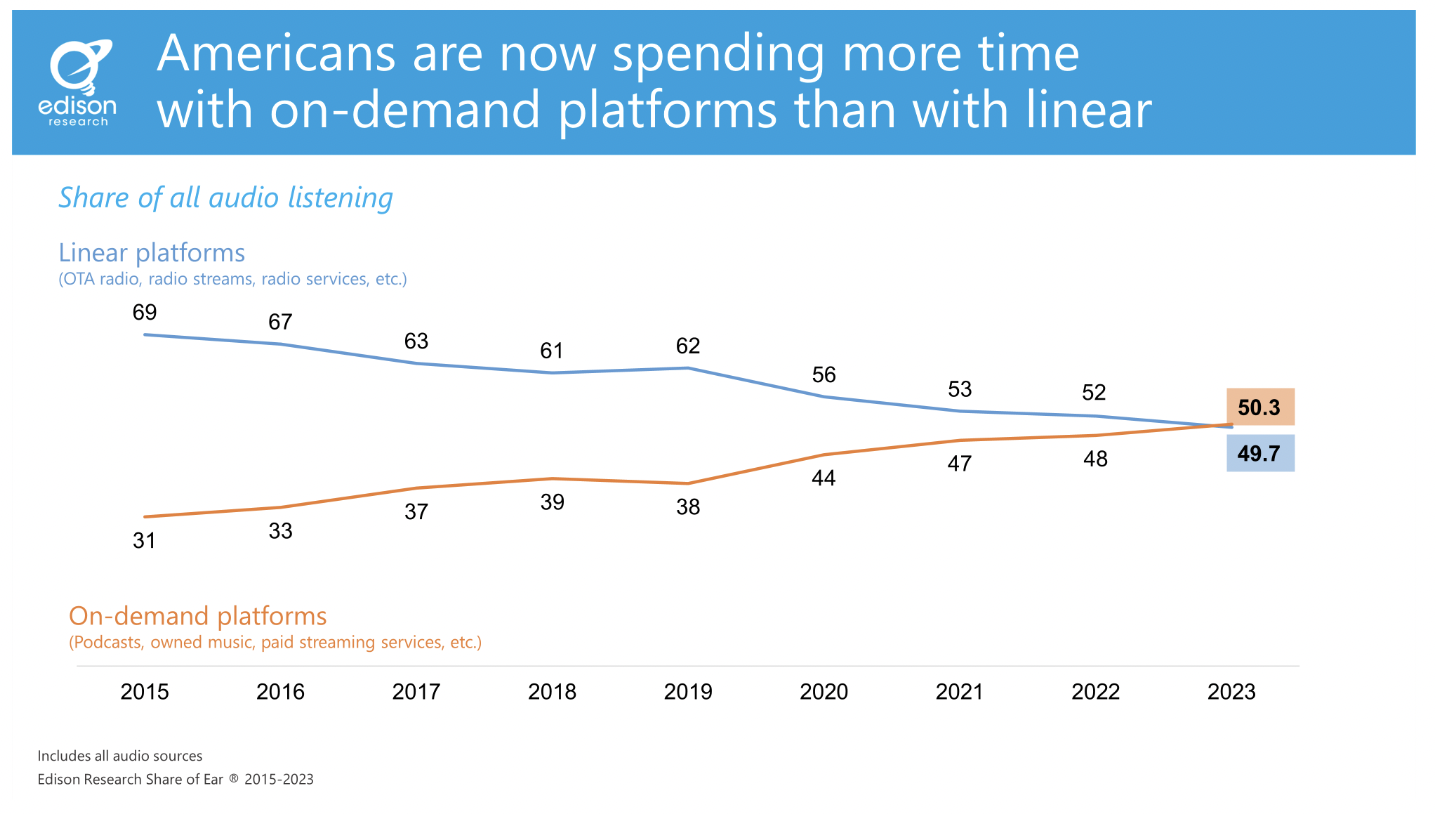
“At the end of 2015, a scant seven and one-half years ago, the margin between linear listening and on-demand listening was 38 percentage points. But drop by drop, quarter by quarter and year by year, the margin was erased, and now on-demand leads.“
“linear” audio refers to – radio over the air, radio streams, Pandora’s free radio service, satellite radio, etc. and “on-demand” audio – paid streaming, podcasts, owned music, etc.
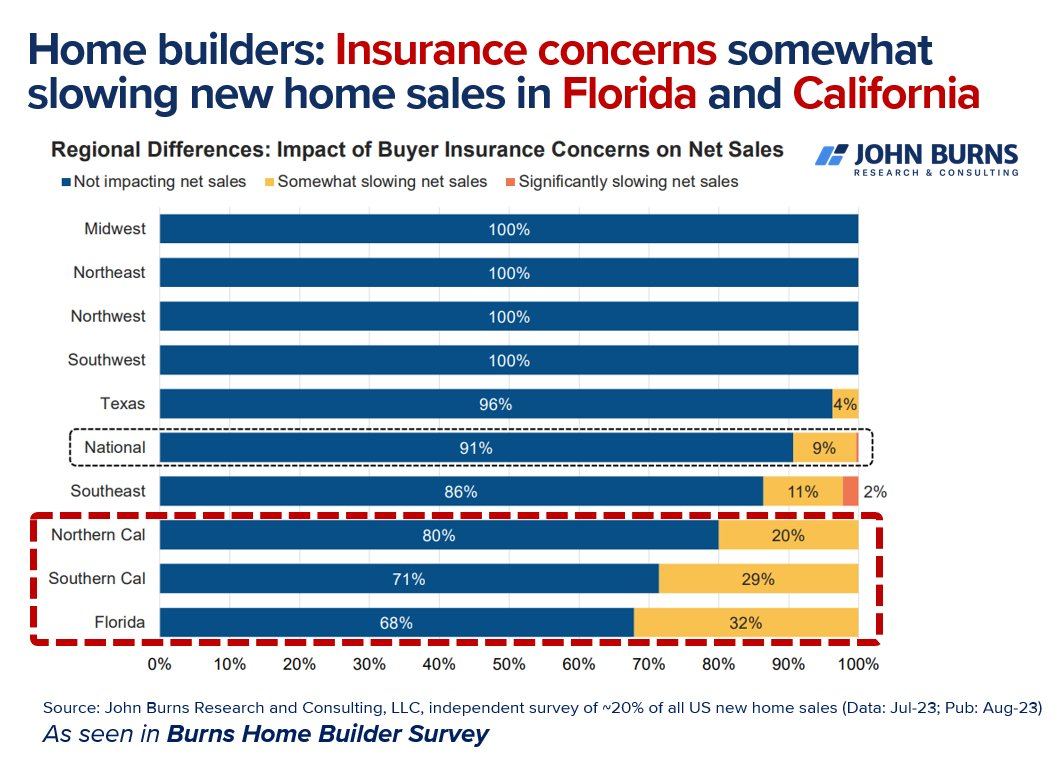
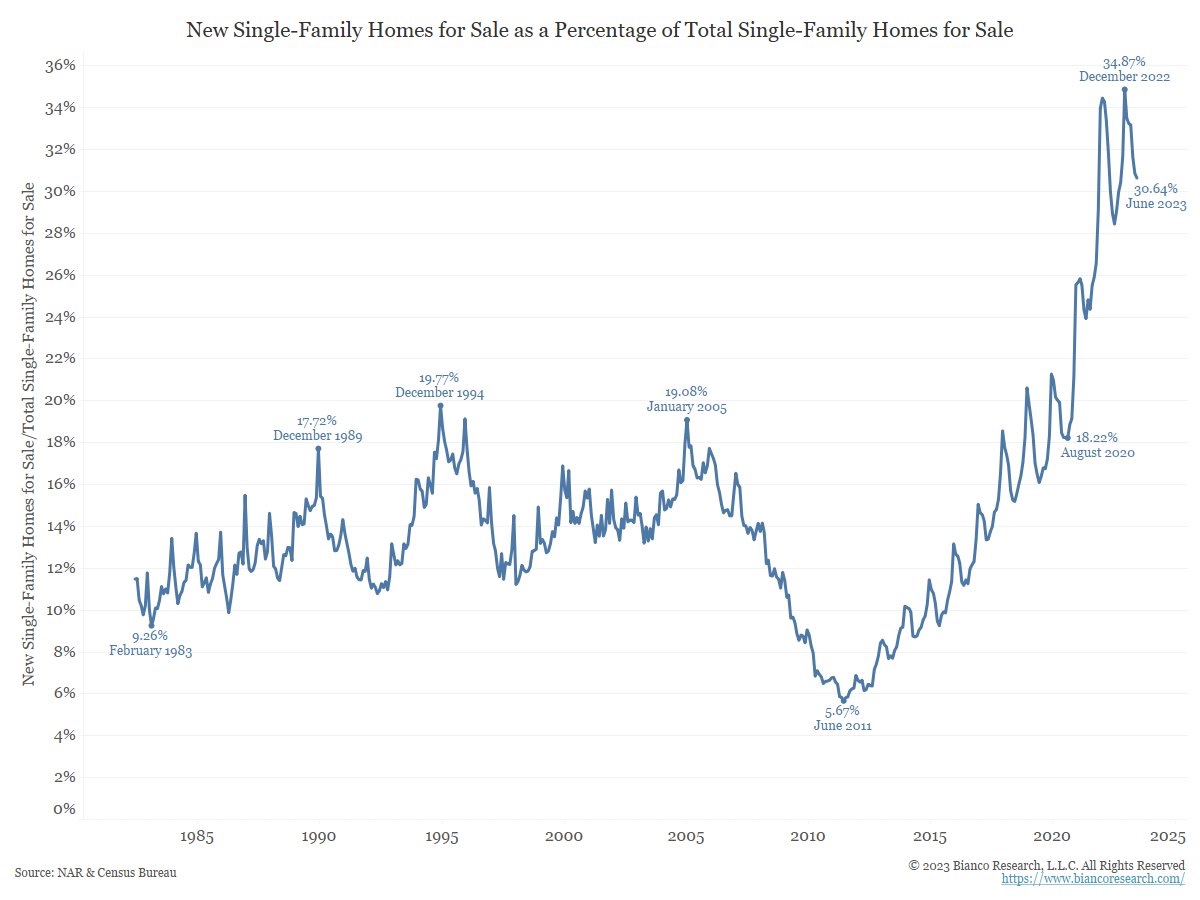
Rising cost and reduced availability of property insurance are starting to impact new home sales (according to survey of homebuilders) – especially in CA and FL.
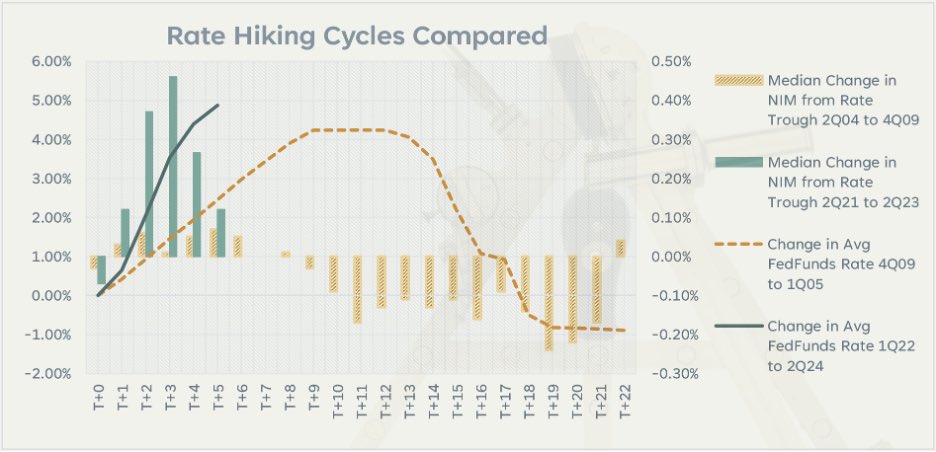
Excellent analysis of how banks got themselves in a bad position this rate-rising cycle.
So much to learn – capitulation led banks into buying MBS that suffer from negative convexity “trapping” (by rising rates extending weighted average lives) banks into low-yielding assets, not enough capital to take losses, held-to-maturity accounting choice requiring marking everything to market (“tainting the book”), the head fake from a higher portion of floating assets pulling forward net interest margin gains.
The result – a worrying state of affairs with funding rates having a long way to go hurting earnings for a long time. This isn’t good for the credit outlook either.
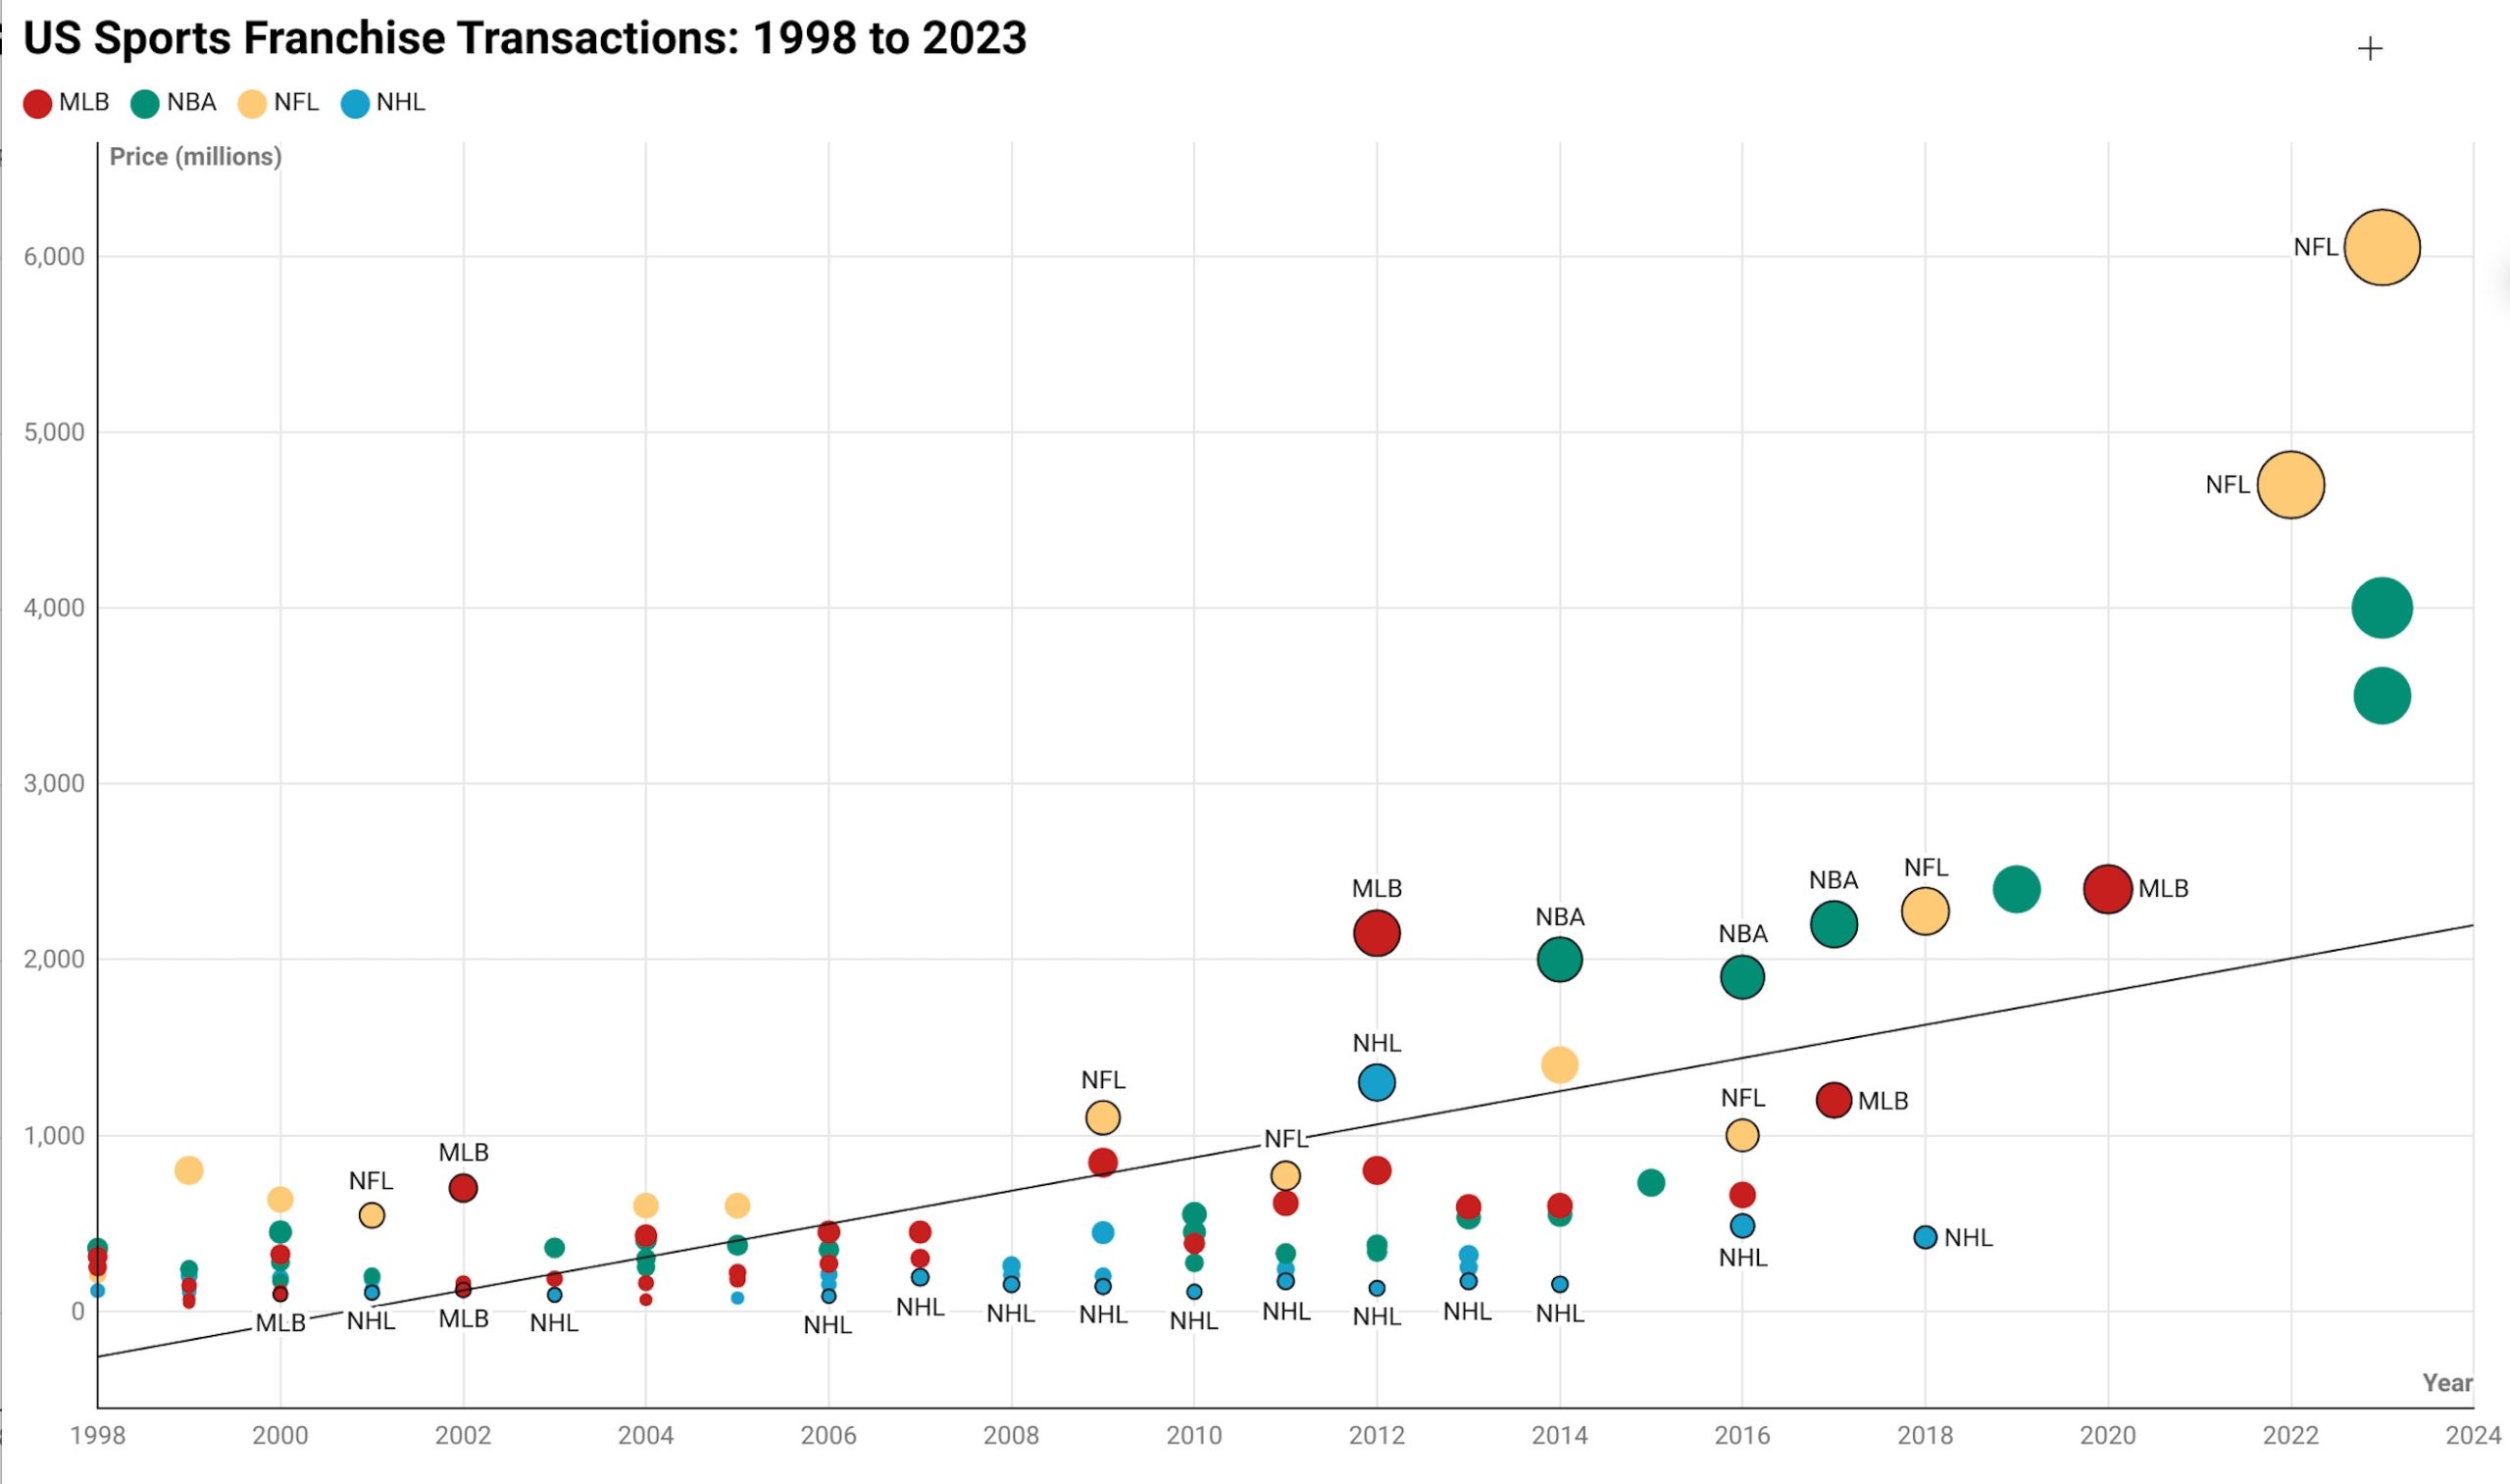
“As you can see, transaction prices for sports franchises have been marching upwards for the last two decades, with NBA and NFL teams registering the biggest increases, but have seen breakaway surges in the last few years.”