“I am hesitant to say this — Tesla’s business, if you want to use the analogy, is like that of a kitchen and a chef. They have not created a real business in the real world yet. They are trying to trade recipes. The chef is saying ‘Our recipe is going to become the standard of the world in the future!’ At Toyota, we have a real kitchen and a real chef too, and are creating the dishes already. There are customers, who are very picky about what they like to eat, sitting in front of us, and eating our dishes already.” Toyota President Akio Toyoda.
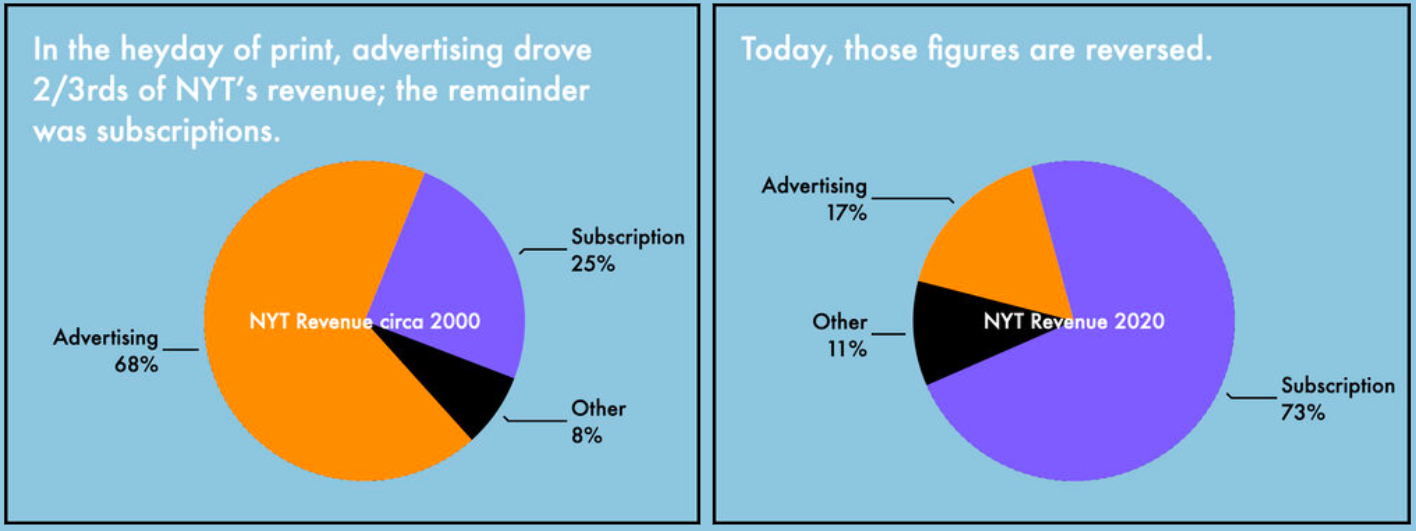
Great set of slides on the transformation at New York Times since 2011.
The company just crossed a milestone where digital overtook print.
This is also a fascinating read about what happened inside the NYT newsroom during the Trump years and whether this boost was partly responsible for its growing business success.
A brilliant extract from a podcast with Shopify CEO Tobi Lutke quoted by Alex Danco in his newsletter (after joining the company).
“I’m a card-carrying member of the “video games are actually good” club. I’ve learned so many things in my life through video games … I tend to point out a few I think are extremely valuable.Factorio is one of those. It’s the one game that anyone at Shopify can expense. .. We’re building supply chains for our customers; logistics networks; and Factorio makes a game out of that kind of thinking.
The reason why I think video games are good is because of transfer learning. There’s a good book called The Talent Code that talks about this. There was a famous story about people analyzing why Brazilians became so much better at soccer than anyone else. And there were many reasons – it’s a system that’s reinforced by all these things – but people hadn’t found the key reinforcing mechanism that made this true.
It turns out, in Brazil there was a culture of playing a pickup game, a version of soccer that was played in a much smaller space and with fewer players. And the players did all the things you need to be good at soccer, but they did them significantly more often, because there was more ball contact per person. Just because that’s a different game than soccer doesn’t mean people won’t learn soccer skills. They had way more ball contact than someone who went through the British system, by the time they entered the Premier league, for instance.
Butif I sit down for an evening of poker, I make these decisions every hand. And then you look at a game like Starcraft, which I think is very good, or Factorio, and in a very compressed, fun environment, follow a certain activity over and over and over again which otherwise comes around only rarely. And doing that will change your mind, and your brain, and help you be prepared for situations you could never predict.“
“[The] mission of the company is to be the most creative, the most innovative and the most efficient entertainment company — not interactive entertainment company, entertainment company — on earth,“
We previously covered the LTSE here and some companies (e.g. Airbnb) are indicating a desire to list there.
They have started publishing a blog where they discuss all issues related to long-term shareholders and companies.
The latest piece covers grading fund managers on how long term they are – LT Score.
“This shows that the companies with the highest LT Scores trade at volatility levels that are as much as 30% lower than those with the lowest LT Scores when looking at average 100-day and 250-day historical volatility levels. This is a striking difference.“
Spotify is transitioning and not just via their podcast investments.
They are starting to enter the world of advertising and arming artists with tools to reach audiences, at a price.
First via Marquee mode – mobile app pop ups to advertise new releases. These see 20% conversion rates, 2.2x lift on saved/playlisted tracks which itself leads to increased playing by 250%.
Second via a new Discovery mode – where an artist can boost a track in Spotify’s algorithm in return for a lower take.
Interesting post covers the logic behind this as well as price increases.
“Marc Pritchard, Chief Brand Officer at P&G, the world’s largest advertiser, dropped a bombshell at the ANA conference a few weeks ago. He said that P&G would be moving away from the upfront model of TV ad buying. With TV advertising going digital, it makes no sense to make massive uninformed bets just because that’s the way it’s been done for decades. Now they can apply data to those decisions and be more deliberate ” The Trade Desk CEO Jeff Green.
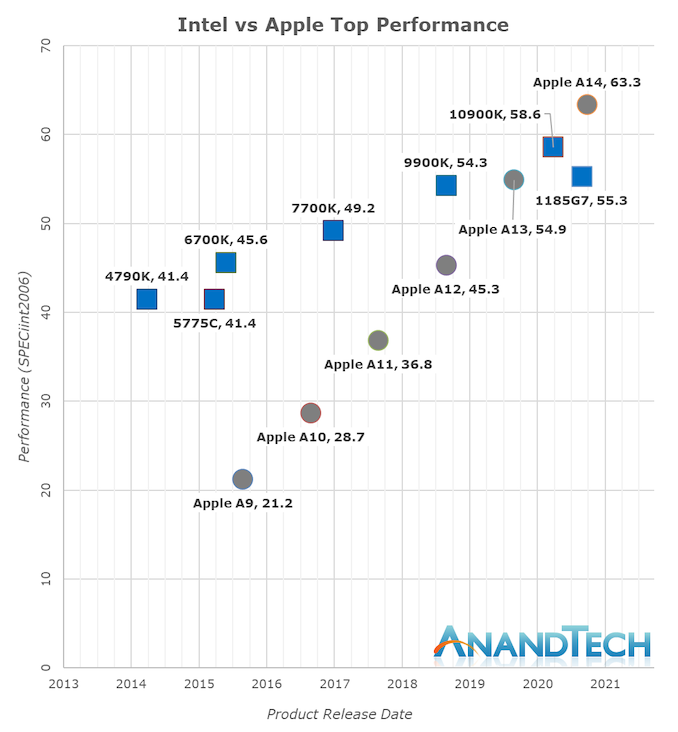
Apple silicon performance improvement has been staggering – “Whilst in the past 5 years Intel has managed to increase their best single-thread performance by about 28%, Apple has managed to improve their designs by 198%, or 2.98x (let’s call it 3x) the performance of the Apple A9 of late 2015.“
US clearly stands out as it spends far more on healthcare than any other rich country in the world yet has little to show for it in terms of life expectancy improvement. Source.
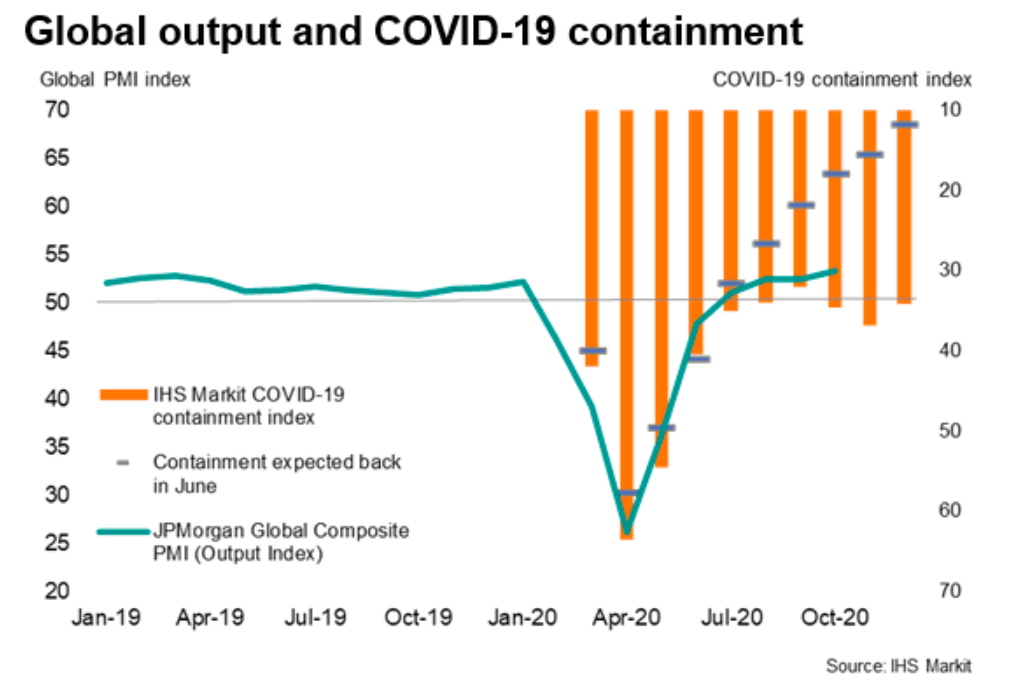
Interesting chart plotting global PMI (green line) against an index of containment (orange line, degree to which economies are locked up).
This index eased from a peak of 64 in April to 32 in September, helping PMIs rise.
In October it has started to rise to 35, and throughout has remained higher than what was expected a few months ago (dashes) – it should have been 18 by now.
Last week Denmark sounded the alarm on potentially dangerous developments related to SARS-CoV-2 virus.
The two worrying elements are (1) a mutation in the spike protein which could render the upcoming vaccines and antibody immunity of those already infected useless (2) a jump from animal (mink) to human.
This is a good summary and the press release from the Danish Serum Institute (use Google Translate) is also worth reading.
STAT news have a more sanguine take – arguing that there is nothing to suggest the mutated virus could have higher transmission rates or risks for humans and single mutations rarely are cause for alarm.
Earlier this year we covered Biogen’s decision to file Aducanumab (their experimental treatment for Alzheimer’s Disease) here and here.
This saga reignited this past week with the publication of FDA adcom documents which on the surface looked positive sending the shares soaring only to be voted down (8-1) at the meeting on Friday sending them crashing down.
This really good blog post discusses these events and why it is always important to read all the details.
The final FDA outcome is yet to be determined (Adcom decisions aren’t binding) and as previously highlighted could be political.