- Alternative way of looking at the US housing market – suggesting it isn’t as frothy as it seems.
- Adjusted for inflation and interest rates, using median house prices and a 20% downpayment the monthly mortgage payment in the US has actually come down over time.
- This is especially so if you adjust for the “quality” of the median house.
Macroeconomics
Snippets on the big picture.
JPM Q1 2021 Slide Deck
- Comprehensive slide deck – Guide to The Markets – Q1 edition.
- Worth a flick.
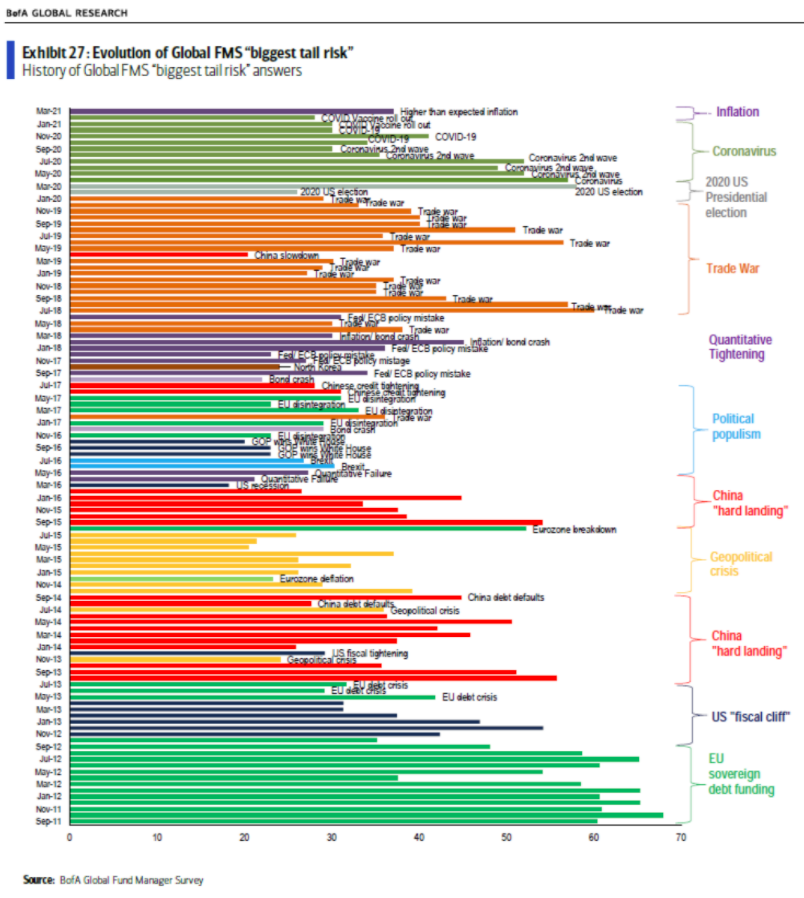
Biggest Tail Risk
- For first time in months Covid is no longer the biggest risk cited by fund managers in the BAML Survey.
- Interesting chart of what does get mentioned over time.
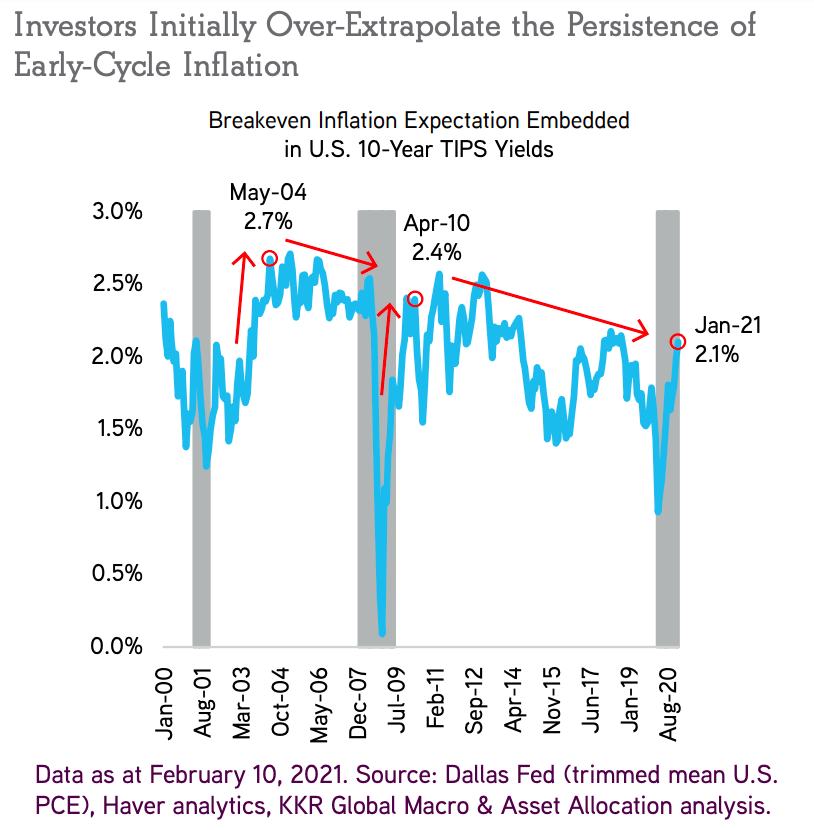
Inflation Extrapolation
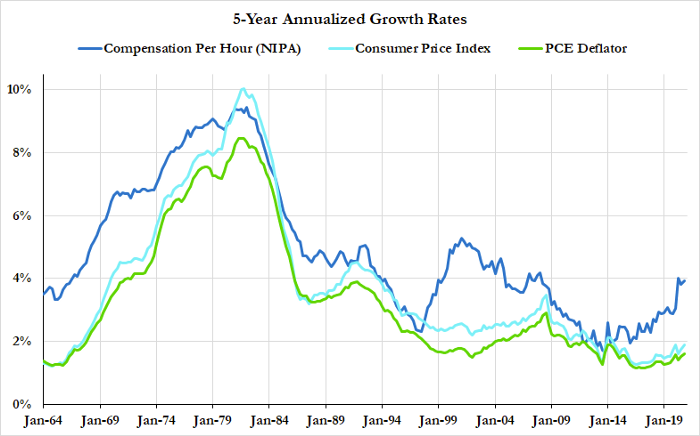
- Nice chart from KKR showing how investors in the 2000s have over-extrapolated the persistence of early cycle inflation.
- The reason this happens is early cycle pops in commodity prices and disposable incomes don’t flow through to core consumer prices.
- Consumer goods themselves are also only a quarter of core CPI.
- See page 17 of the report for details.
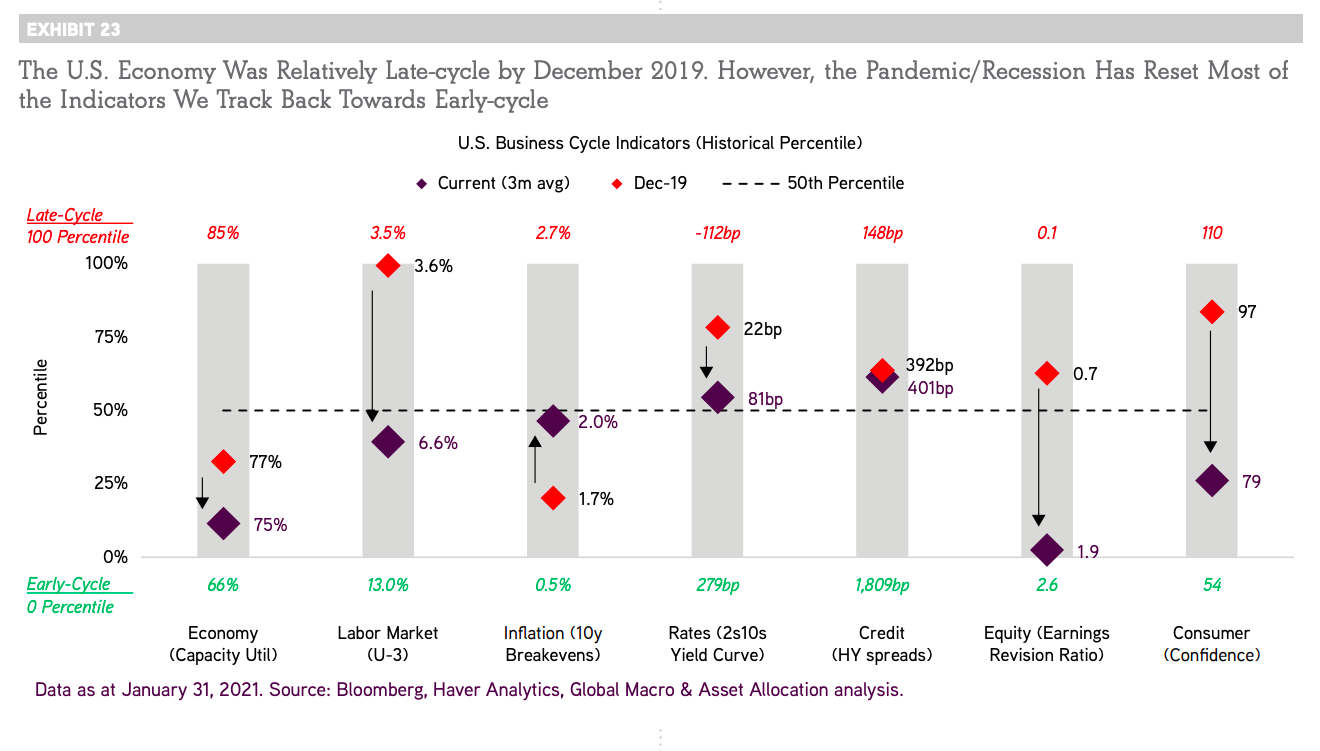
Early Cycle
- Nice chart from an excellent KKR March macro report.
- It shows that from being late-cycle at the end of 2019 most indicators reset back to early-cycle.
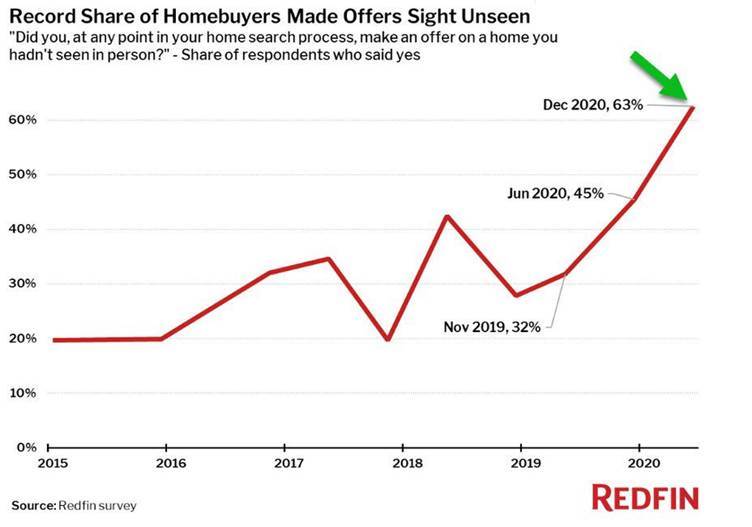
Buying without Seeing
- Staggering chart showing that 63% of respondents on property site Redfin made an offer on a home without seeing it.
Inflation pt 2
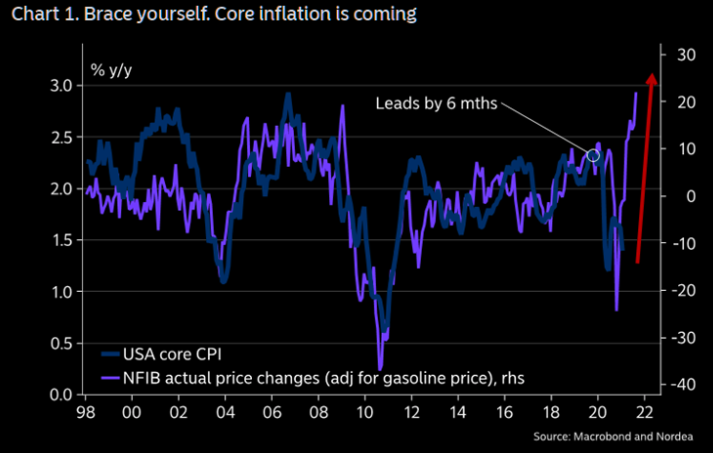
- Most indicators suggest inflation is heading higher in 2021, though there is some disagreement (here).
- Here is one more from Nordea to add to the list.
- The bank argues overshooting inflation will be harder to defend in an average inflation targeting regime than when it is below target.
- The Fed and the market, as we wrote before, need to discern whether this is transitory or persistent.
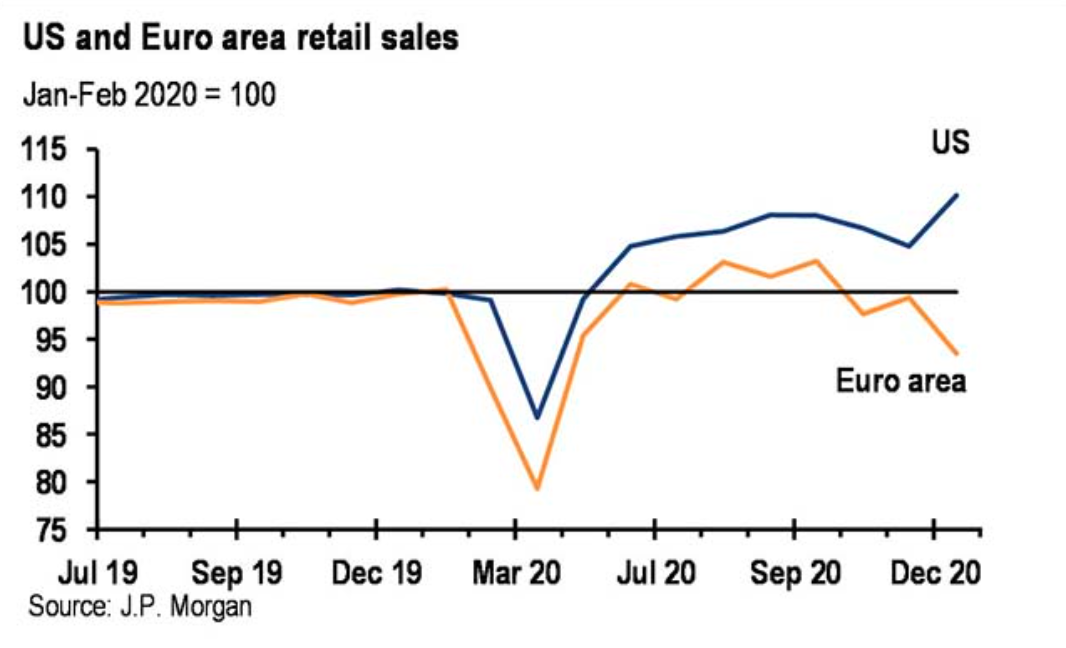
Europe vs. US
Inflation
- Inflation has been a big topic in markets recently.
- This post is worth reading to understand the key distinctions between transitory and persistent inflation.
- Interesting stat – sectors that are vulnerable to post pandemic consumption shifts are less than a quarter of PCE inflation component weights.
- The bottom line is it is important, for markets and the Fed, to watch labour markets alongside inflation.
Vaccination Rates
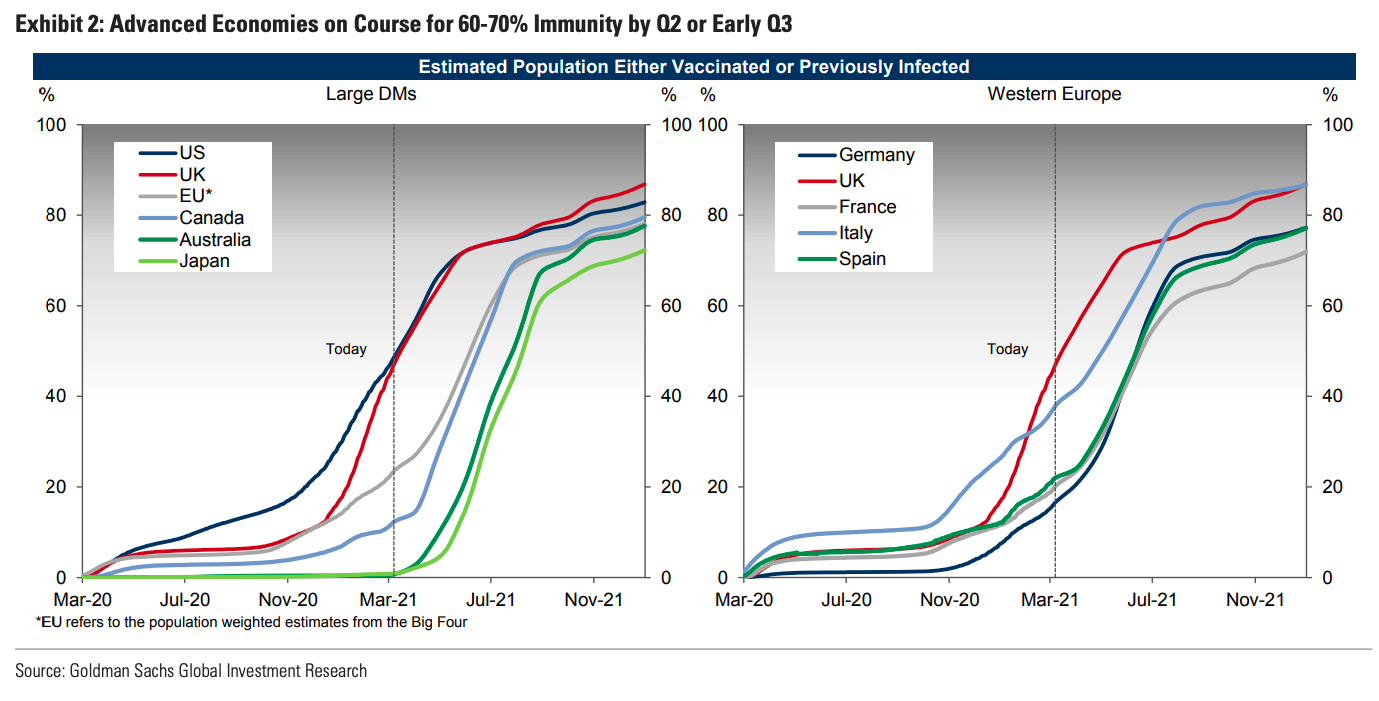
- GS estimates that most advanced economies should cross the point at which 60-70% of the population are immune by Q2/Q3.
- UK and US are ahead with Europe a few months behind.
Market Inflation Expectations
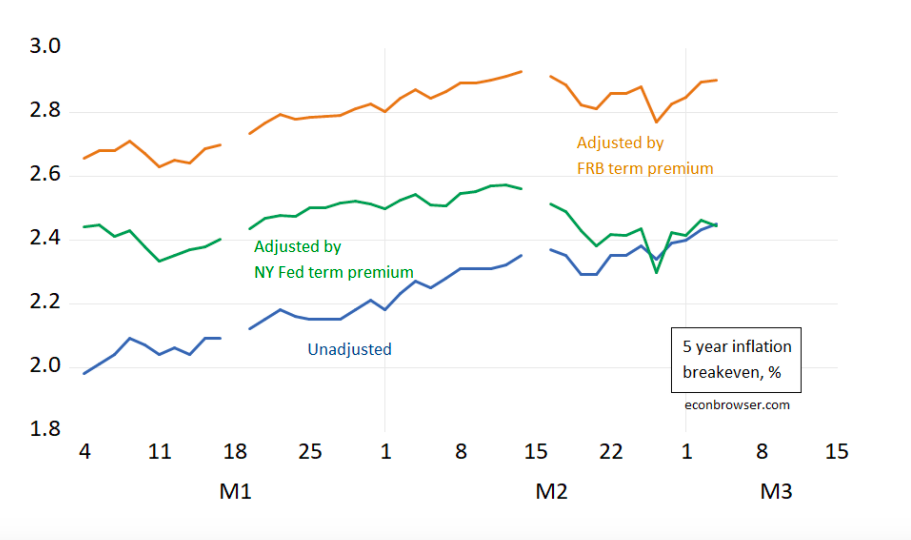
- “The five year constant maturity Treasury yield has risen; but after accounting for the estimated term premium, the increase is much more modest, if not negative. Moreover, expected 5 year inflation has not on net moved much over 2021.“
- Correction: One needs to also adjust for the liquidity premium.
- Source.
Long term currency movements
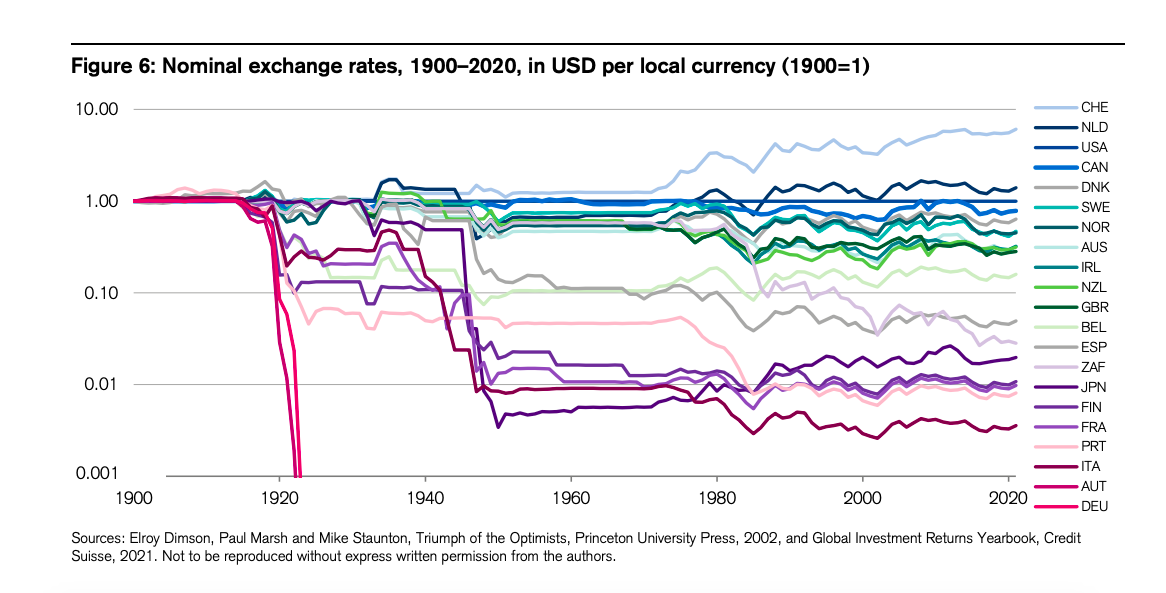
- This chart presents exchange rates against the US Dollar over a long period of time.
- The values are indexed to 1.0 in 1900.
- Over 121 years most currencies depreciated against the dollar.
- The number of Italian lira (then Euros) that could be bought with one US dollar is 280 times more now than in 1900 – a huge depreciation.
- Only the Swiss Franc has meaningfully appreciated against the dollar in this period.
Savings
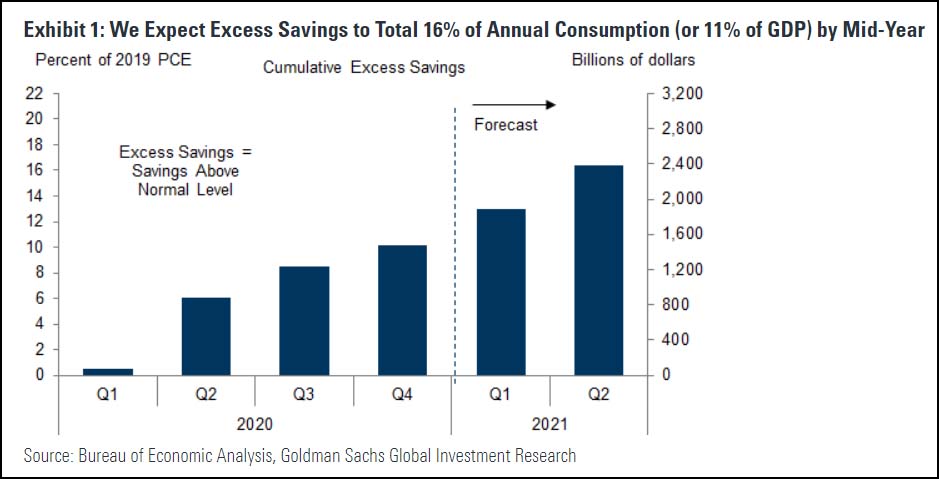
- There has been a colossal build up of savings at households.
- By Q2 Goldman’s expects this to be 11% of GDP.
- Many think this could be unleashed leading to a huge recovery.
- It is important not to view savings in one sector outside of the savings/dis-savings of other sectors (especially the government sector).
- This is an idea popularised by Richard Koo as a way to understand the great financial crisis.
Commodity Supercycle
- There is a lot of talk about a new commodity supercycle.
- This chart suggest it might be ending before it starts – remember China is the largest consumer of most commodities.
- After the boom decade a lot of this consumption is driven by the mini leverage and de-leverage cycles in China – summarised by a credit impulse.
- The latest measure of this credit impulse is turning down, which leads commodity prices by 12 months.
- h/t The Market Ear.
Housing Inventory
Covid Vaccine – Israel
- The country to watch right now re the real world effect of Covid vaccination is Israel.
- They have vaccinated 49% of the total population – far ahead of other countries.
- This is a nice collection of the country level statistics. All encouraging.
Bridgewater 2021 Outlook
- Always worth reading and listening to the famous macro fund’s outlook.
January PMIs
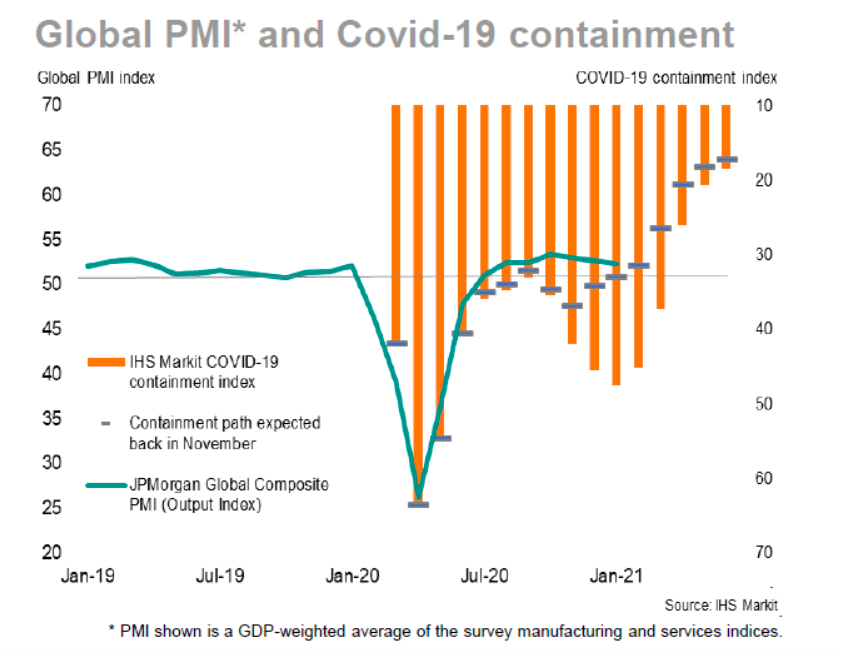
- Although JPM Global PMI index has been slipping for three months, at 52.3 it still indicates solid growth.
- Most interestingly as seen in the chart “the adverse impact on global GDP from the pandemic in recent months so far looks considerably less severe than seen during the first half of 2020“
Asking Rents
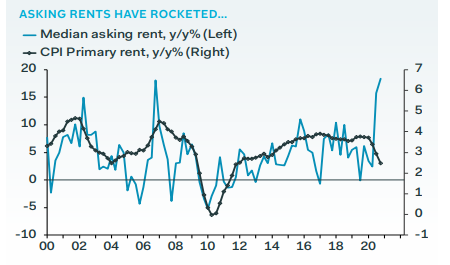
- Asking rents have spiked in the US but this is yet to translate to CPI (primary rents are >30% of total CPI).
Rates and Stock Returns
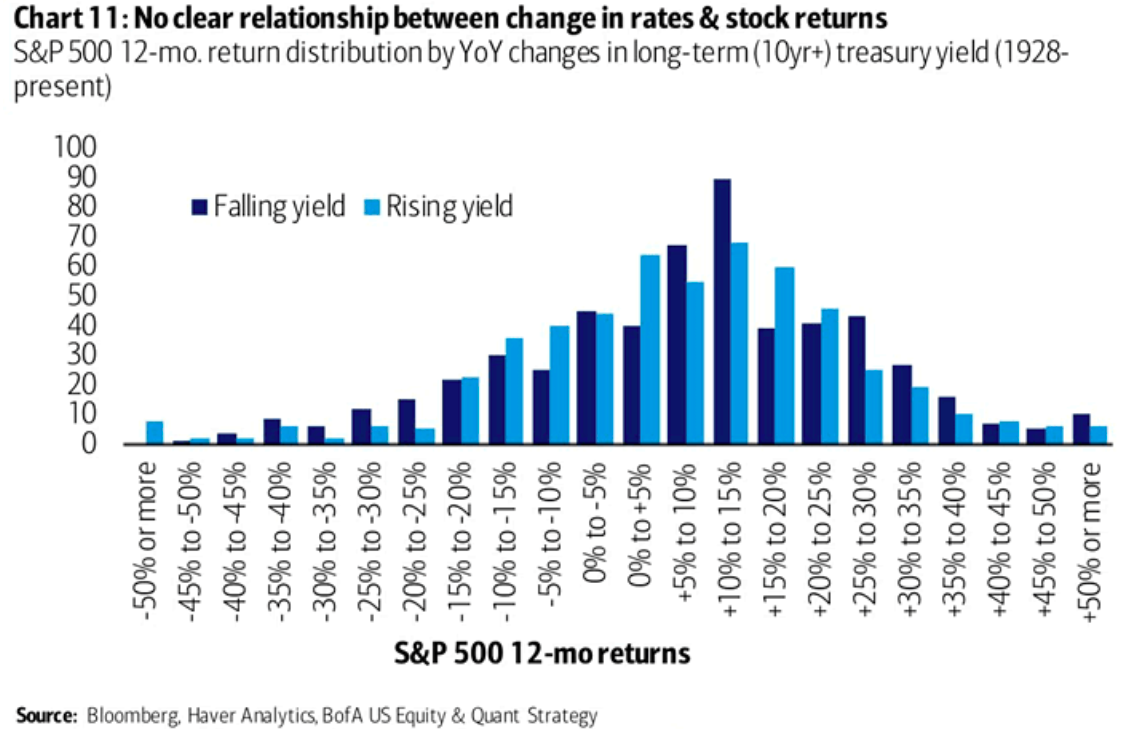
- This chart suggests there is no clear relationship between changes in rates (captured by 10-year treasury yield) and S&P 12 month returns using data from 1928 – today.


