- Amid the carnage probably worth remembering the boost the US consumer is getting.
- Low interest rates = savings on mortgage payments if one refinances.
- Low oil prices = cheaper to fill up the car.
Macroeconomics
Snippets on the big picture.

Covid ISM Survey
- ISM did a survey of US companies related to coronavirus.
- 75% of companies reported supply chain disruption.
- 12.8% have adjusted revenue targets downwards on average 5.6%.
- Manufacturers in China report operating at 50 percent capacity with 56 percent of normal staff.
Tourism
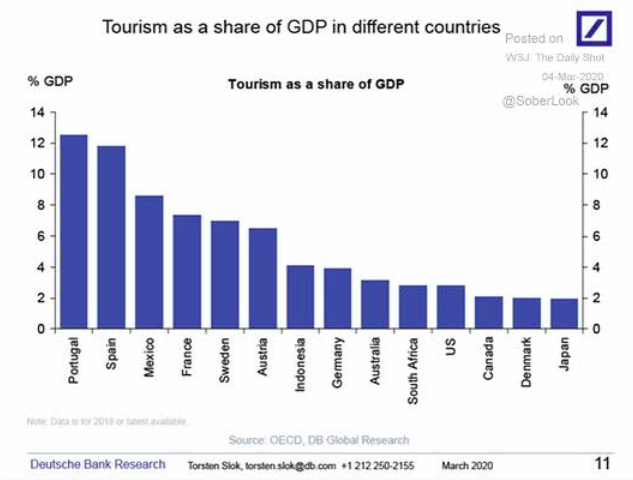
- Useful chart during the Covid shutdown – showing Tourism as a % of GDP of various countries.
Bridgewater on Coronavirus
- Month old post from Bridgewater on Coronavirus
- Still has relevant framework to think about the issue.
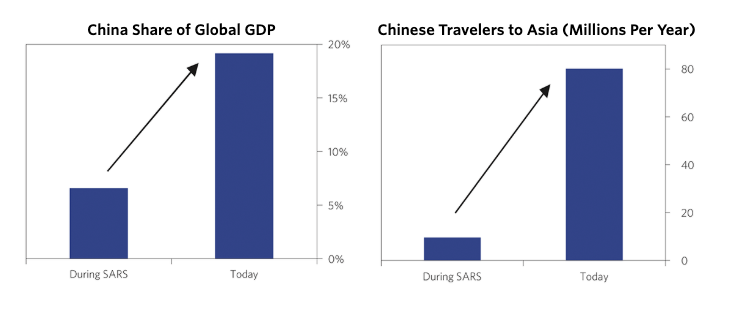
- This chart is worth keeping in mind – the economic impact is real and is far larger than during SARS.
UK Rebound?
- UK saw PMIs jump nicely.
- Also interesting to see the moderation of Brexit worries.

Dalio on Corona Virus
- Blog post from Dalio on his thoughts on the virus.
- Interesting he states that he isn’t an expert and doesn’t know anything.
- Still worth a read.
Dark Global PMIs
- PMIs, as expected, are showing a lot of weakness.
- Global PMI is down from 52.2 to 46.1 in February (right hand chart)
- The supply shock going on is also staggering (left hand chart).

Italy
- Big interesting read from Spiegel on Italy’s economic sluggishness.
- A nice ending.
- In parting, though, this correspondent nevertheless has hope that the Italians will stay true to their legendary talent for mastering crises with grandezza. The Italians have a wonderful saying for painful moments: “Ballando non duole il piede.” Your feet don’t hurt when you’re dancing.”
Value (cont.)
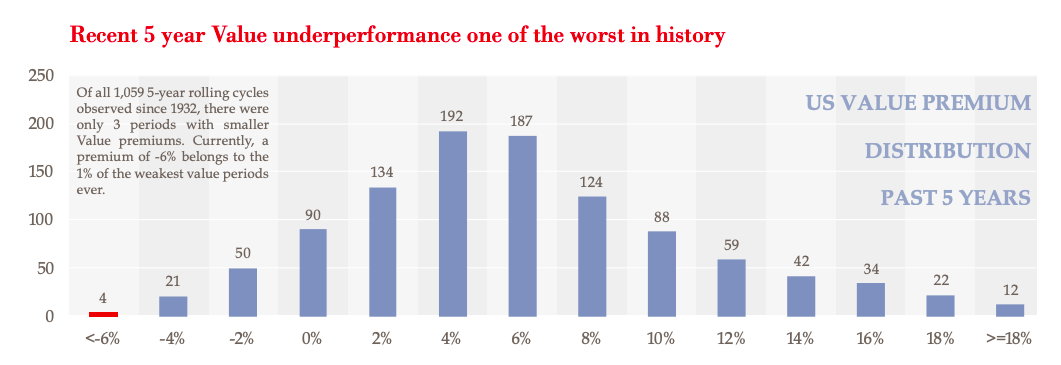
- “Of all 1,059 5-year rolling cycles observed since 1932, there are only 3 periods with smaller value premiums. The current -6% belongs to the 1% of the weakest periods”
- Typically this type of underperformance has led to 14-19% outperformance in the subsequent 5 years.
Equity Drawdowns by Country
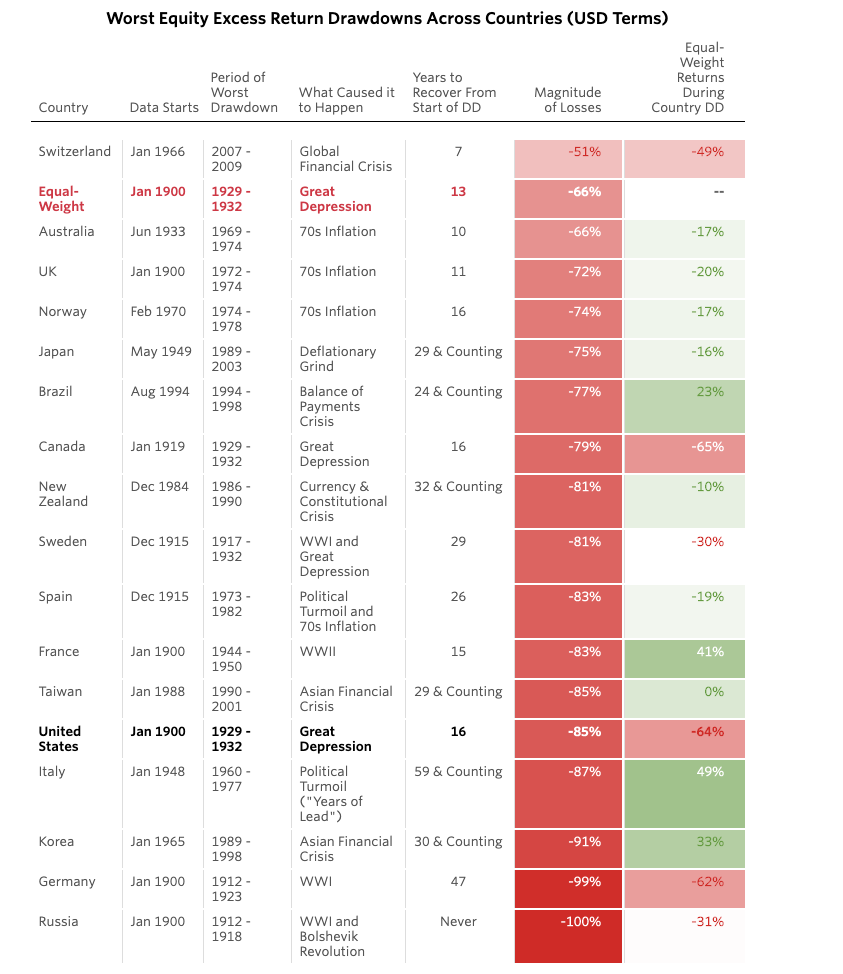
- Chart from Bridgewater of the worst equity drawdowns (declines in equity markets) by country.
- The final column shows if one equal weighted geographically that one’s returns would be much better.
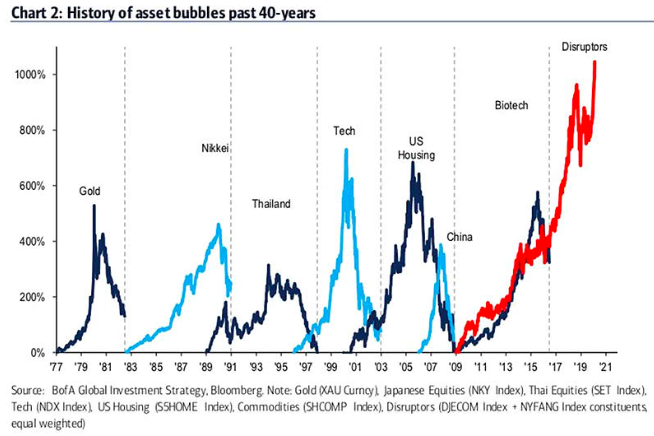
History of Asset Bubbles
- A history of asset bubbles from Bank of America.
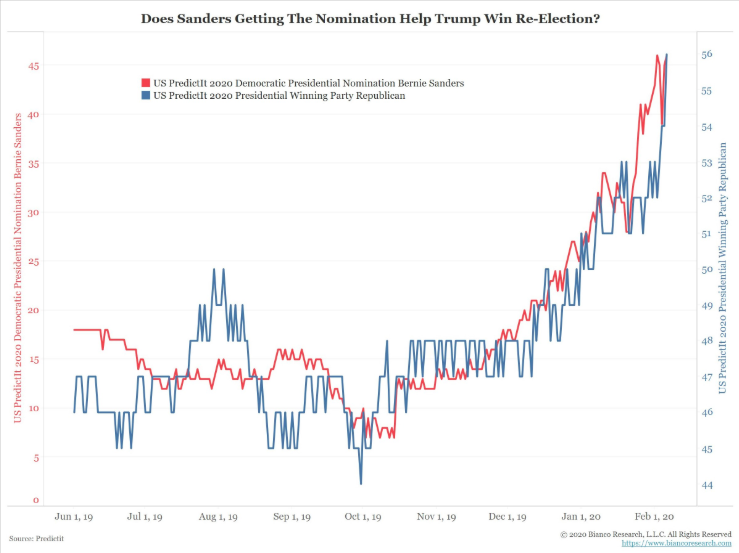
Bernie gain = Trump gain
- Interesting chart that shows as Sanders gains so does Trump’s re-election probability.
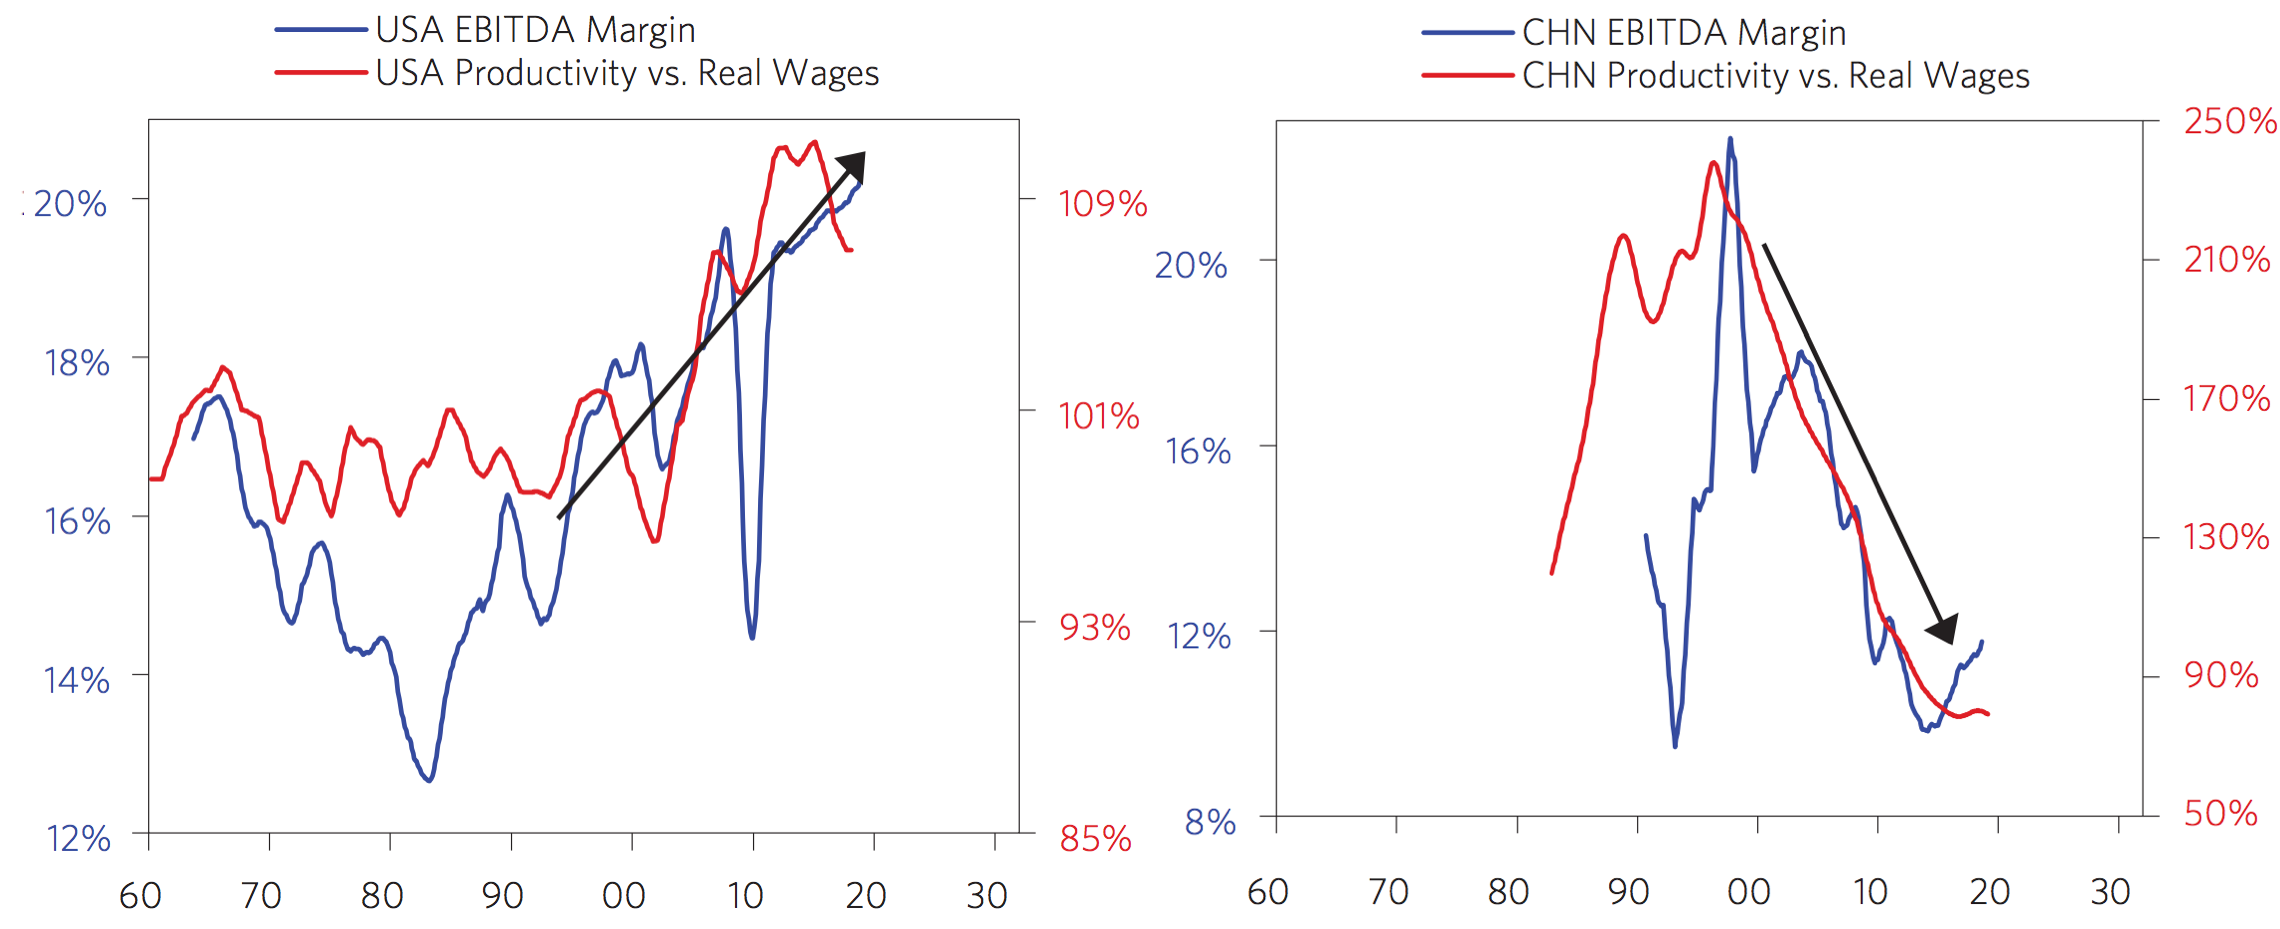
Labour vs. Profits
- A great set of charts from Bridgewater Research.
- The left hand shows how US company profit margins have trended up largely thanks to productivity gains outpacing real wage growth.
- In other words profits rise because workers are getting paid a smaller share of the output they produce.
- Part of this is due to wages being driven down globally by the emergence of China (right hand chart).
- China has seen rising wages outpacing productivity growth and hence companies grabbing a smaller share.
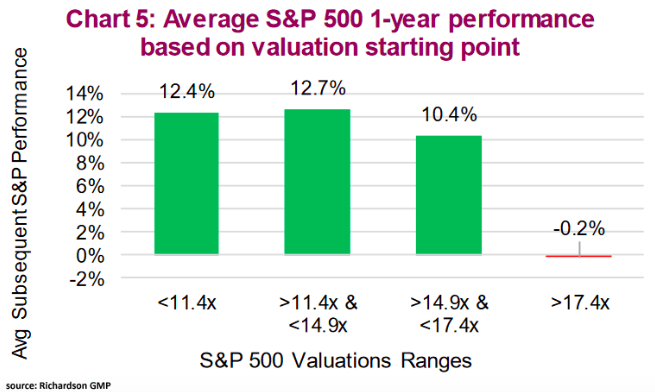
Valuation and Returns
- This is an interesting chart that shows the performance of the S&P 500 index by different valuation levels.
- Based on data since 1935.
- The current valuation is 18x P/E.
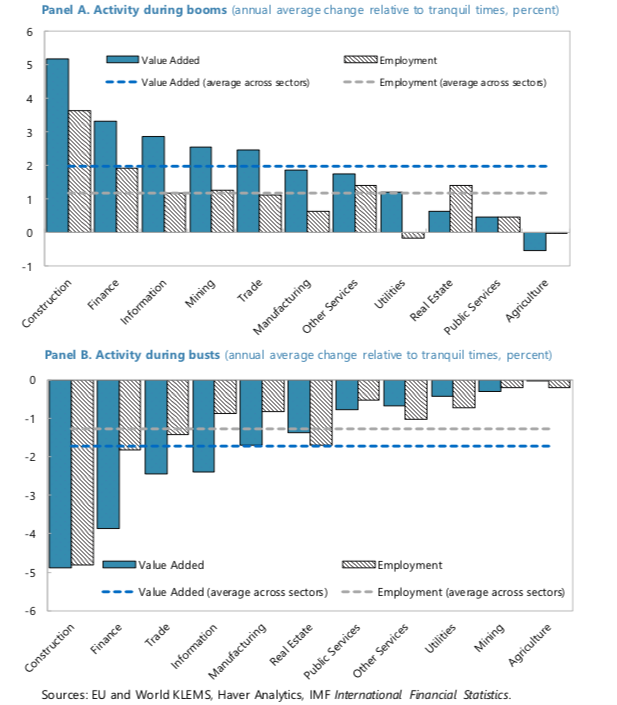
Construction
- Interesting post from FT Alphaville about construction.
- It discusses a recent IMF note which shows that the construction sector is often a great canary in the coal mine of economic activity.
- “An additional percentage point of value-added or employment growth in the construction sector during a boom raises the probability of the boom being bad—followed by subpar economic performance or a systemic financial crisis—by 2 and 5 percentage points, respectively.“
- “Strikingly, in our sample, long-lasting booms that featured rapid construction growth never ended well.”
- Interesting point that because inflation doesn’t account for housing costs properly the central banks will always be behind the curve.
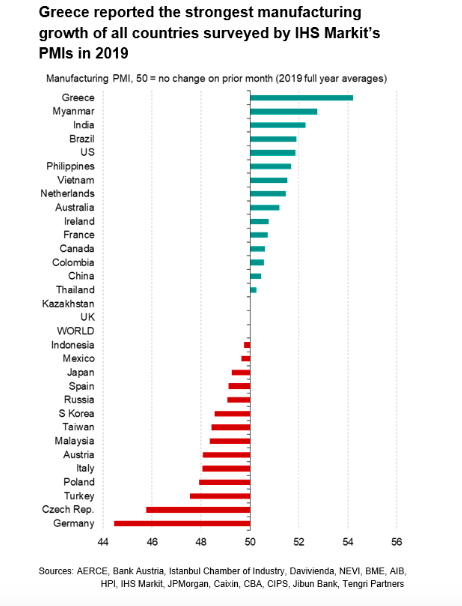
2019 Top Manufacturing Growth
- A ranking of all PMIs by country in 2019.
- Greece comes top. Explains the rally in Greek assets in 2019.
- Germany at the bottom.
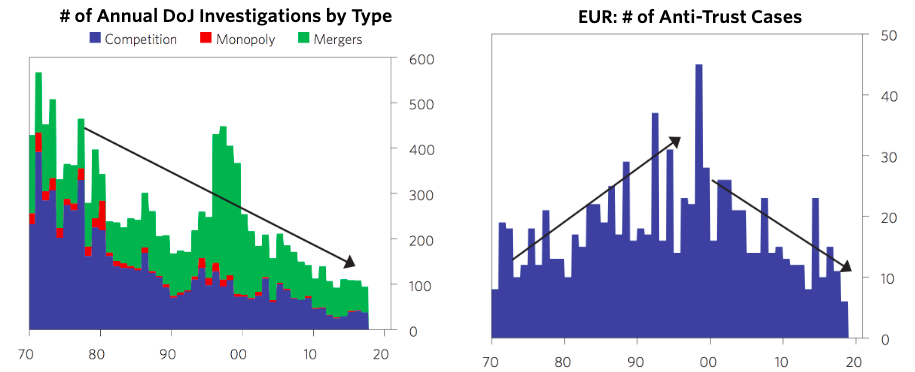
Competition
- The two interesting charts from Bridgewater’s Research.
- They show a gradual relaxation of policies targeting competition among firms.
- This allows larger or dominant firms to form.
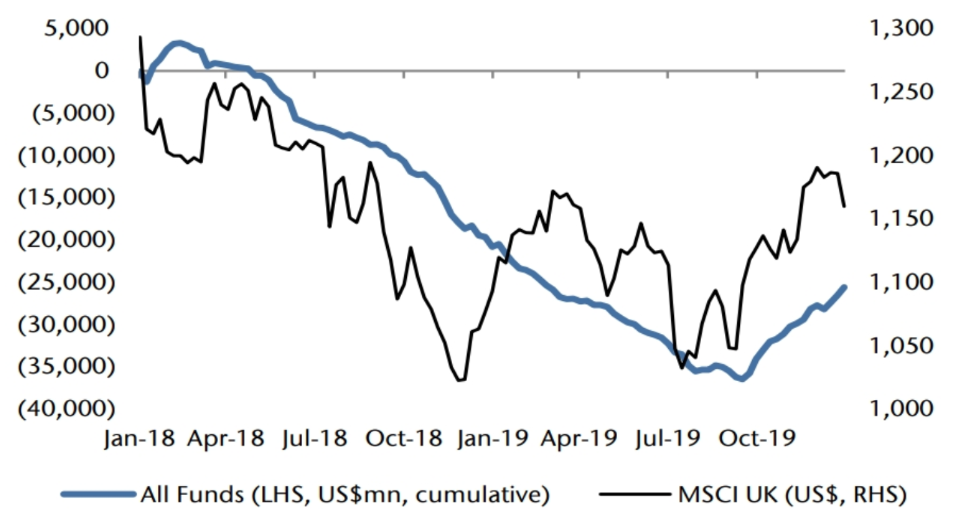
UK
- Fund flows look to have bottomed.
- Not everyone is positive.
- “The U.K. remains – the cork is still in the bottle. It didn’t go off last Friday [Election day]. Money is still sitting on the sidelines. I think it may start to come, but I don’t think we’d be calling that as like the last Friday doesn’t – is only the beginning, not the end. And there are other challenges in the U.K. market, so the U.K. is probably the area across the industry which is the most difficult at the moment.” JanusHenderson CFO
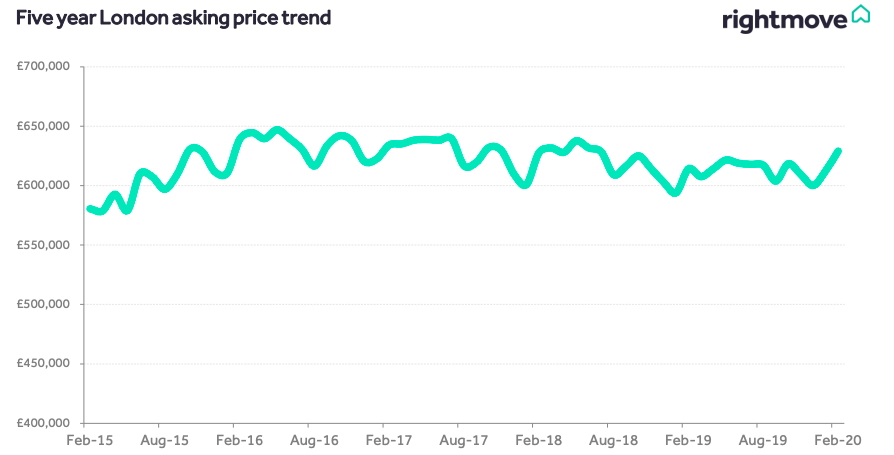
London House Prices
- Rightmove report out for February on UK and London house prices.
- “London’s recovery continues with new-year momentum pushing up prices and sales numbers, and finally encouraging more sellers to come to market … Better market encourages new sellers, with the 1.6% increase in the number of newly marketed properties being the first rise compared to the prior year for 16 months.”
US Gallup Survey
- Interesting chart from the latest Gallup Poll.
- Americans’ optimism about their personal finances has climbed to levels not seen in more than 16 years, with 69% now saying they expect to be financially better off “at this time next year.”
