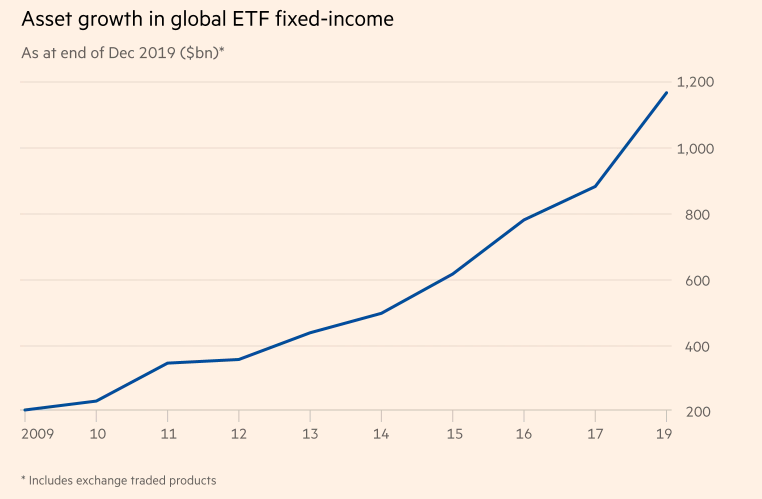
- We have previously written about the risks building form the rising popularity of bond ETFs.
- This article argues the opposite – more ETFs = more trading in bonds = liquidity.
- We take issue with these arguments. An inspection of two bond etf prices shows you that they have mostly marched upwards (e.g. LQD, VCIT).
- As ETFs go up they create more units and are willing buyers in bond markets. This of course creates liquidity.
- The main issue will be on the downside – if something goes wrong, ETFs, en masse as they follow pre-set rules, will sell and there won’t be anyone on the other side.
Macroeconomics
Snippets on the big picture.
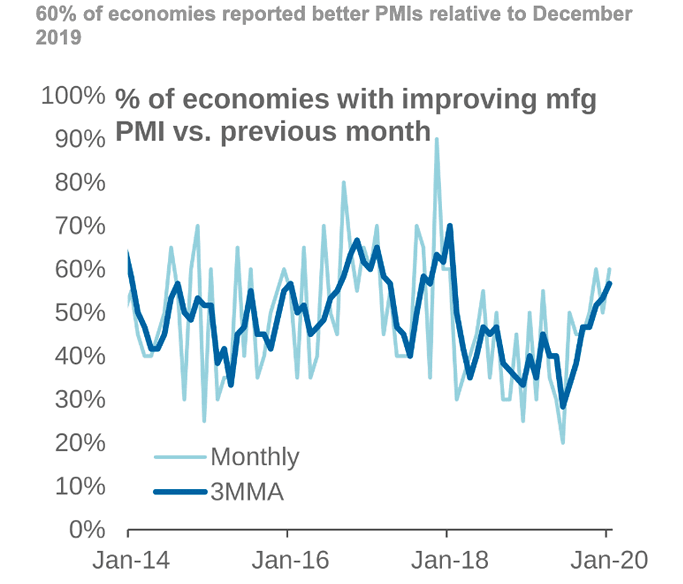
PMIs Improving
- This chart shows that some 60% of economies are seeing improving manufacturing PMIs vs. December – a bullish sign.
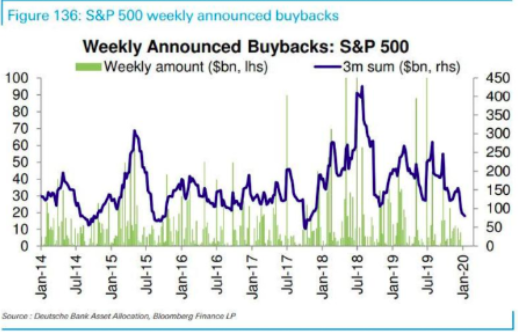
Buybacks
- Buyback activity by US companies has fallen.
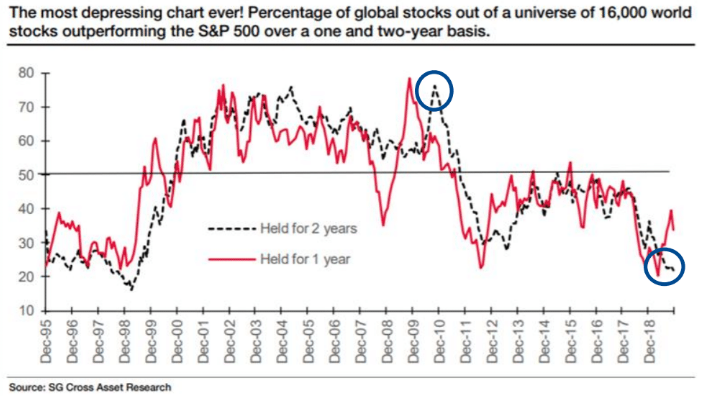
Outperformance is hard
- This chart from Soc Gen shows that over the past two years out of a total of 16,000 public companies world wide only 20% have outperformed the S&P 500.
- The peak was 70% a decade ago.
Germany
- This is a really good article on Germany. h/t The Browser.
- It really gets to the crux of the country’s success.
- In 1993 they ran a $20bn deficit and now that is a surplus of over $200bn (inflation adjusted).
- Worth a read for any economist and puts into perspective the trade-war going on right now.
- “The takeaway — from this whole 6,000 word essay — is that Germany has done insanely well for itself since the creation and adoption of the Euro and the European Single Market by pursuing a strategy of Export-driven Industrial production that is considered impossible in any other developed, high-GDP, high-population, high-wage-paying nation.“
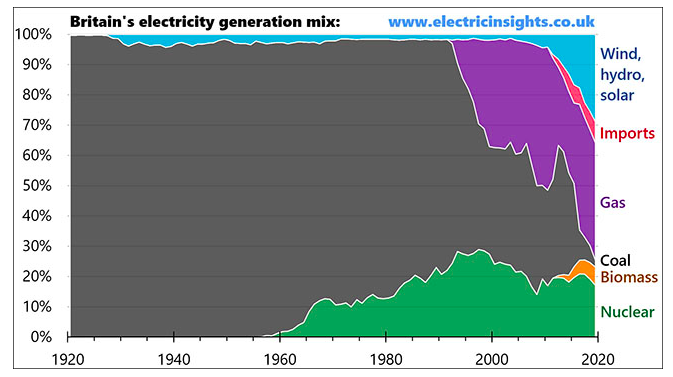
UK Electricity Mix
- Amazing how quickly it changed.
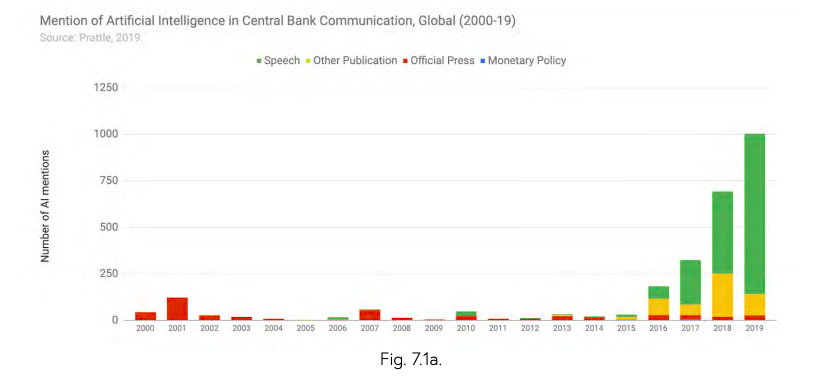
Artificial Intelligence (cont)
- Even central banks are getting in on the game.
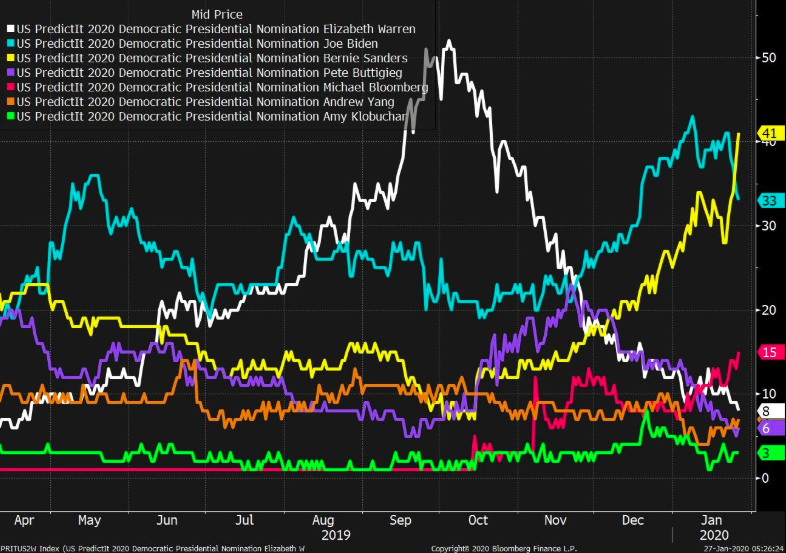
US Election
- Worth keeping an eye on betting markets.
- Sanders has recently overtaken Biden for the Democratic nomination.
Bond ETFs
Business Cycle Indicators
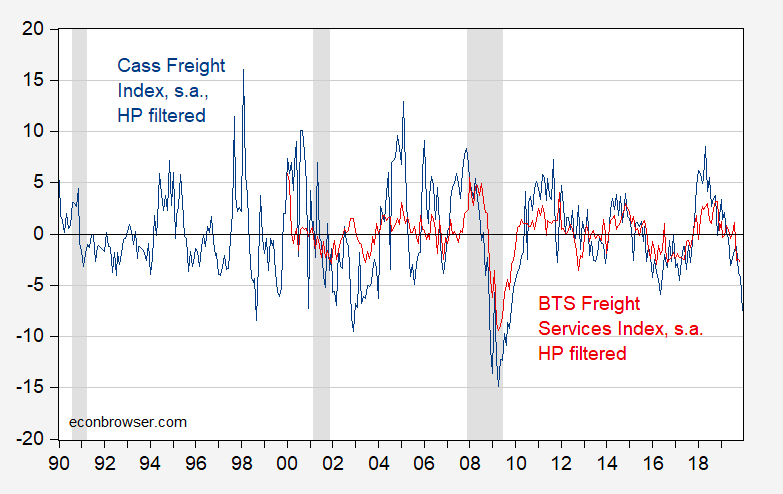
- Interestingly freight data in the US continues to be weak.
- “Both the shipments and expenditures components of the Cass Freight Index marked their lowest reading of 2019 and took another step backwards in terms of y/y growth. There is lots of hope in the stock market and the freight market for a better 2020, but the trends have yet to turn.”
- Source.
Market Sentiment Indicators
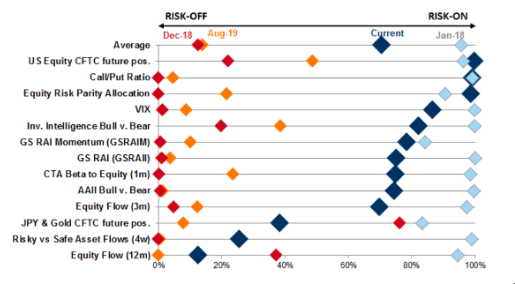
- Great chart showing where all the sentiment indicators are.
- It suggests that things are exuberant but not at excessive levels.
Leading Indicator
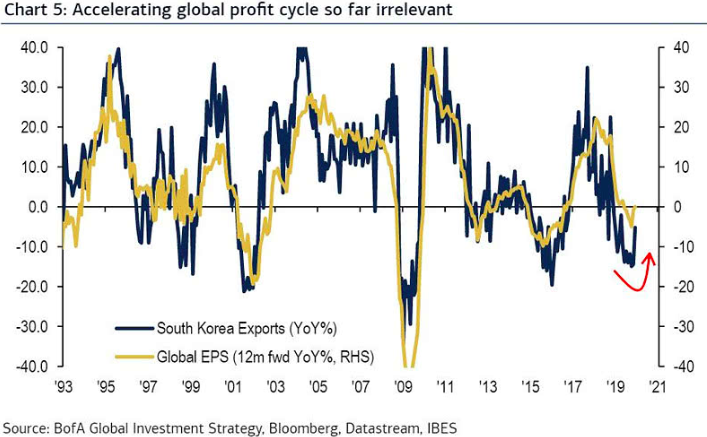
- South Korea, an export focussed high tech economy, tends to be very economically sensitive.
- This means it is a good leading indicator in terms of companies around the world.
- This chart shows just that – it correlates exports from Korea and Global earnings per share (EPS).
- The trend has turned more positive.
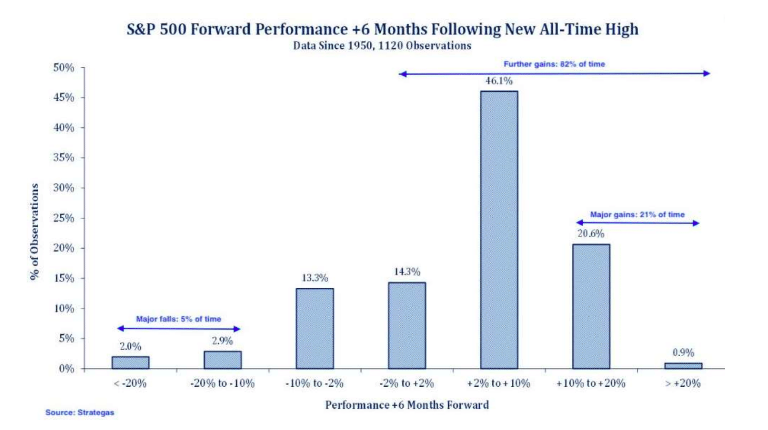
S&P Returns post highs
- Great table showing that 82% of the time the S&P makes further gains 6 months after hitting an all time high.
- 21% of the time these gains can be rather large.
- Stay bullish?
Research Spending
- Science and Research are a very long term game.
- This is a striking chart from Nature using data assembled by the National Science Foundation.
- It shows that China is rapidly closing the gap on the US in terms of science spending.
- “Preliminary data from 2019 suggest that China has already surpassed the United States in R&D spending“

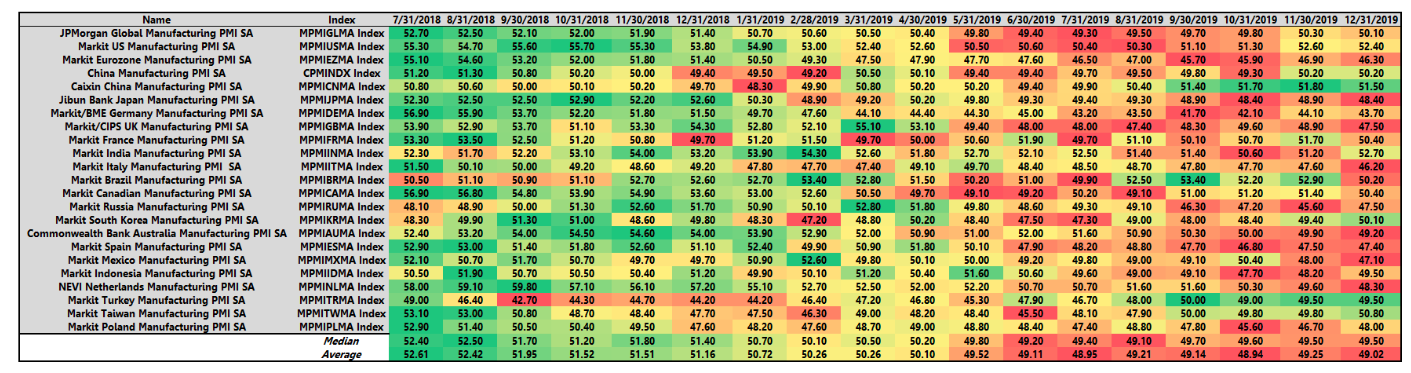
PMI Heat Map – Updated
- Global PMI heat map starting to bottom out.
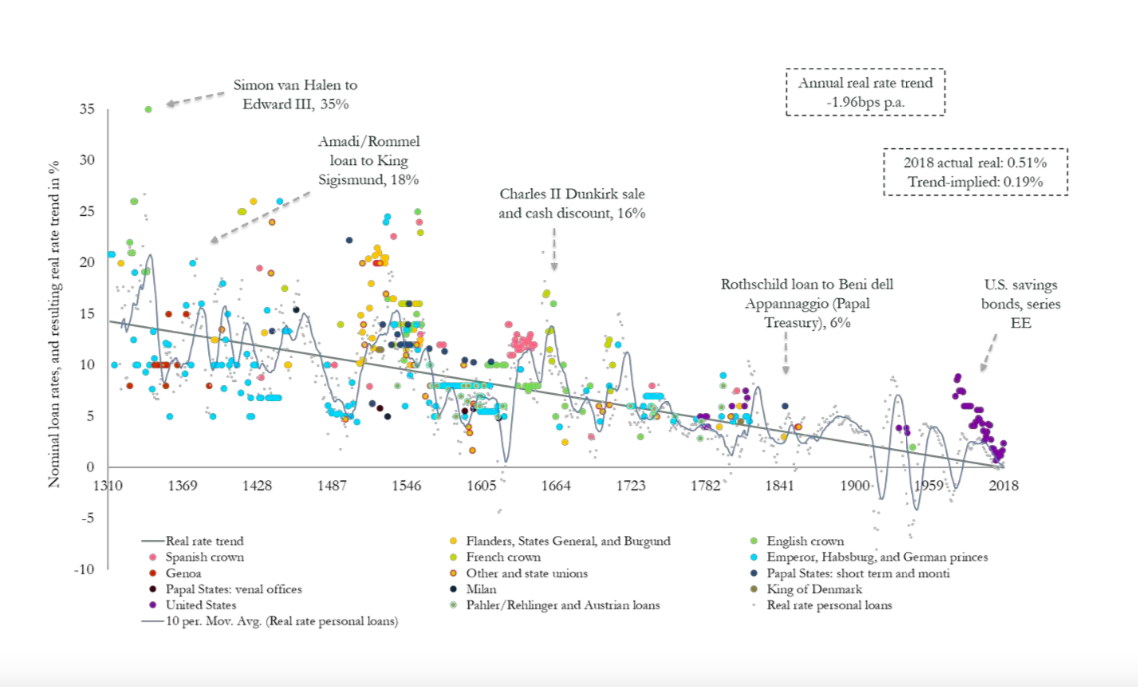
Very Long Term Real Rates
- Bank of England have done a big long term study of real interest rates.
- Paints a picture of ‘suprasecular‘ decline.
- “Against their long‑term context, currently depressed sovereign real rates are in fact converging ‘back to historical trend’ — a trend that makes narratives about a ‘secular stagnation’ environment entirely misleading, and suggests that — irrespective of particular monetary and fiscal responses — real rates could soon enter permanently negative territory.“
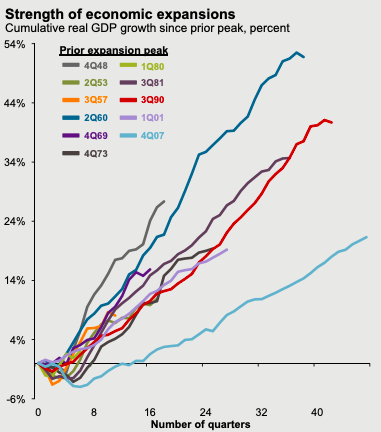
Economic Expansions
- This is a chart from JPM 2020 Outlook of post-war economic expansions.
- The thing not to forget about the current (Q4 07) expansion, which is running into a record 126 months, is how shallow it is vs. others.
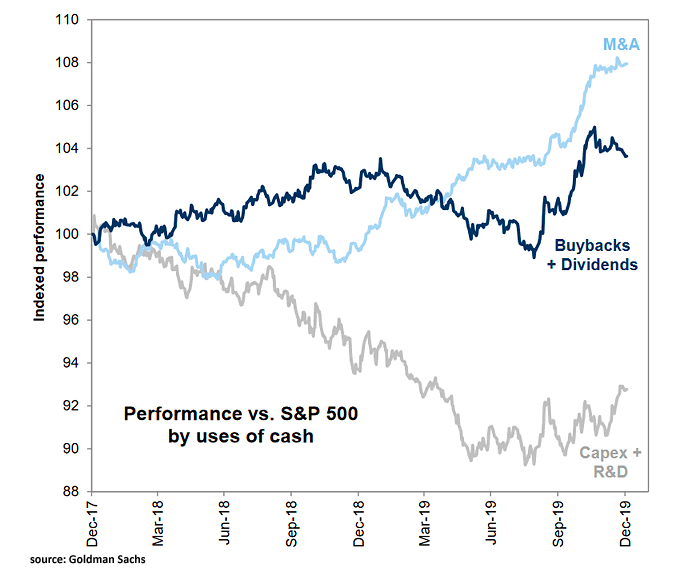
S&P Stocks by Use of Capital
- Interesting chart showing the performance of three buckets of S&P 500 based on their use of capital since December 2017.
- Suggests the stock market hasn’t rewarded reinvestment.
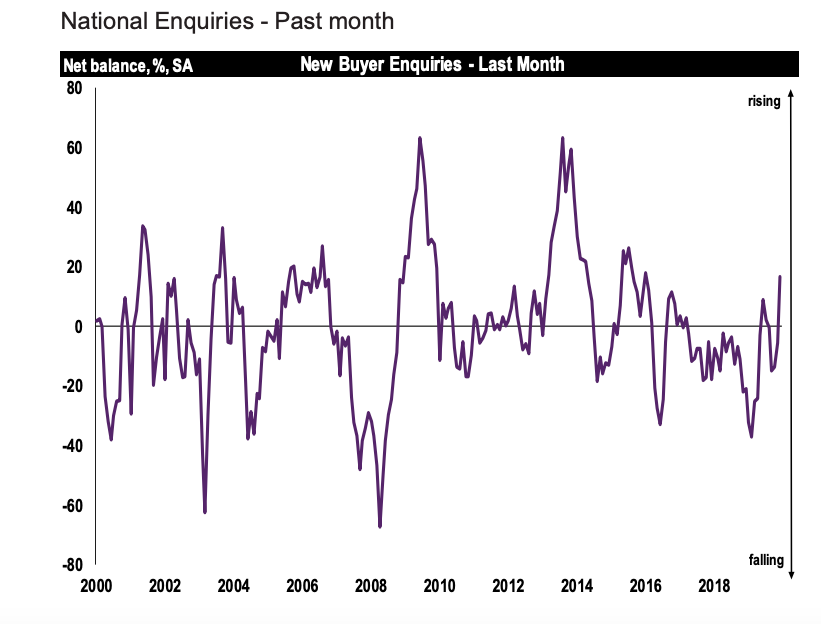
RICS Survey for UK
- December post-election RICS survey was rather positive.
- JPM write via Alphaville – The RICS survey, which was post election, “showed a marked and regionally broad-based improvement in its forward looking questions,” says JP Morgan Cazenove. “The expected prices balance leapt from 1 to 23, expected sales shot up from 13 to 31 and new buyer enquiries surged from -5 to 17. These are comfortably the highest levels reported since before the referendum and, in one reading, have swung from below to above their long-run averages.”
- Full charts in the link.
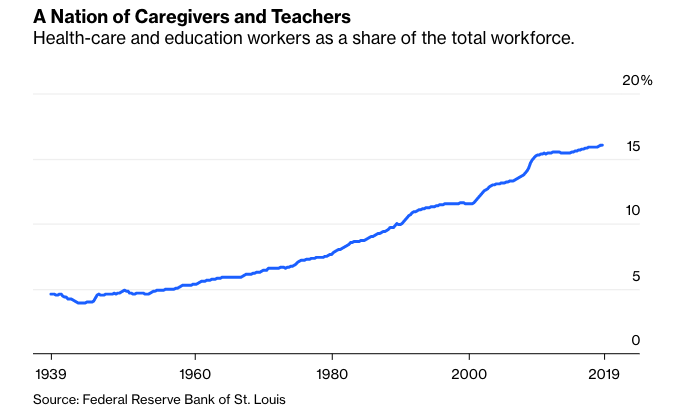
Health and Education
- Rather staggering growth in the % of the US economy dedicated to healthcare and education.
- These two activities account for 15% of jobs.