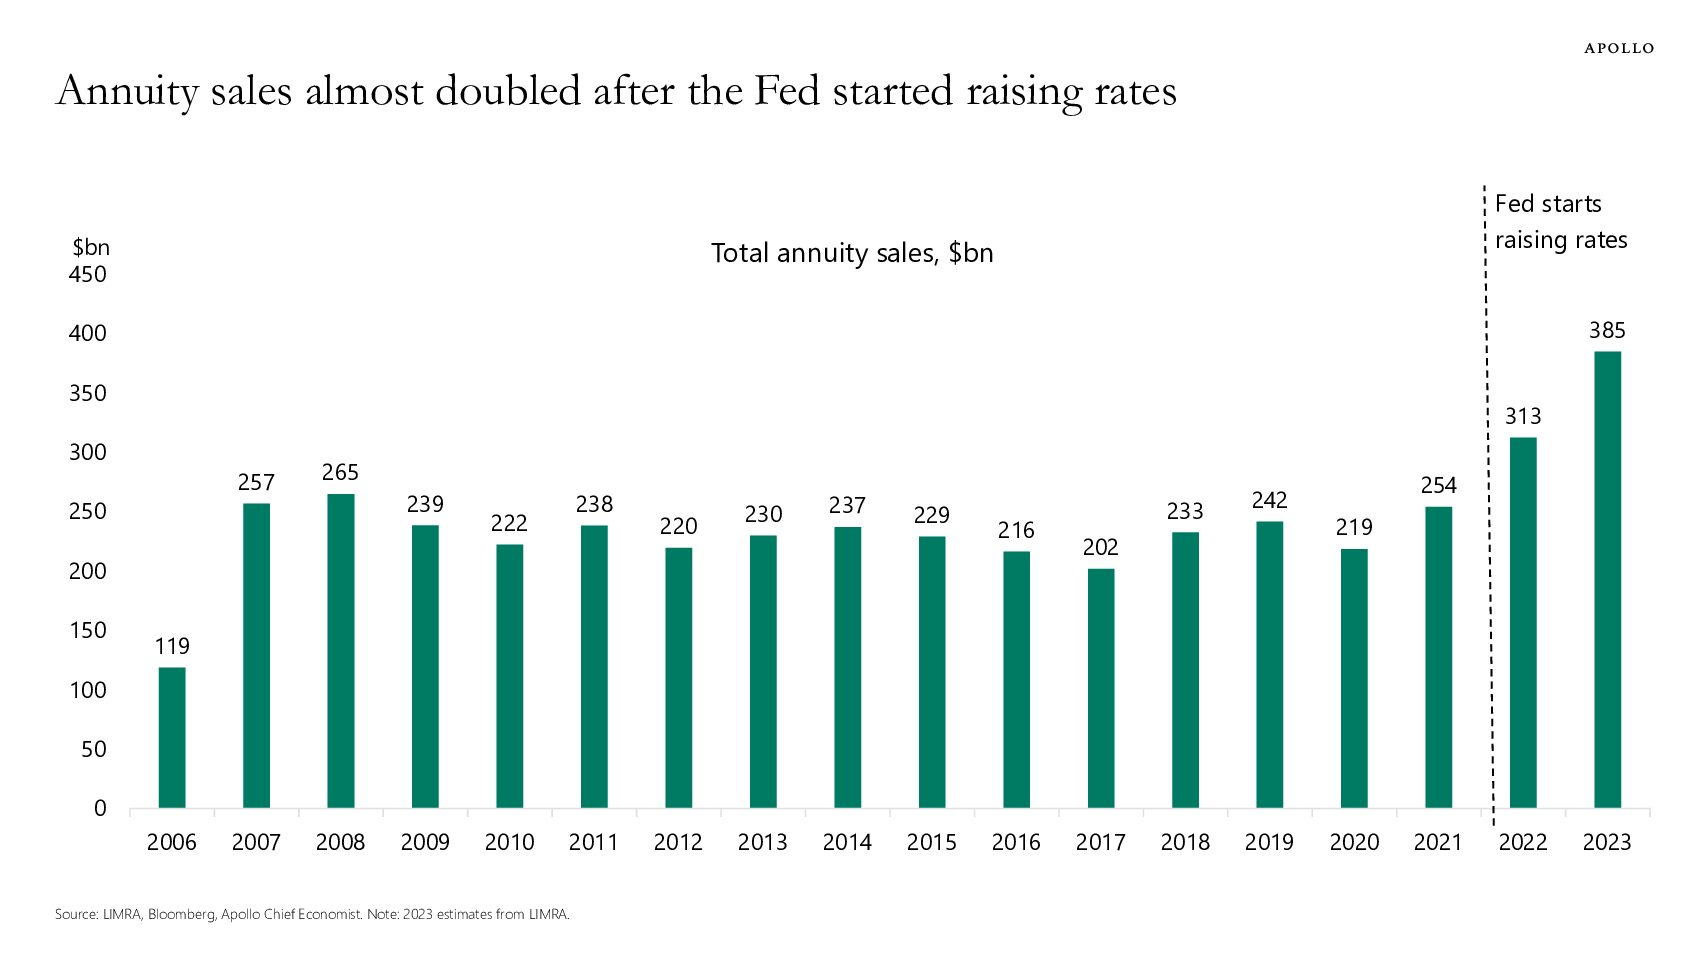
- “Annuity sales are almost double their pre-pandemic levels because of higher interest rates. And strong annuity sales create strong demand for credit, see chart below.“
Misc
Miscellaneous is often where the gems are.
Inequality in the UK
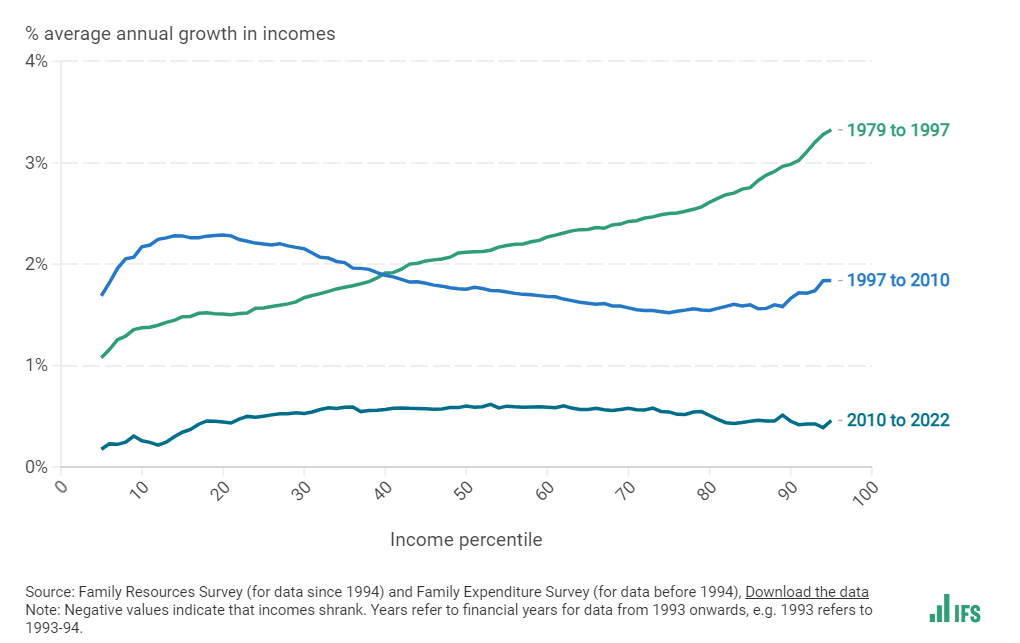
- Nice page from IFS on how income inequality, living standards and poverty are evolving.
- This one, in particular, is interesting – “Another way to see how income inequality has changed over time is the following chart – known as a ‘growth incidence curve’. This shows the average annual percentage growth in incomes at each percentile of the income distribution, for selected time periods.“
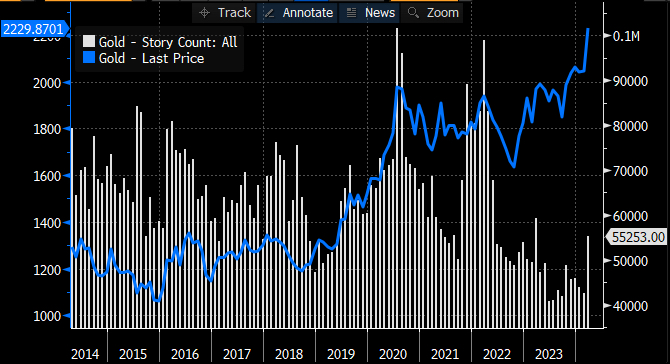
Unloved Gold Bull Market
Investment Cognitive Dissonance
- “We believe even modest amounts of leverage is risky…
…but large concentrated bets like being 100% in equities are just peachy keen“ - Among the list of beliefs that the investment community holds simultaneously that are at odds.
Why is the VIX so low?
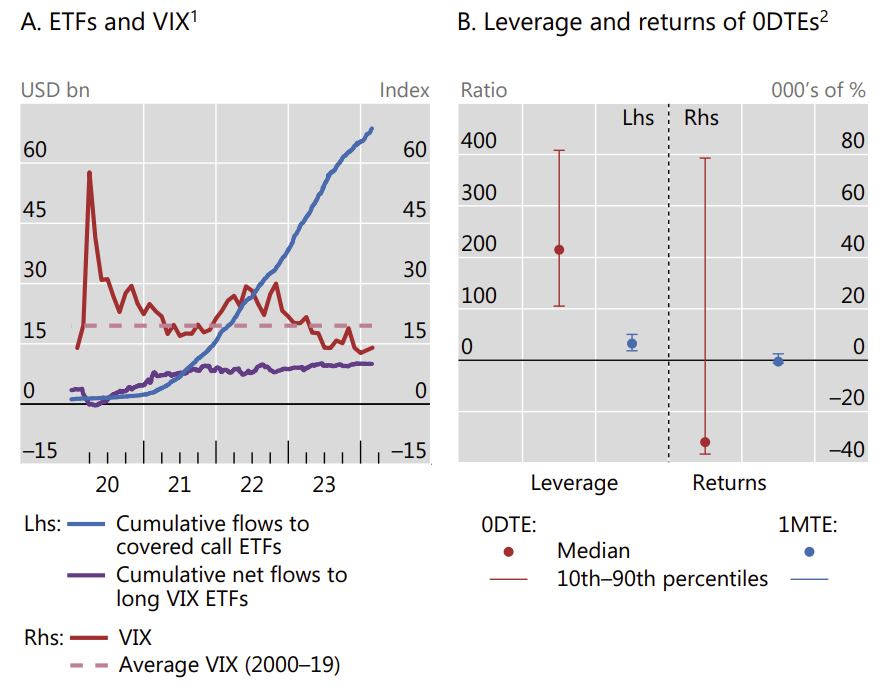
- Latest BIS quarterly thinks it is not because of the rise of 0DTE options (those that expire the same day). This week these hit a new record volume share at 57%.
- Rather the rise of yield-enhancing ETFs that sell options (in various forms) is the real culprit – see lhs of chart. JPM has some further analysis via FT.
- While on the topic of 0DTE the rhs chart shows their truly lottery-like payoff structure.
- “Investing in 0DTE options loses money on average, with annualised returns of -32,000%, but on rare occasions generates extremely high returns of up to 79,000%. These returns are much more volatile than the returns on one-month options, which have an average return of -550% annualised and a maximum of 2,500%.”
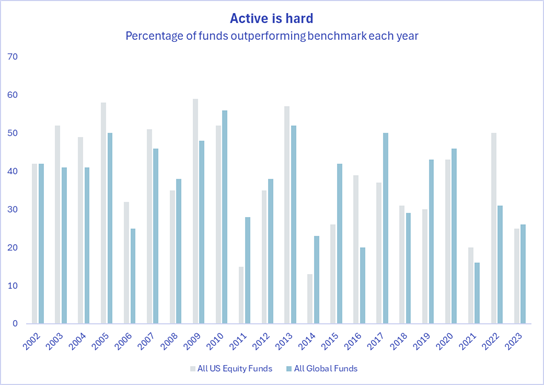
Active Management is Hard
- “Only 25% of all US equity funds beat their benchmark in 2023. Just 26% of global funds.”
- Normally S&P charts just US large cap managers – interesting to see it by all US equity funds and global funds.
- Source: FT, Chart from Maurits Pot Tema ETFs.
US Navy vs. PLAN
- People’s Liberation Army Navy, when it comes to quantity, is on track to overtake the US.
- Their shipbuilding capacity is wildly more dominant – controlling 40% of the world’s commercial shipbuilding market compared to just 0.5% for the US.
- This article argues that the US Navy still has quality – but that might erode and “quantity eventually improves quality”.

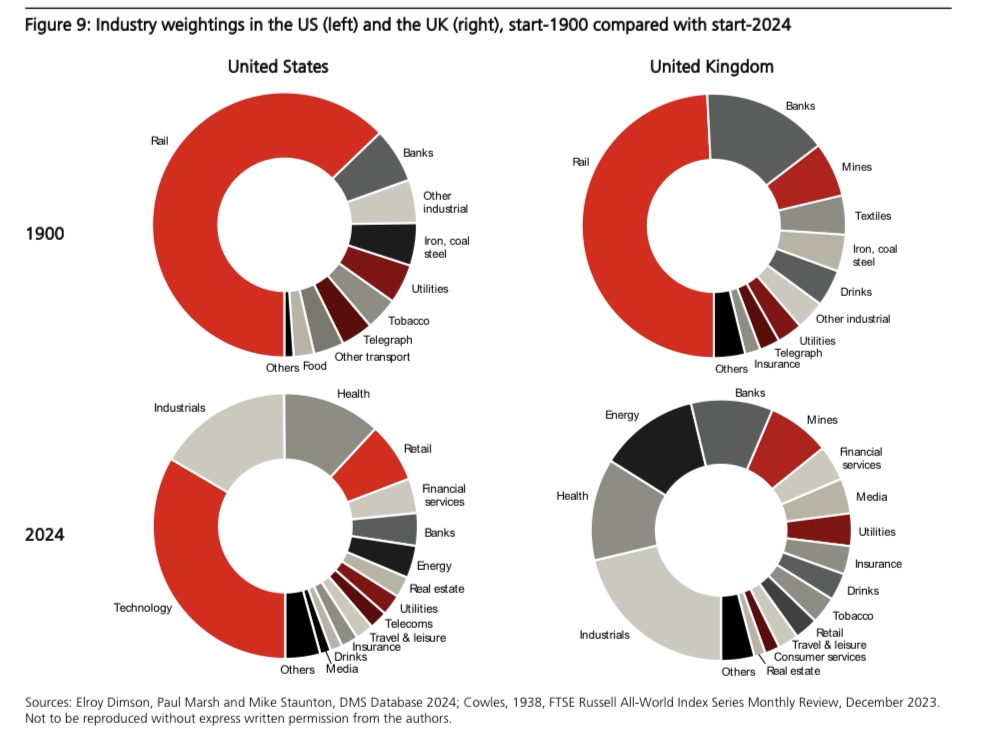
1900 vs. 2024
- Let this sink in – “Of the US firms listed in 1900, some 80% of their value was in industries that are small or extinct today; the UK figure is 65%“
- Many of these industries have simply moved to lower-cost countries.
- “Yet similarities between 1900 and 2024 are also apparent. The banking and insurance industries continue to be important. Similarly, such industries as food, beverages (including alcohol), tobacco, and utilities were present in 1900 and continue to be represented today. In the UK, quoted mining companies were important in 1900 just as they are in London today“
- Source: UBS.
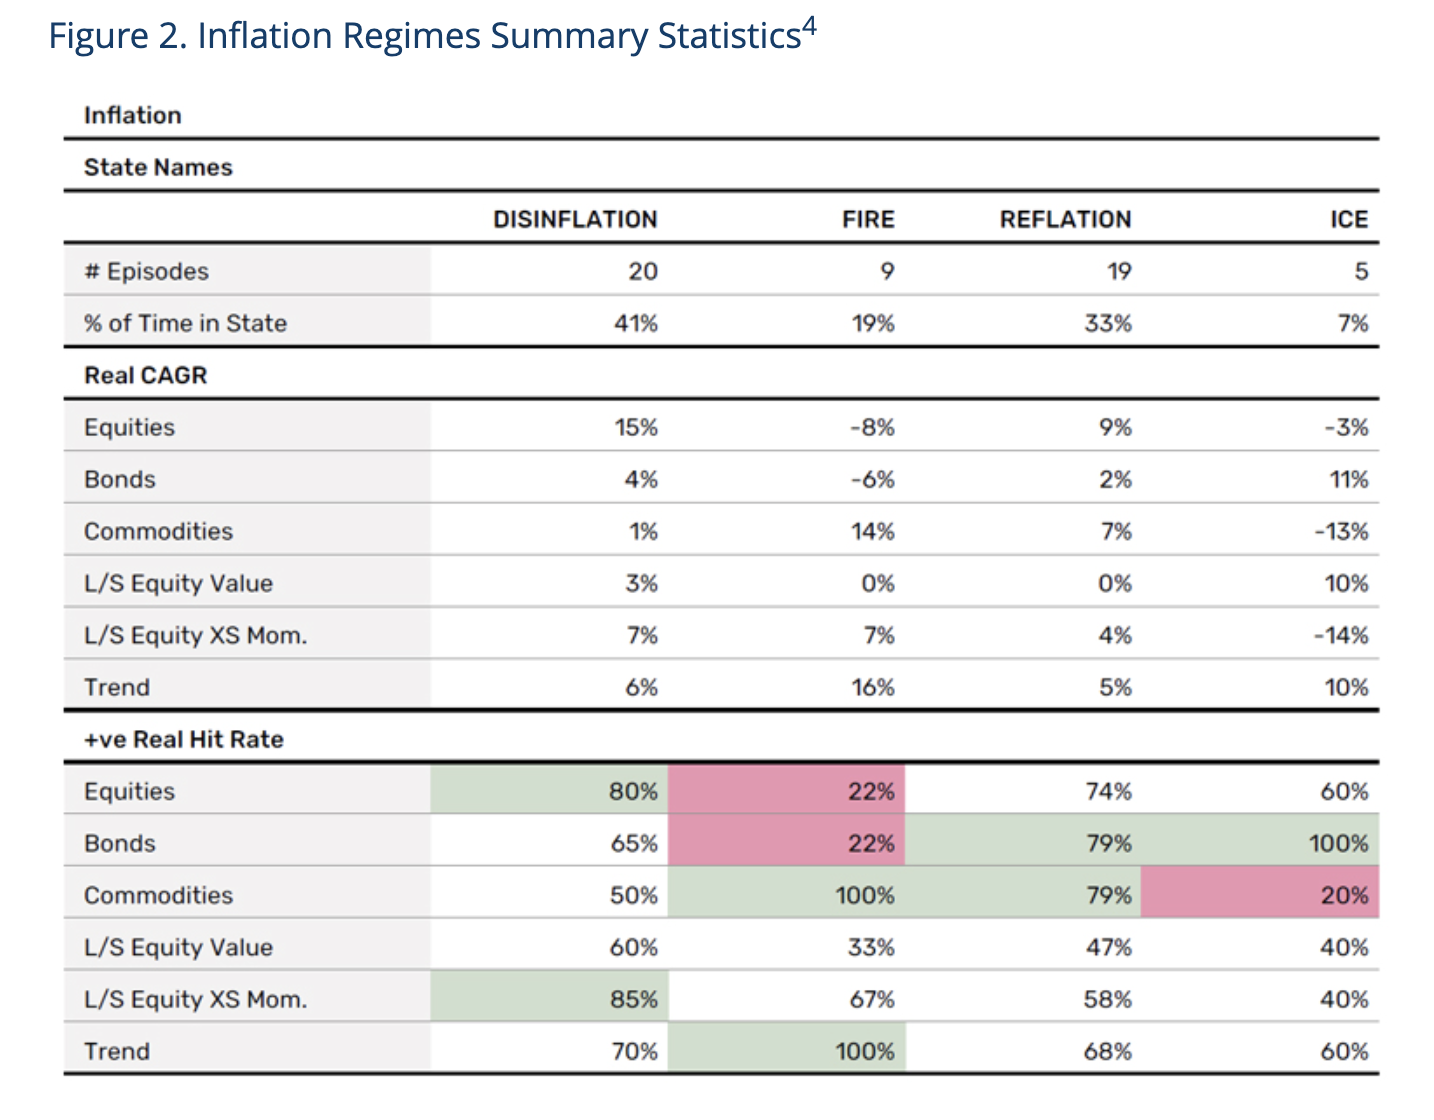
Regime Investing
- “Inflation is probably the most predictable of the regime frameworks, in terms of the magnitude of returns and the persistence of direction. If you are only allowed to use one economic datapoint to guide your decisions, US headline CPI should be it.“
- Equity bull markets are 80% of history. Don’t forget the simple lessons…
- Man group’s team tries to study whether investment regimes exist and whether one can profit from them.
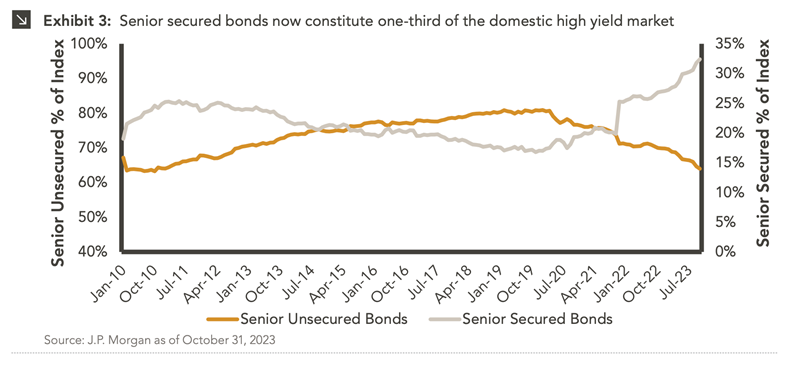
Secured High Yield
- “Senior secured bonds have always been a constituent of the high yield market. However, over the past few years, their share of the overall index has increased dramatically and is now at a record level of the market. While the coupon structure is different, senior secured bonds are “secured” by the assets of the borrower, much like leveraged loans. This recent development — the growth of senior secured bonds as an overall percentage of the high yield market — blurs the lines between these markets and may lead to increasingly similar behavior between the markets.”
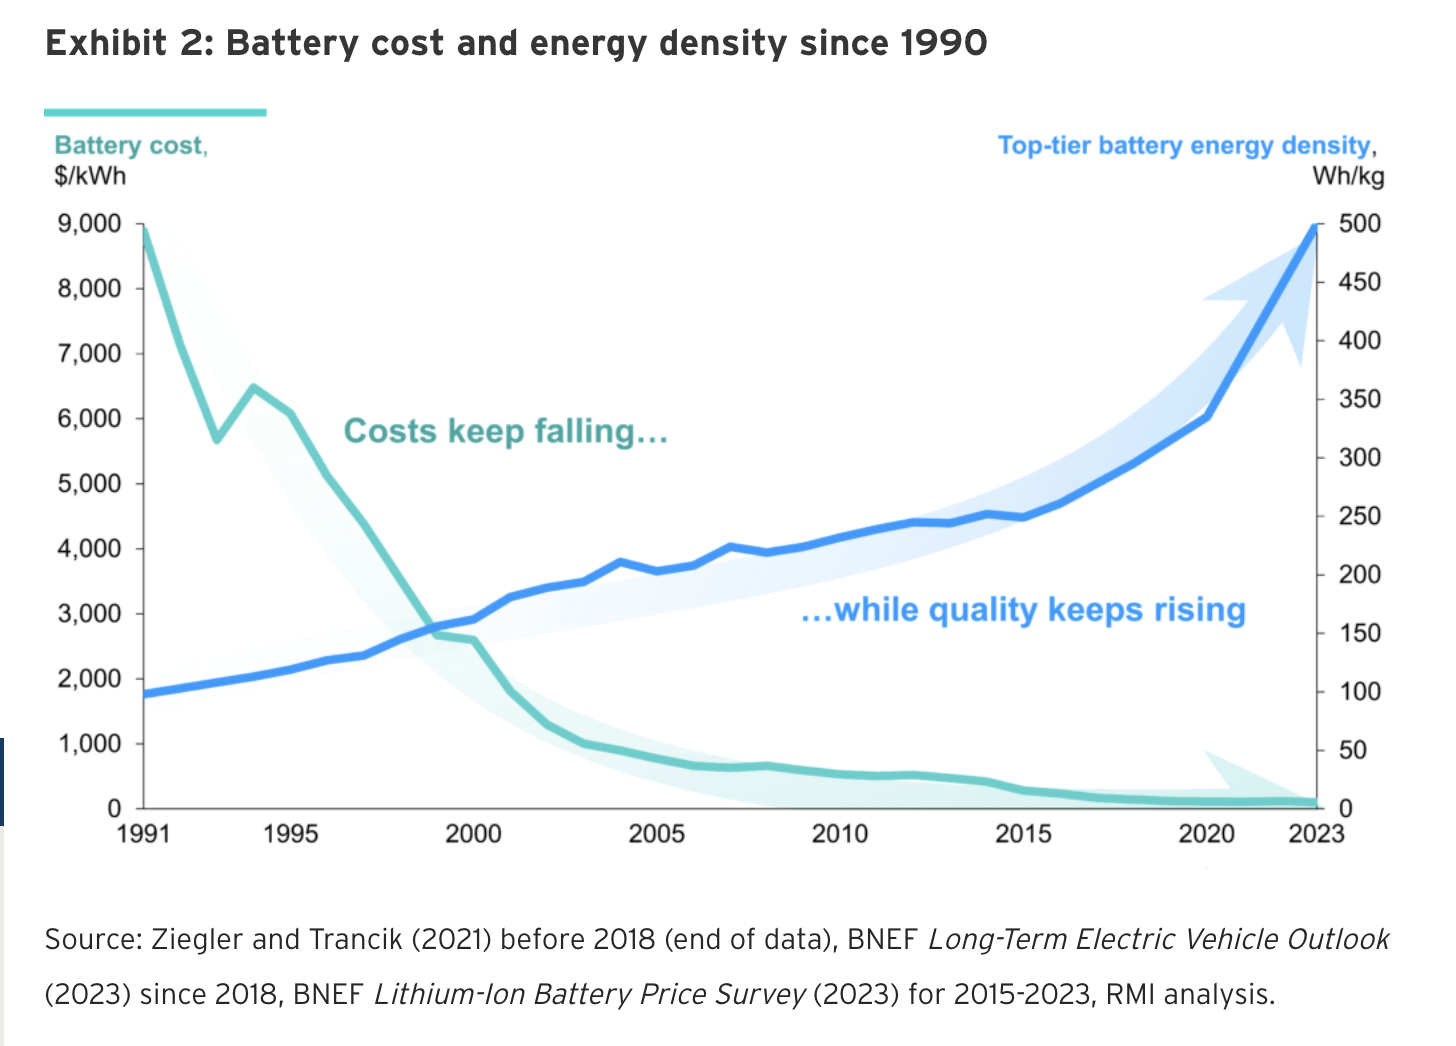
Battery Tech
- “Over the past 30 years, battery costs have fallen by a dramatic 99 percent; meanwhile, the density [a key measure of quality] of top-tier cells has risen fivefold.”
- Source.
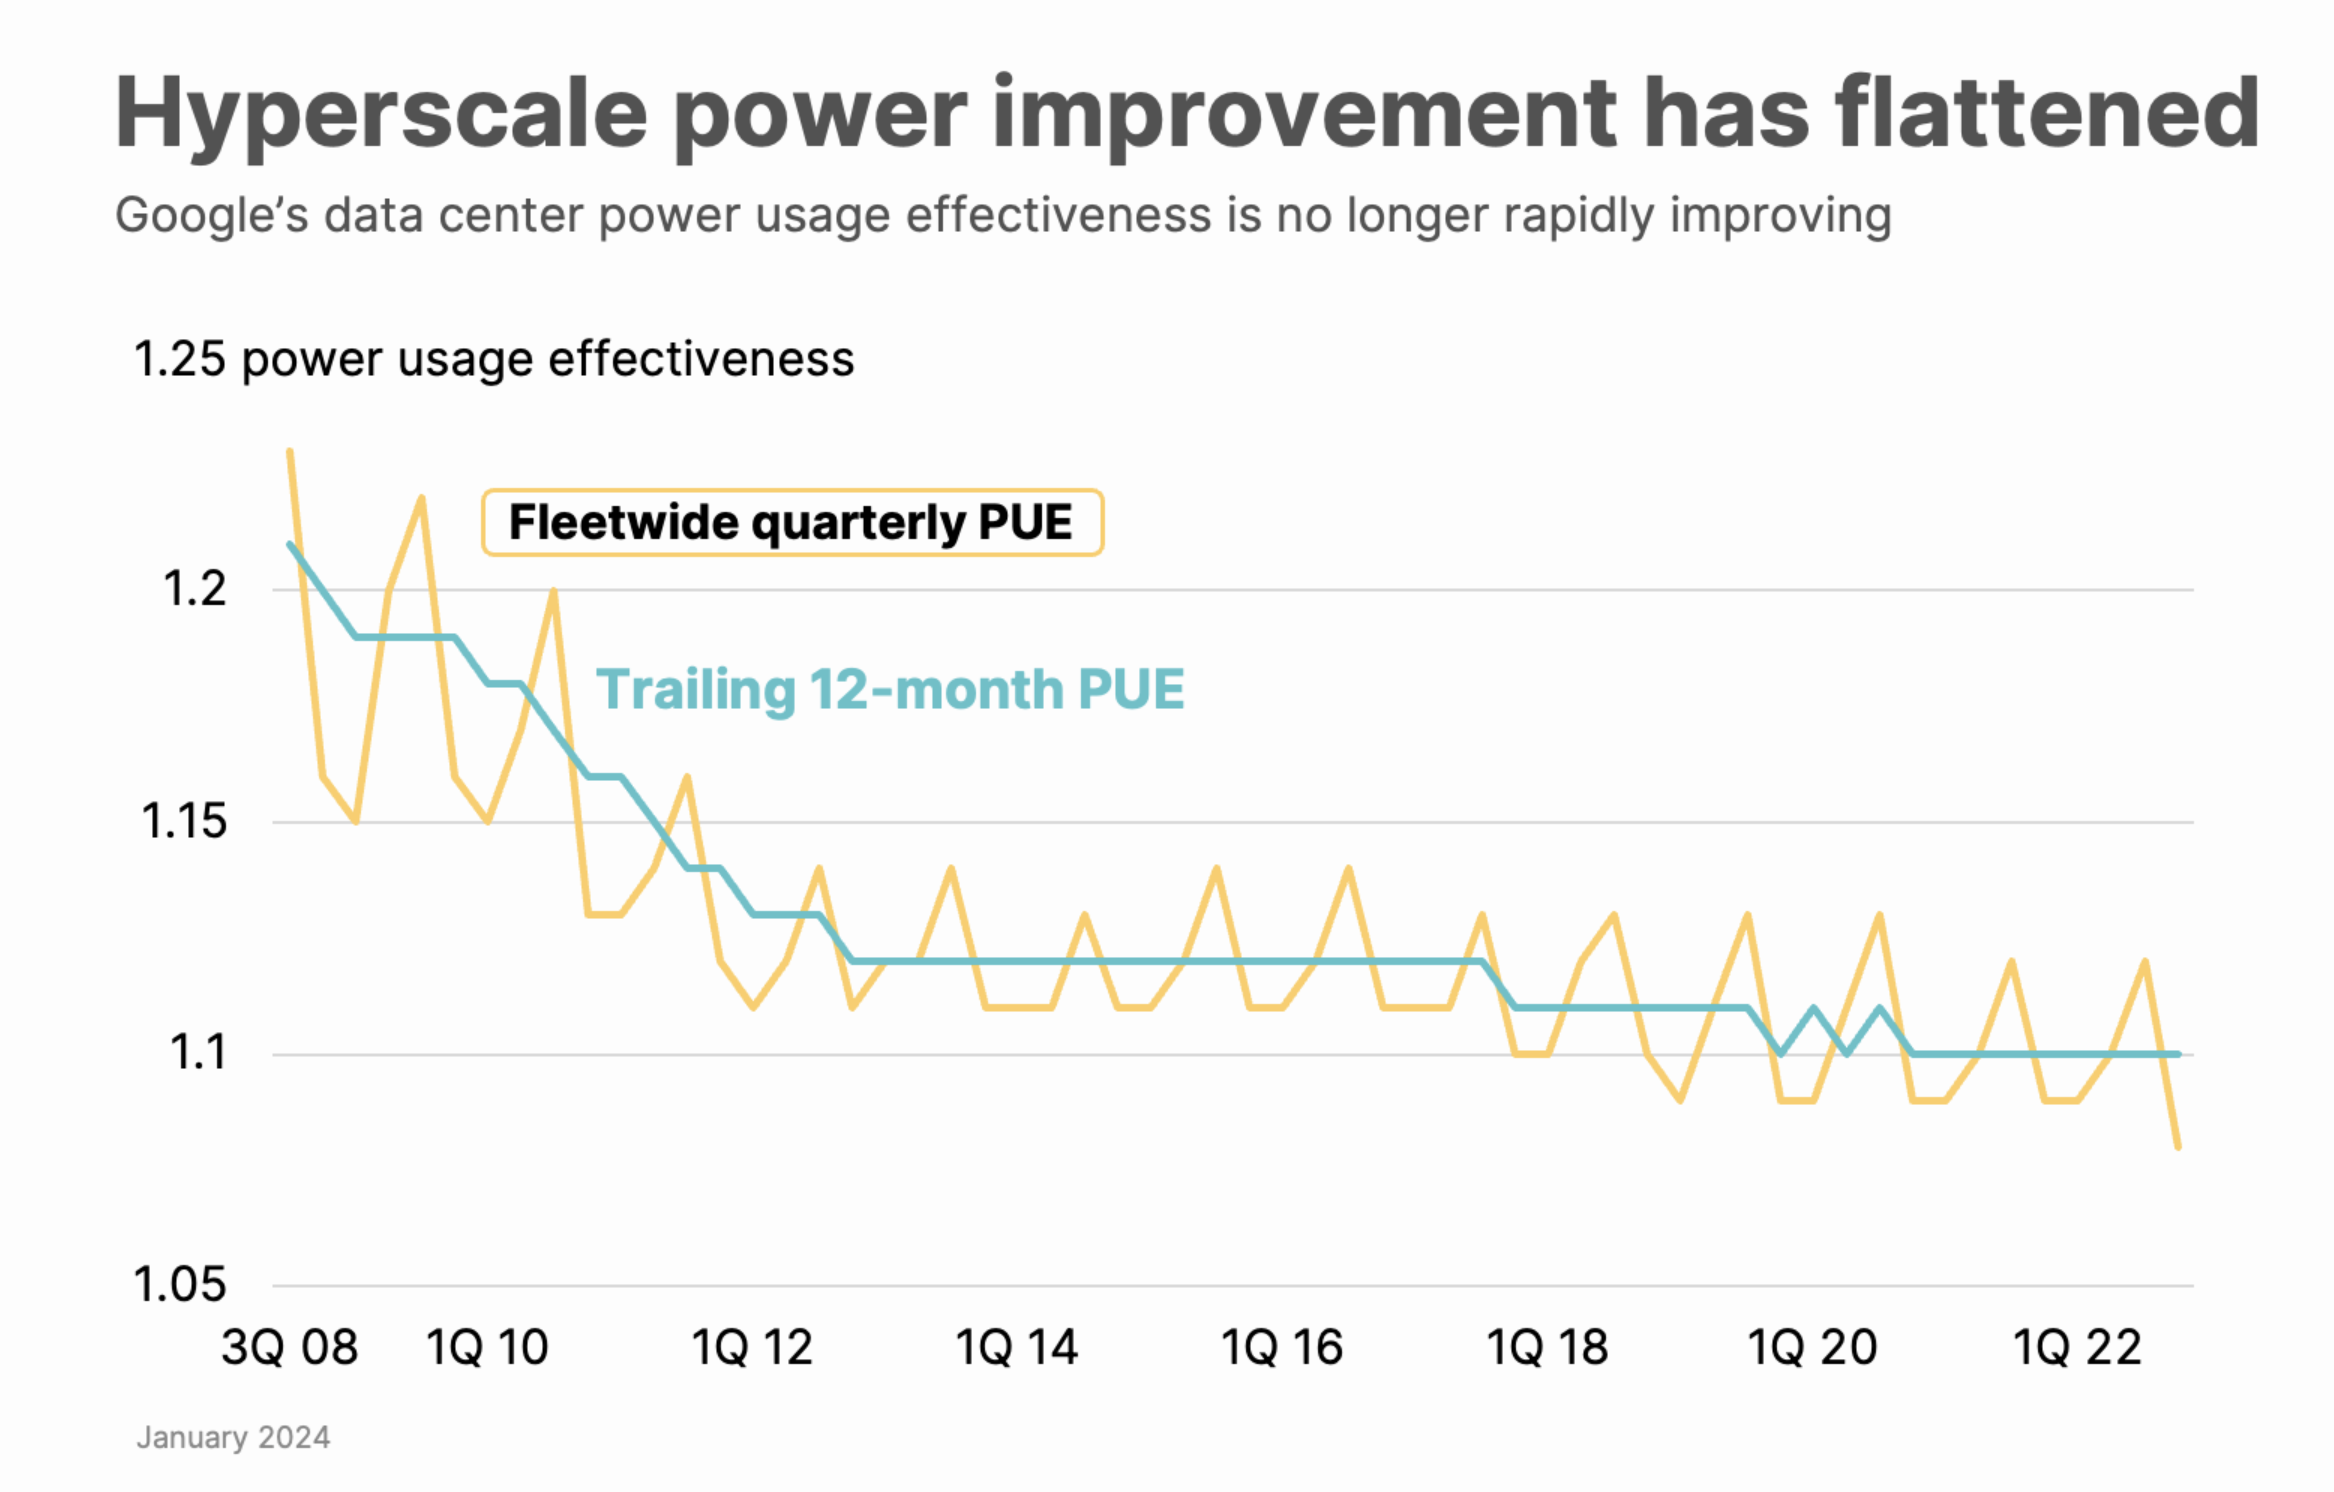
Data Center Power Usage Improvements Flatlining
- Looks like days of significant improvement are behind us.
- Source.
Private Credit
- Nice history of private credit – the talk of the town.
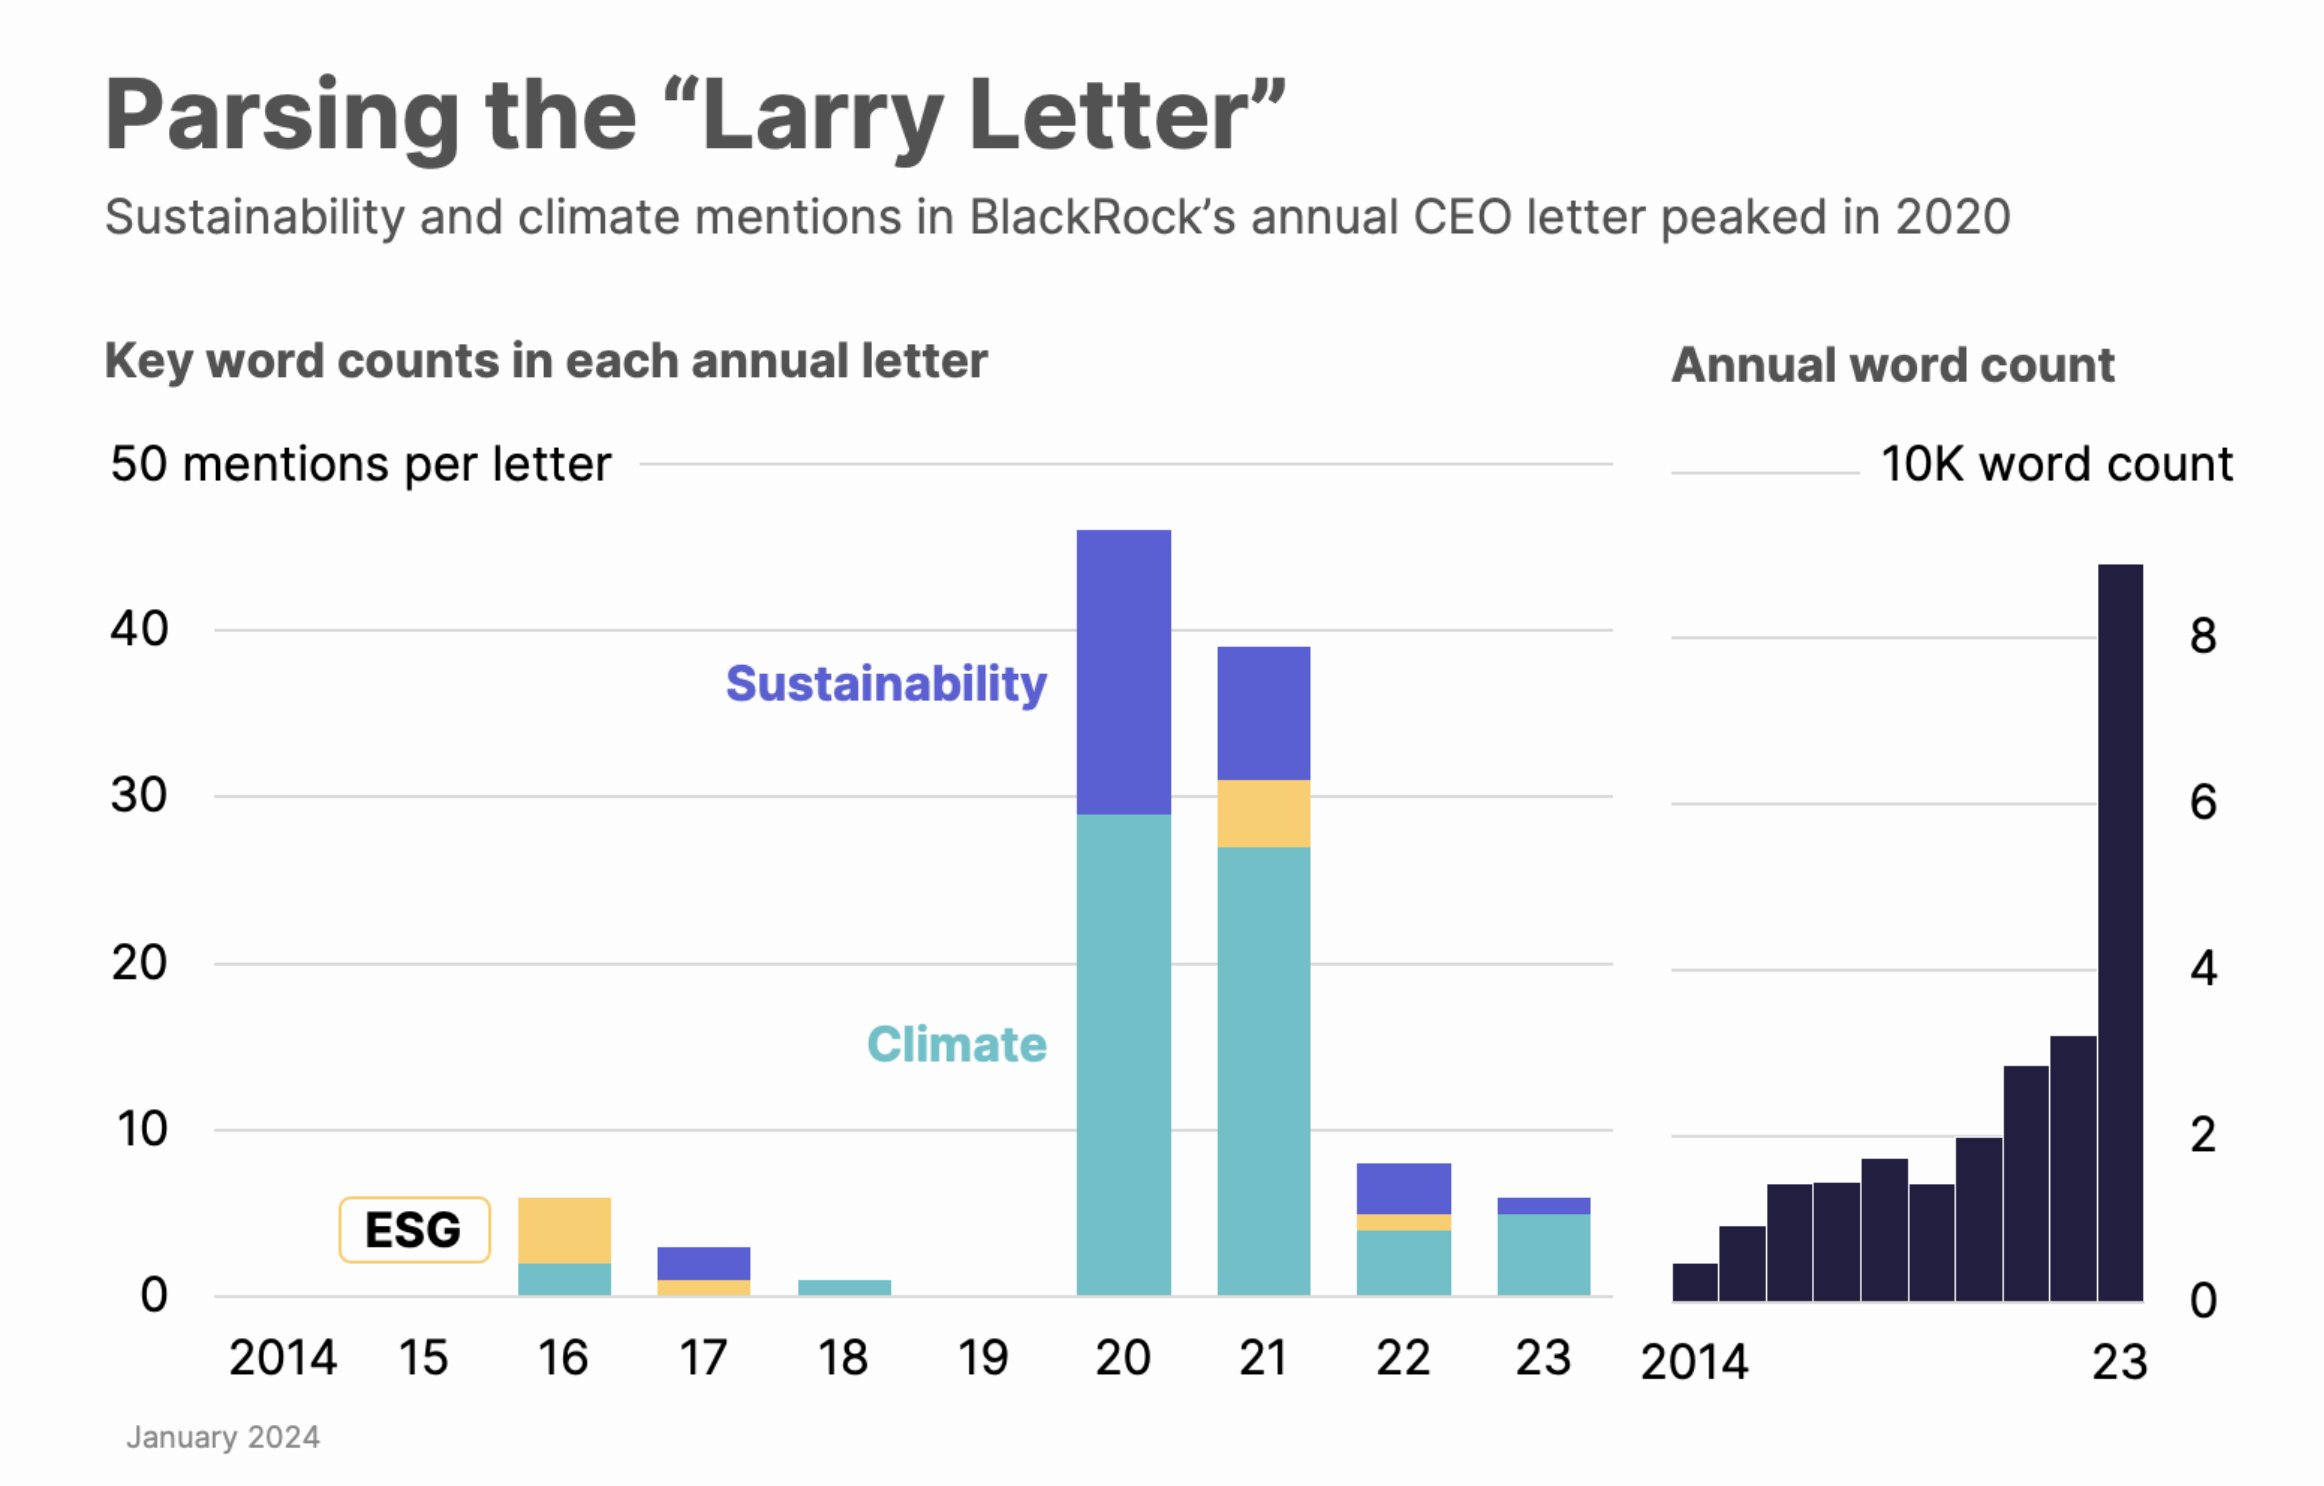
Larry Fink Mentions of ESG Peaked in 2020
- Nice analysis of Larry Fink’s annual letter for terms related to sustainability and climate.
- The peak was in 2020.
- Source.
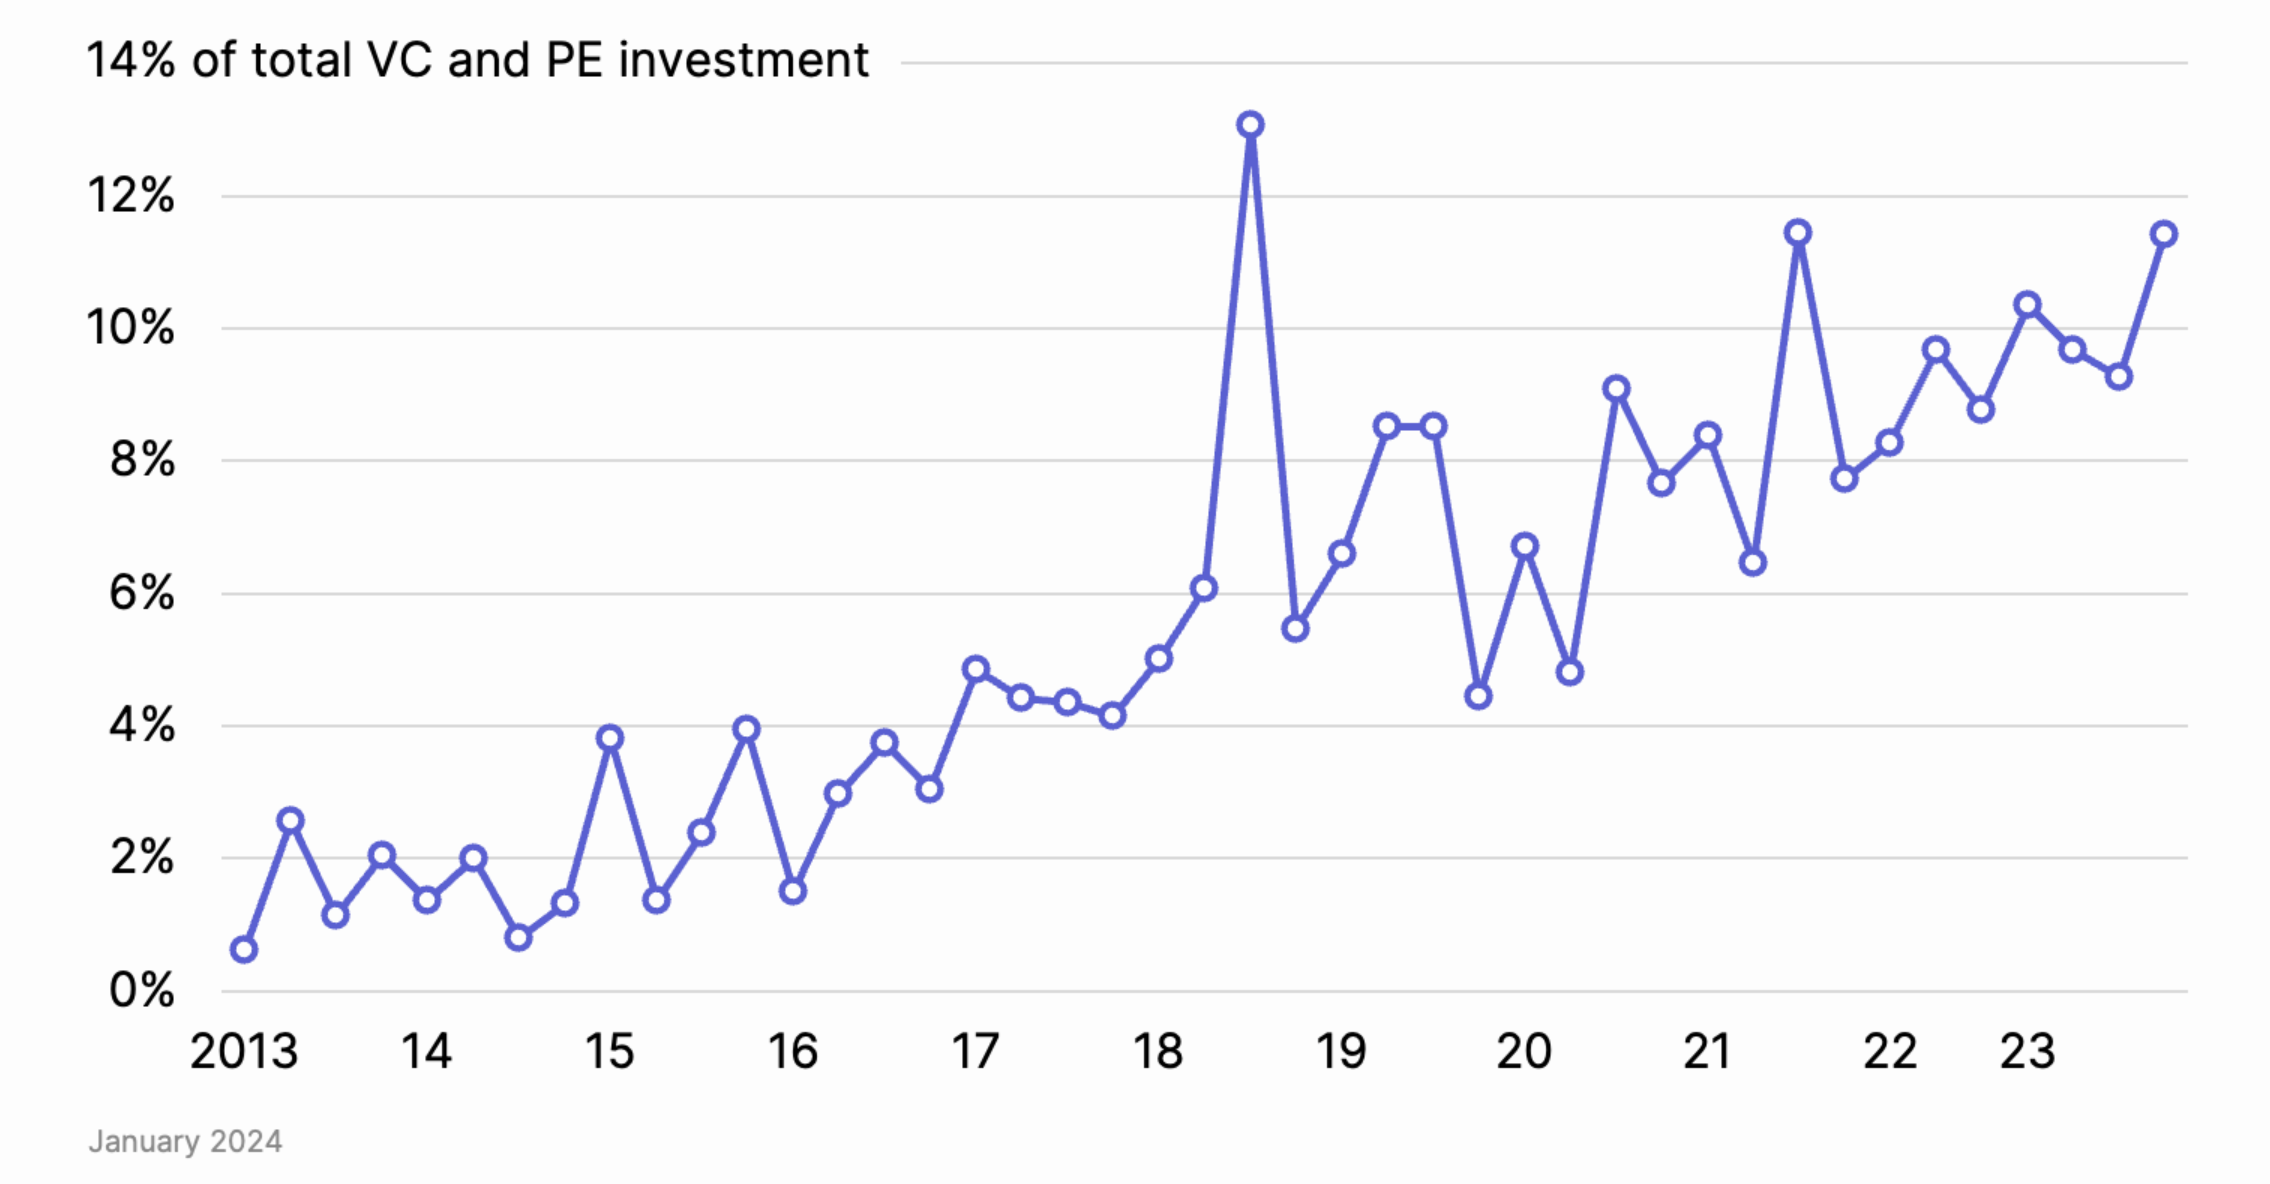
Nat Bullard Decarbonization Deck
- Useful 200 slides on all things energy transition.
- For example, 14% of all global VC/PE went to climate tech
Idea generation
- “The common trait of people who supposedly have vision is that they spend a lot of time reading and gathering information, and then they synthesize it until they come up with an idea.” — Fred Smith, Overnight Success: Federal Express and Frederick Smith, Its Renegade Creator
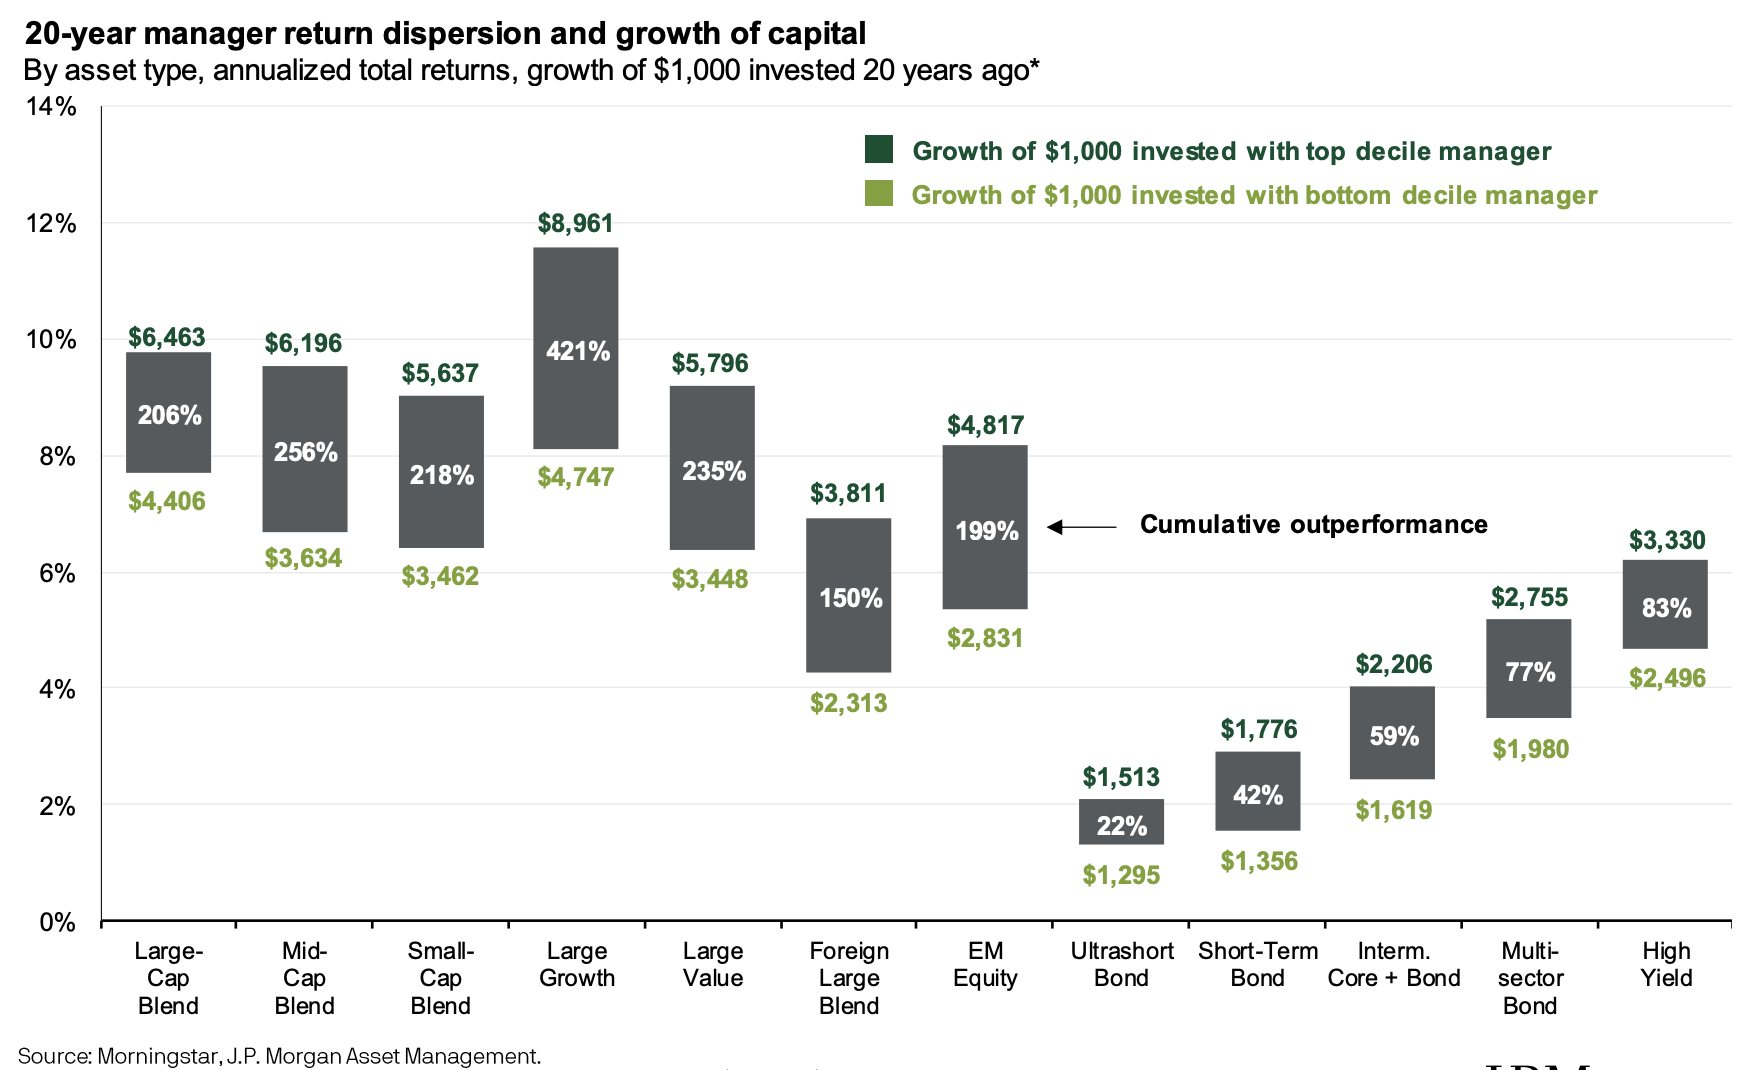
Manager Dispersion
- 20-year dispersion of $1,000 invested in the top and bottom decile fund manager for each asset class.
- Source.
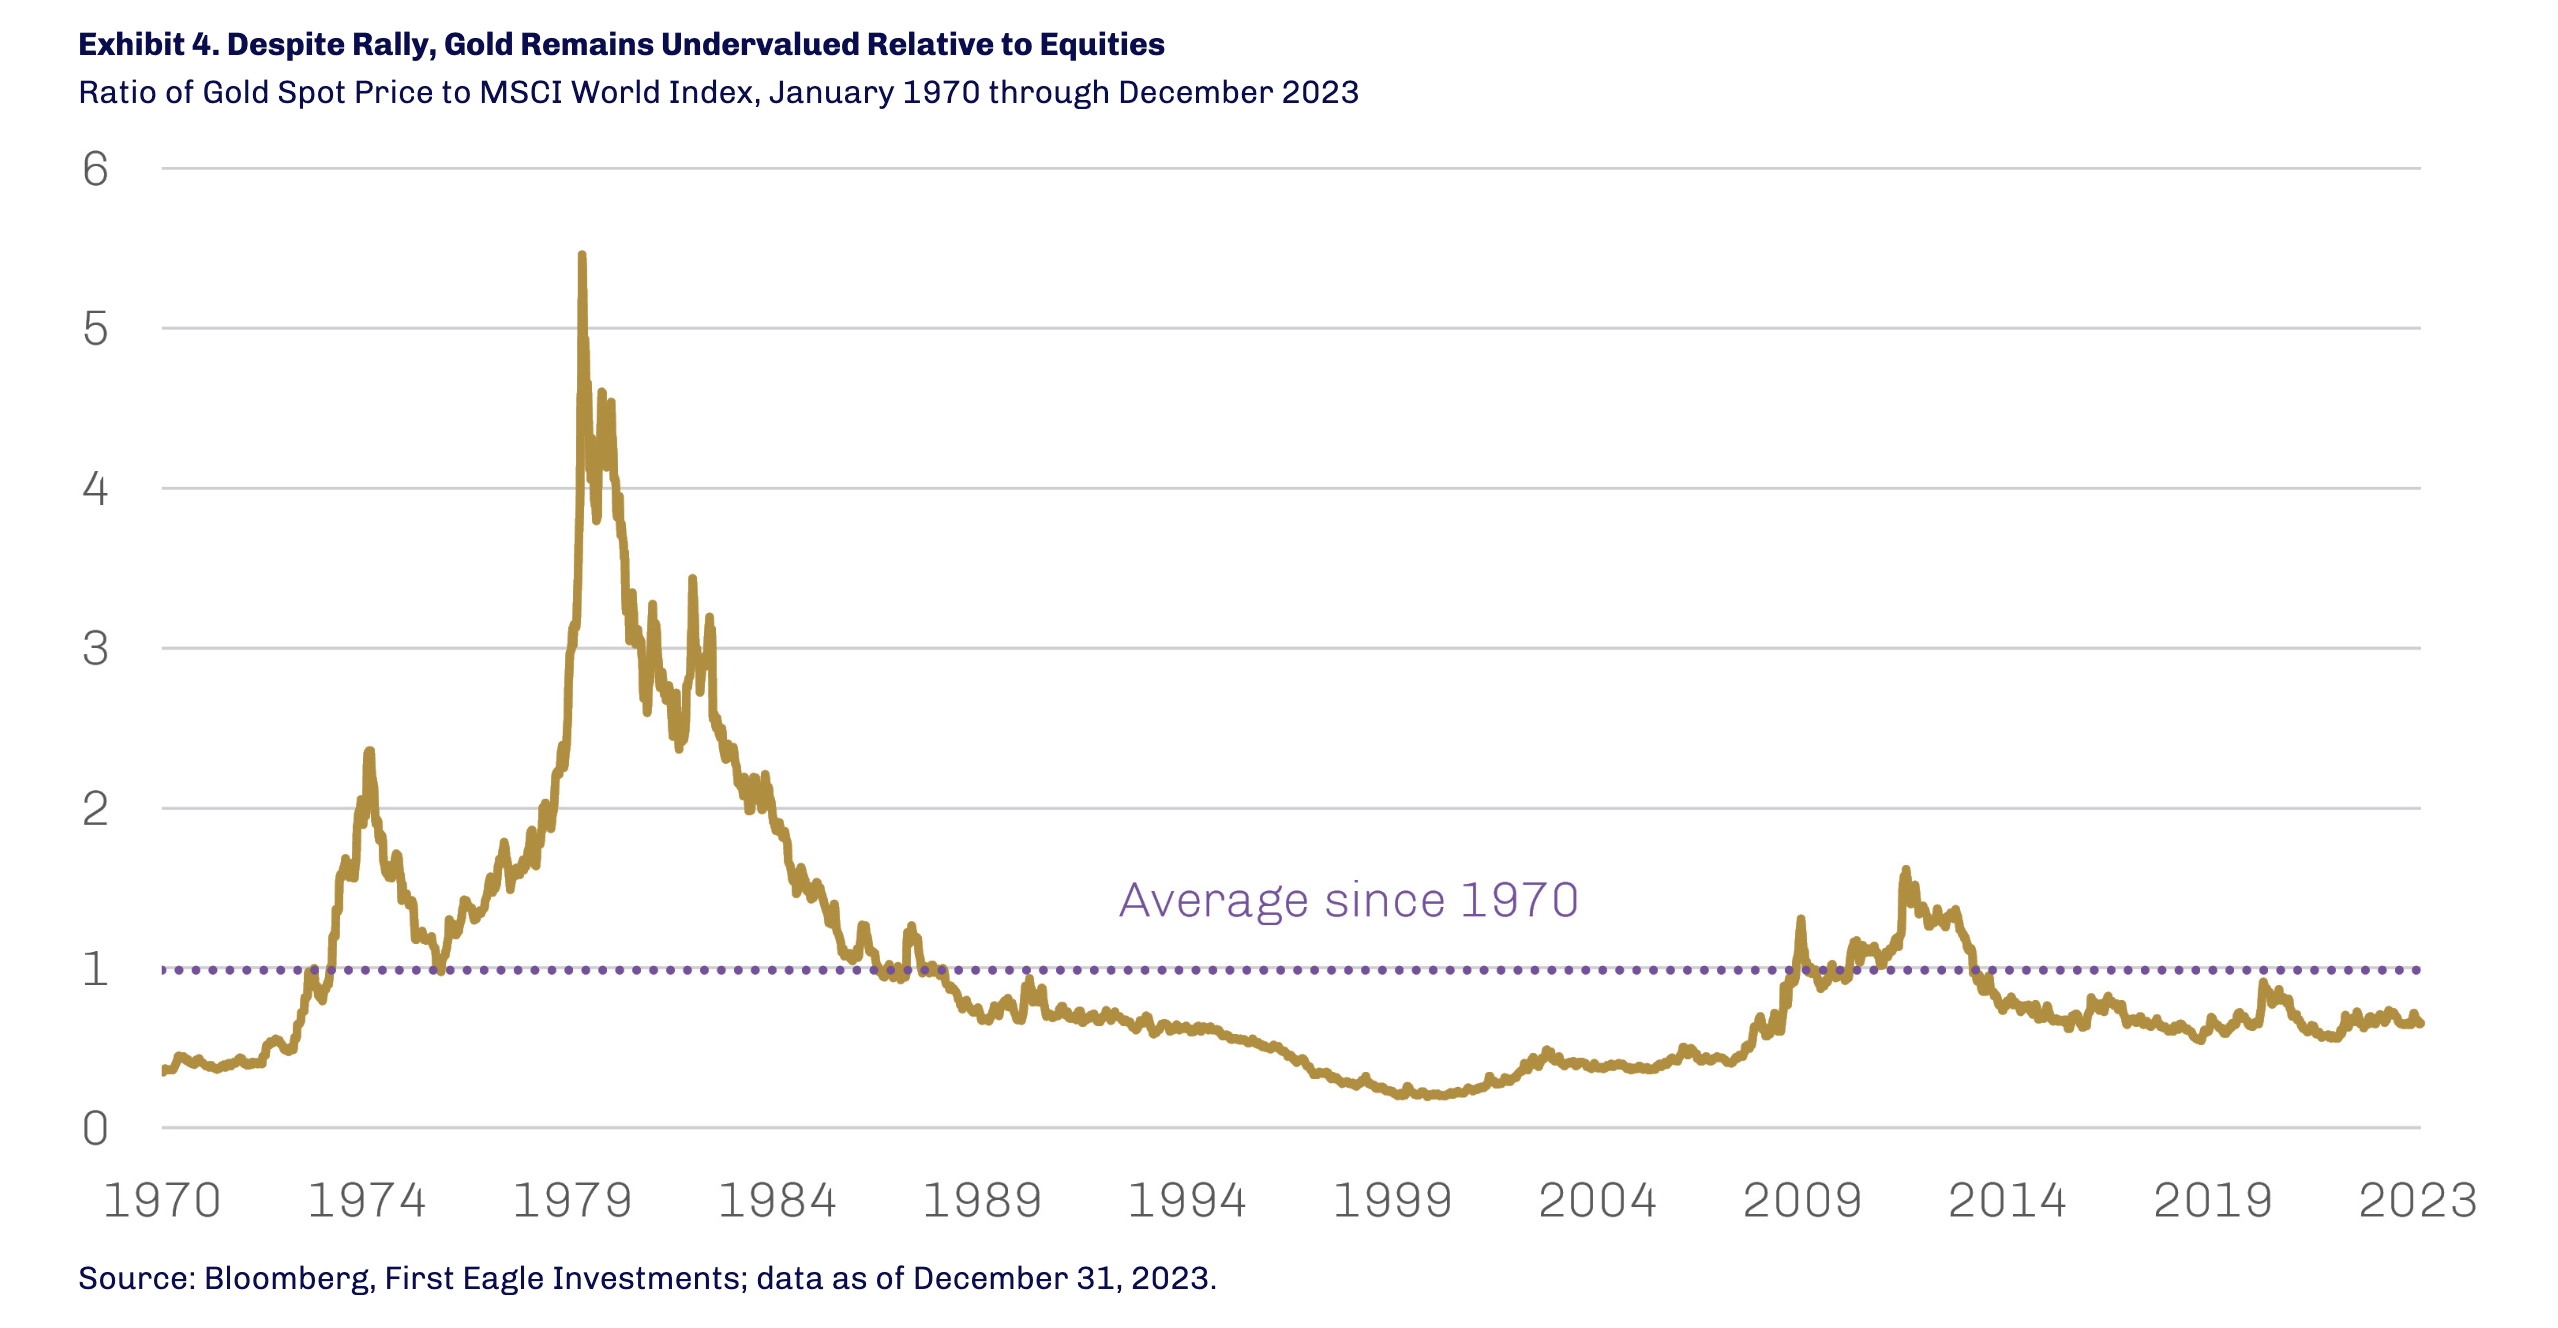
Gold vs. Equities
- Despite a recent rally, gold, when priced relative to equities trades well below its historic (back to 1970) average.
- Source.
How to Be The Best Salesman
- The most successful salesman in history sells cars.
- How?
- Girard offers a simple answer: “People want a fair deal from someone they like.”
- When questioned about his actions to get people to like him, he simply says, “I tell them that I like them.”
YC
- A very good history of Y Combinator and how Paul Graham, through his essays and otherwise, had a huge part to play in building the cult of the founder.
- This history is trapped inside a not-so-convincing argument of YC’s demise.