- Breaking below the long-term trend line.
- h/t Top Down Charts.
Amazon Ads
- Fascinating development harks back to this.
- “Direct-to-consumer brands moved 20–30% of their marketing dollars in Q4 2022 from Meta to Amazon due to the former’s declining performance metrics for ads. The shift occurred despite a recent reluctance from DTC brand to sell products on Amazon because of limited access to and ownership of sales and customer data—but now that brands are receiving only $2 back for every $1 spent on Meta ads (they used to get $8 back), they are more willing to work with the e-commerce giant. According to Advantage Unified Commerce, an estimated 75% of brands report customer acquisition is cheaper on Amazon than other media channels.”
- Source (h/t Pipe).
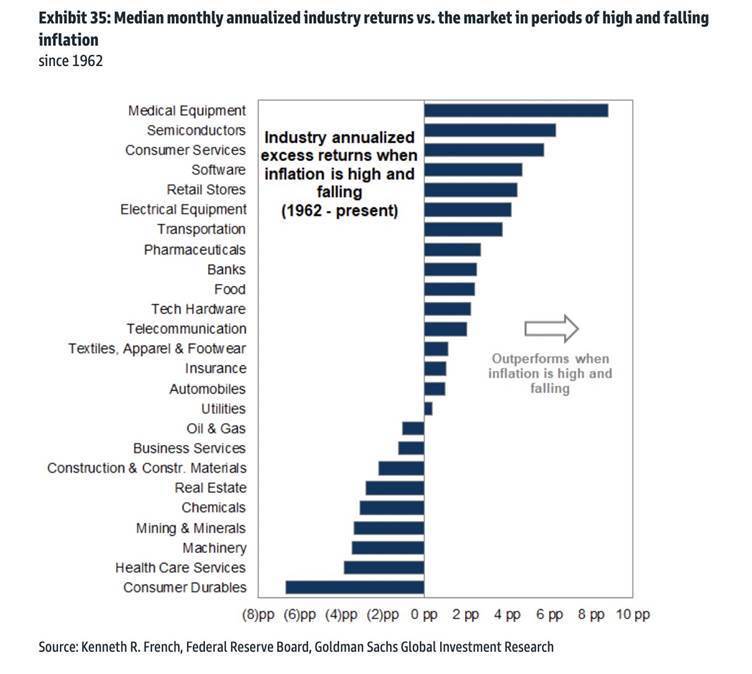
High but Falling Inflation Regime
- Useful chart – which sectors perform best in this type of regime (data since 1962).
- Source: GS.
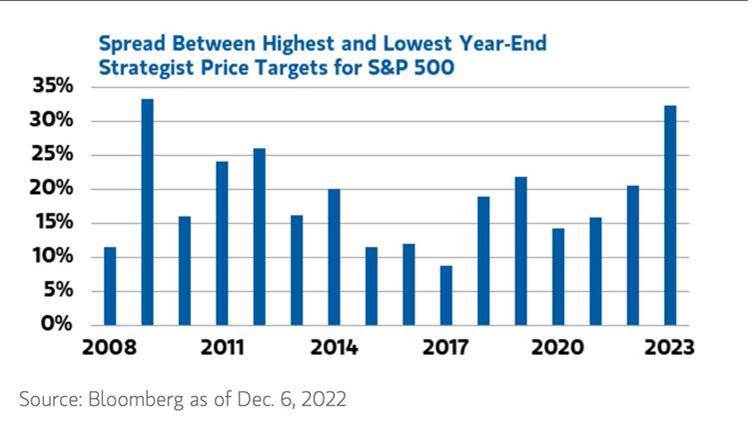
Dispersion of Strategist Targets
- Widest range of 2023E year end S&P 500 price targets since 2008.
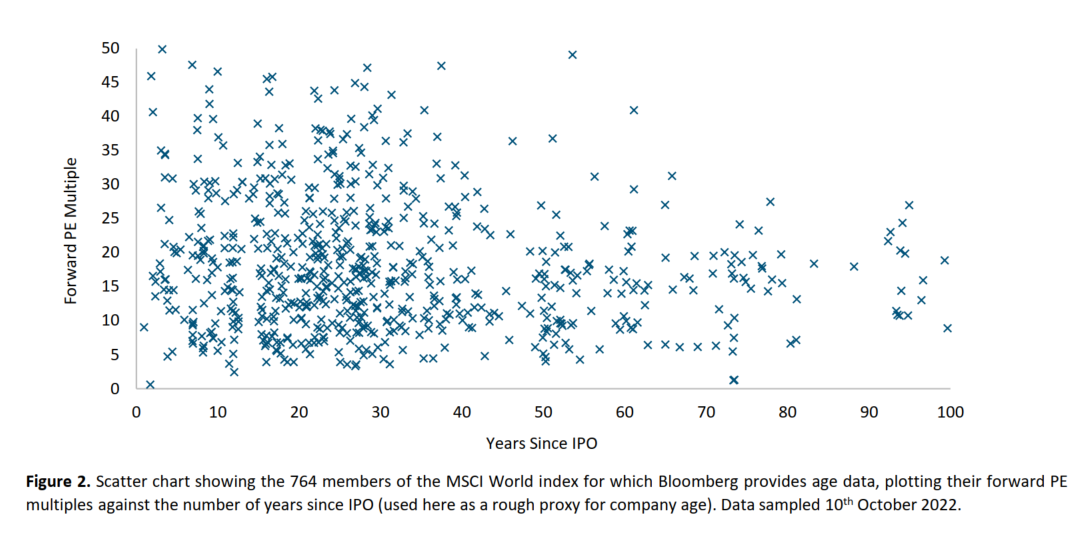
Age and Multiples
- Does the age of a company imply anything about its multiple?
- This chart from Lindsell Train suggests no.
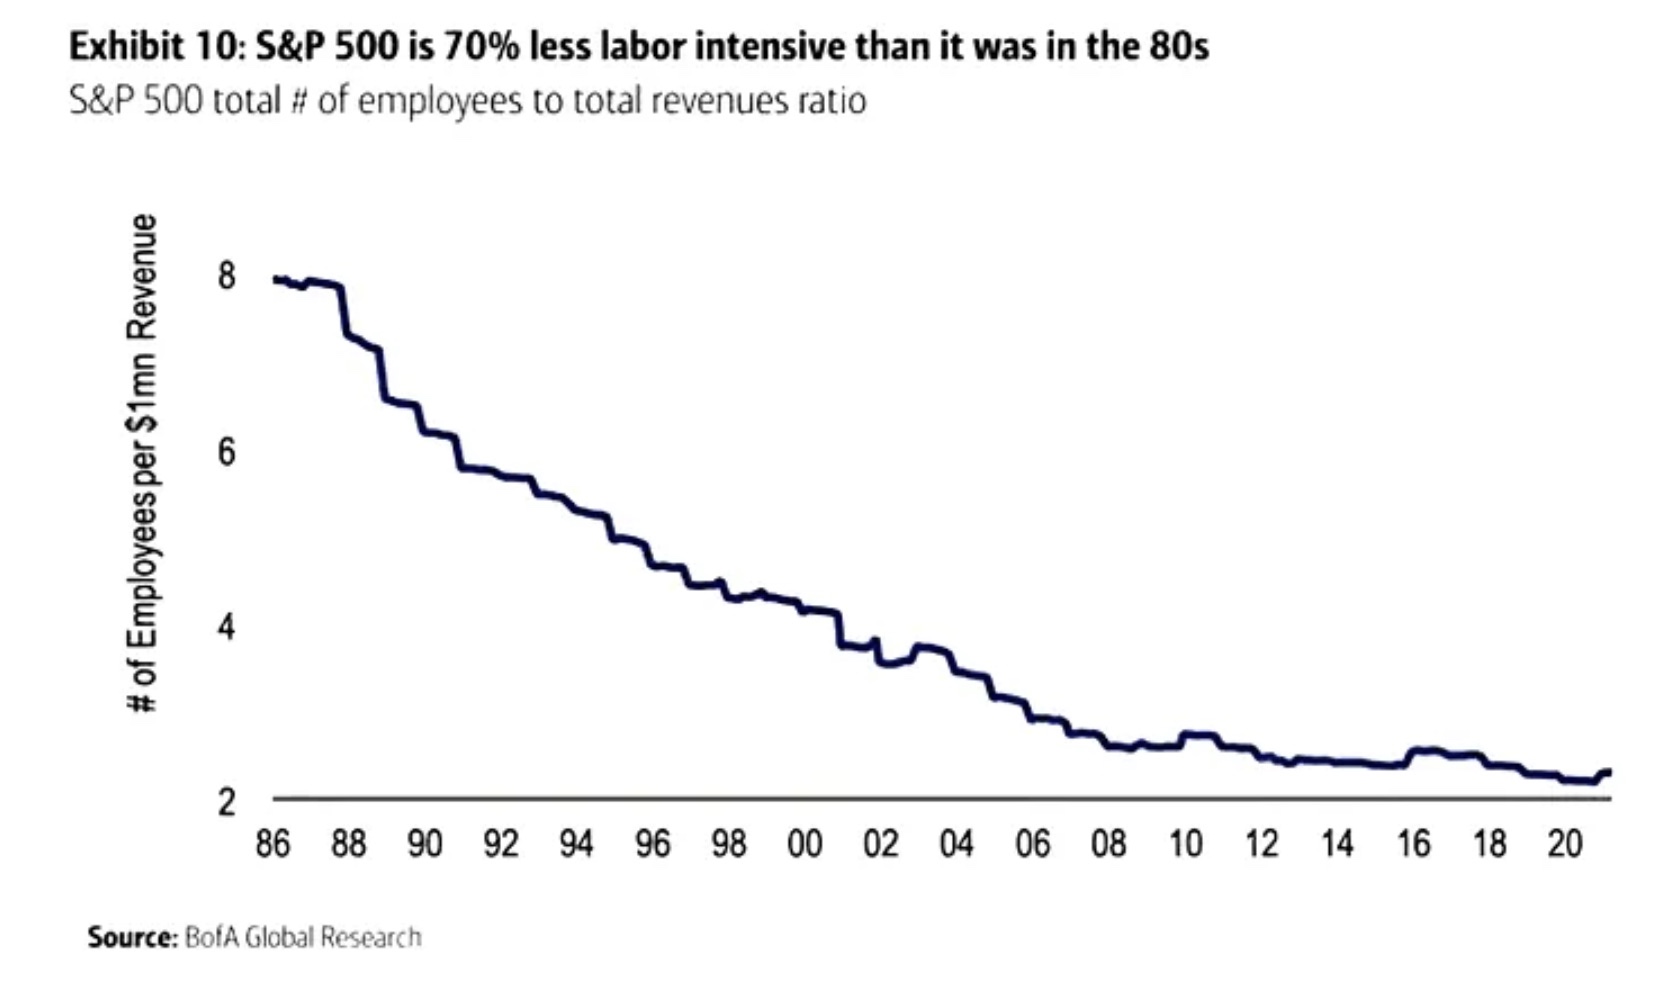
Labour Intensive
- S&P 500 is far less labour intensive than in the past.
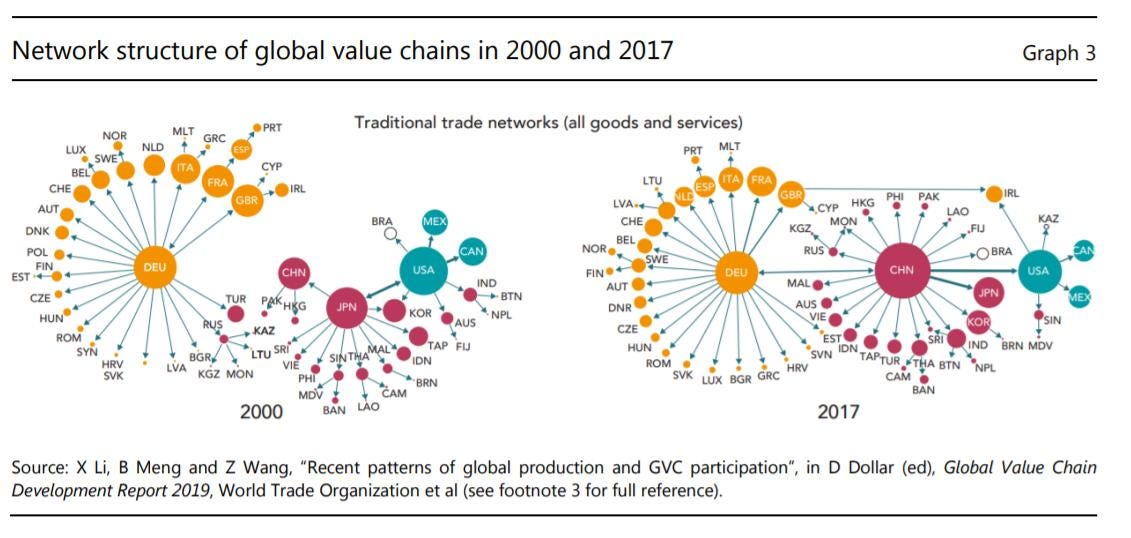
Global Value Chains
- WTO chart showing how the world has changed from 2000 to 2017 in terms of trade networks.
- Chimes with this.
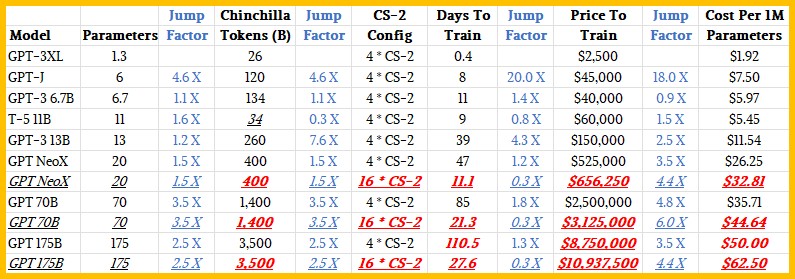
Scaling AI Model Training
- Interesting, but technical look, at what it costs to train large language models.
- This has implications for all kinds of businesses as this technology becomes more widely used.
Holiday Break
- Snippet is on holiday, returning again 11th of January.
- Wishing everyone Happy Holidays.
Expert Transcripts by AlphaSense
- Thanks go out to Stream by AlphaSense for sponsoring Snippet Finance in December.
- If you haven’t already checked out this excellent expert interview transcripts database (20,000+ and counting), you can grab a free 2-week free trial here (use a business email, name required, and hit the activation link).
PE Buying up SaaS
- Table of 2022 tally of acquisitions involving private equity buying public SaaS businesses.
- Source.
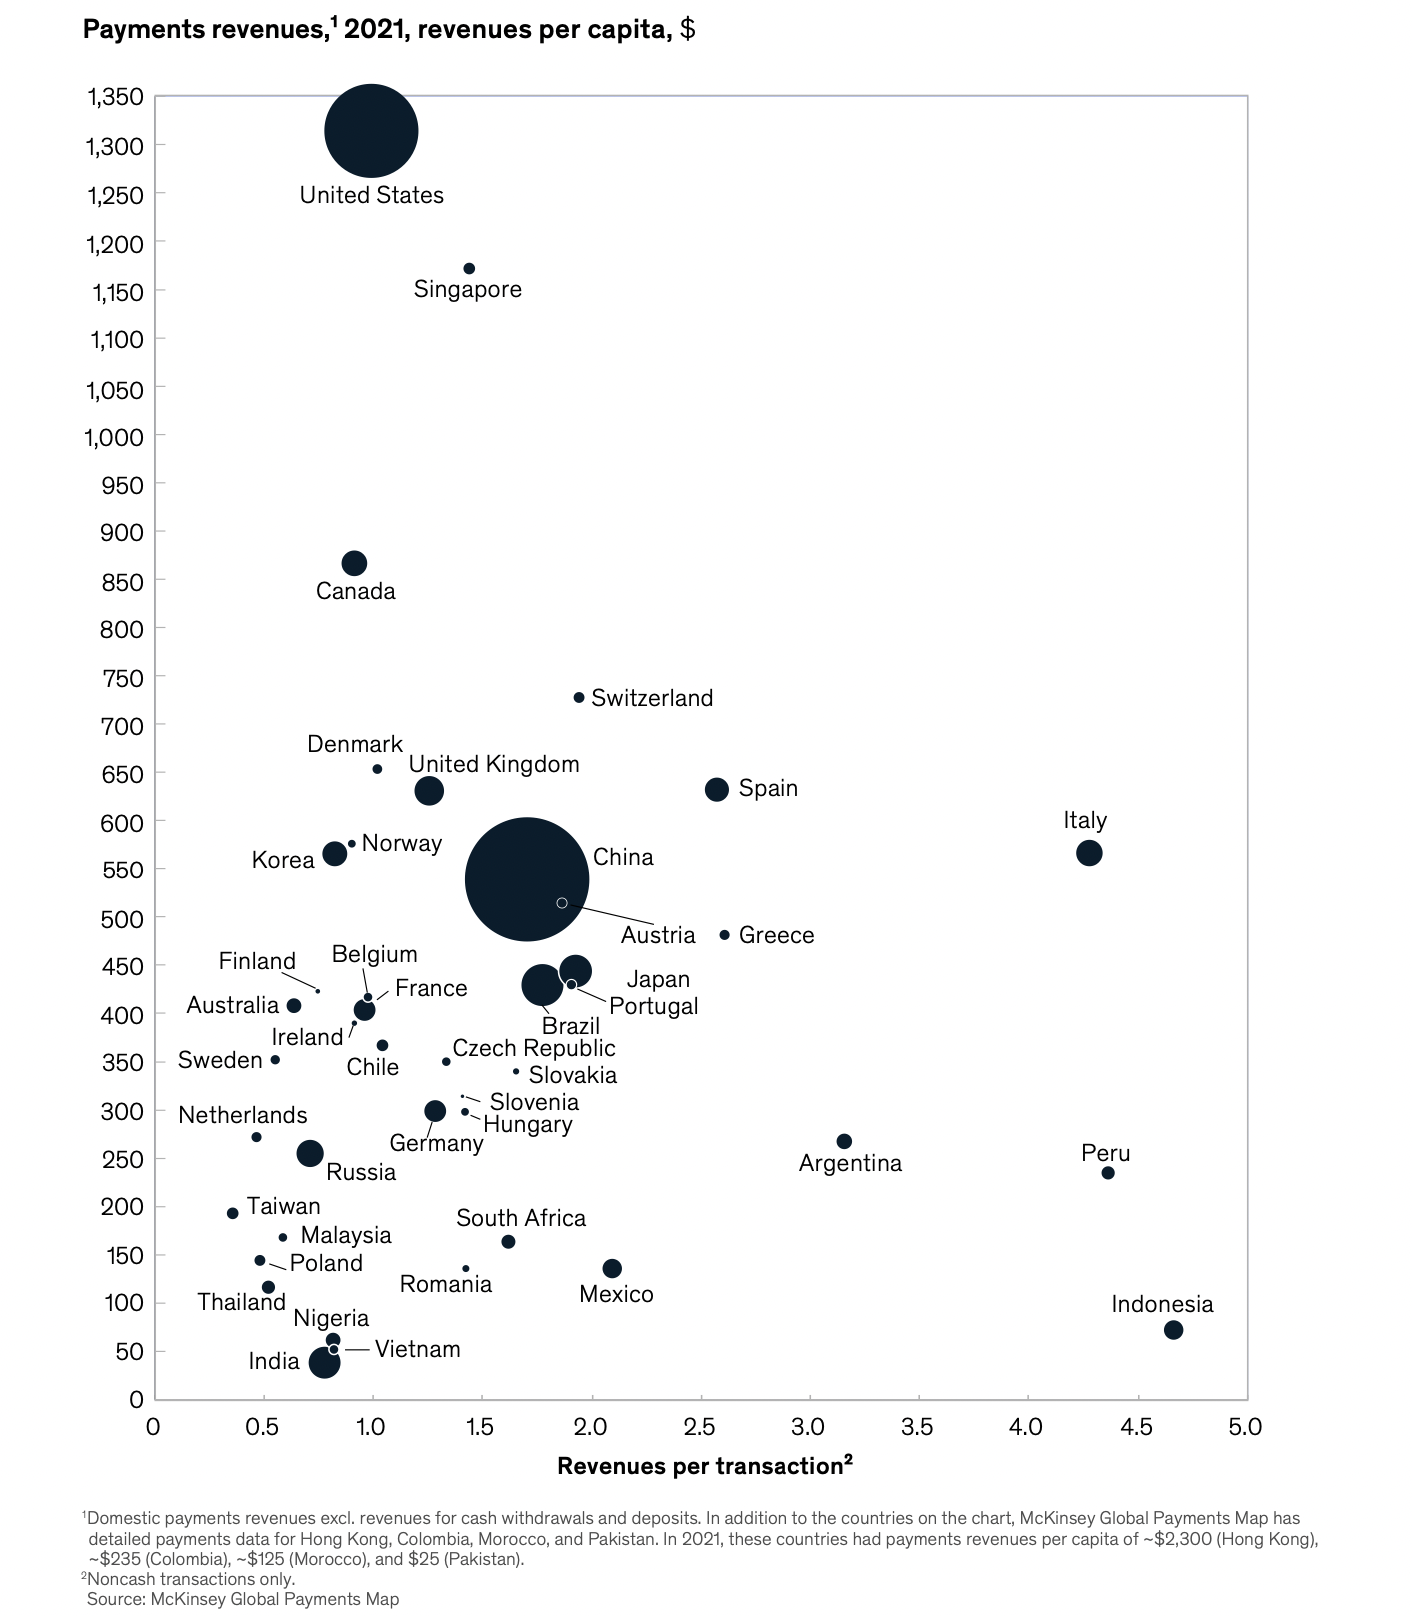
Payments Map
- Nice mapping of the world’s payments landscape.
- “There remains significant country-level dispersion in revenue per transaction, driven by a variety of factors, including transaction pricing dynamics and payment instrument mix“
- Source.
52 Things – Tom Whitwell
- The classic annual list, 2022 edition. Eye opening as usual:
- “37 per cent of the world’s population, 2.9 billion people, have never used the Internet.“
- “40% of global shipping involves moving fossil and other fuels (oil, gas, wood pellets) around. More renewables (solar, wind, nuclear, geo), means fewer ships.“
- “If you want a question answered on the Internet, post a wrong answer first.“
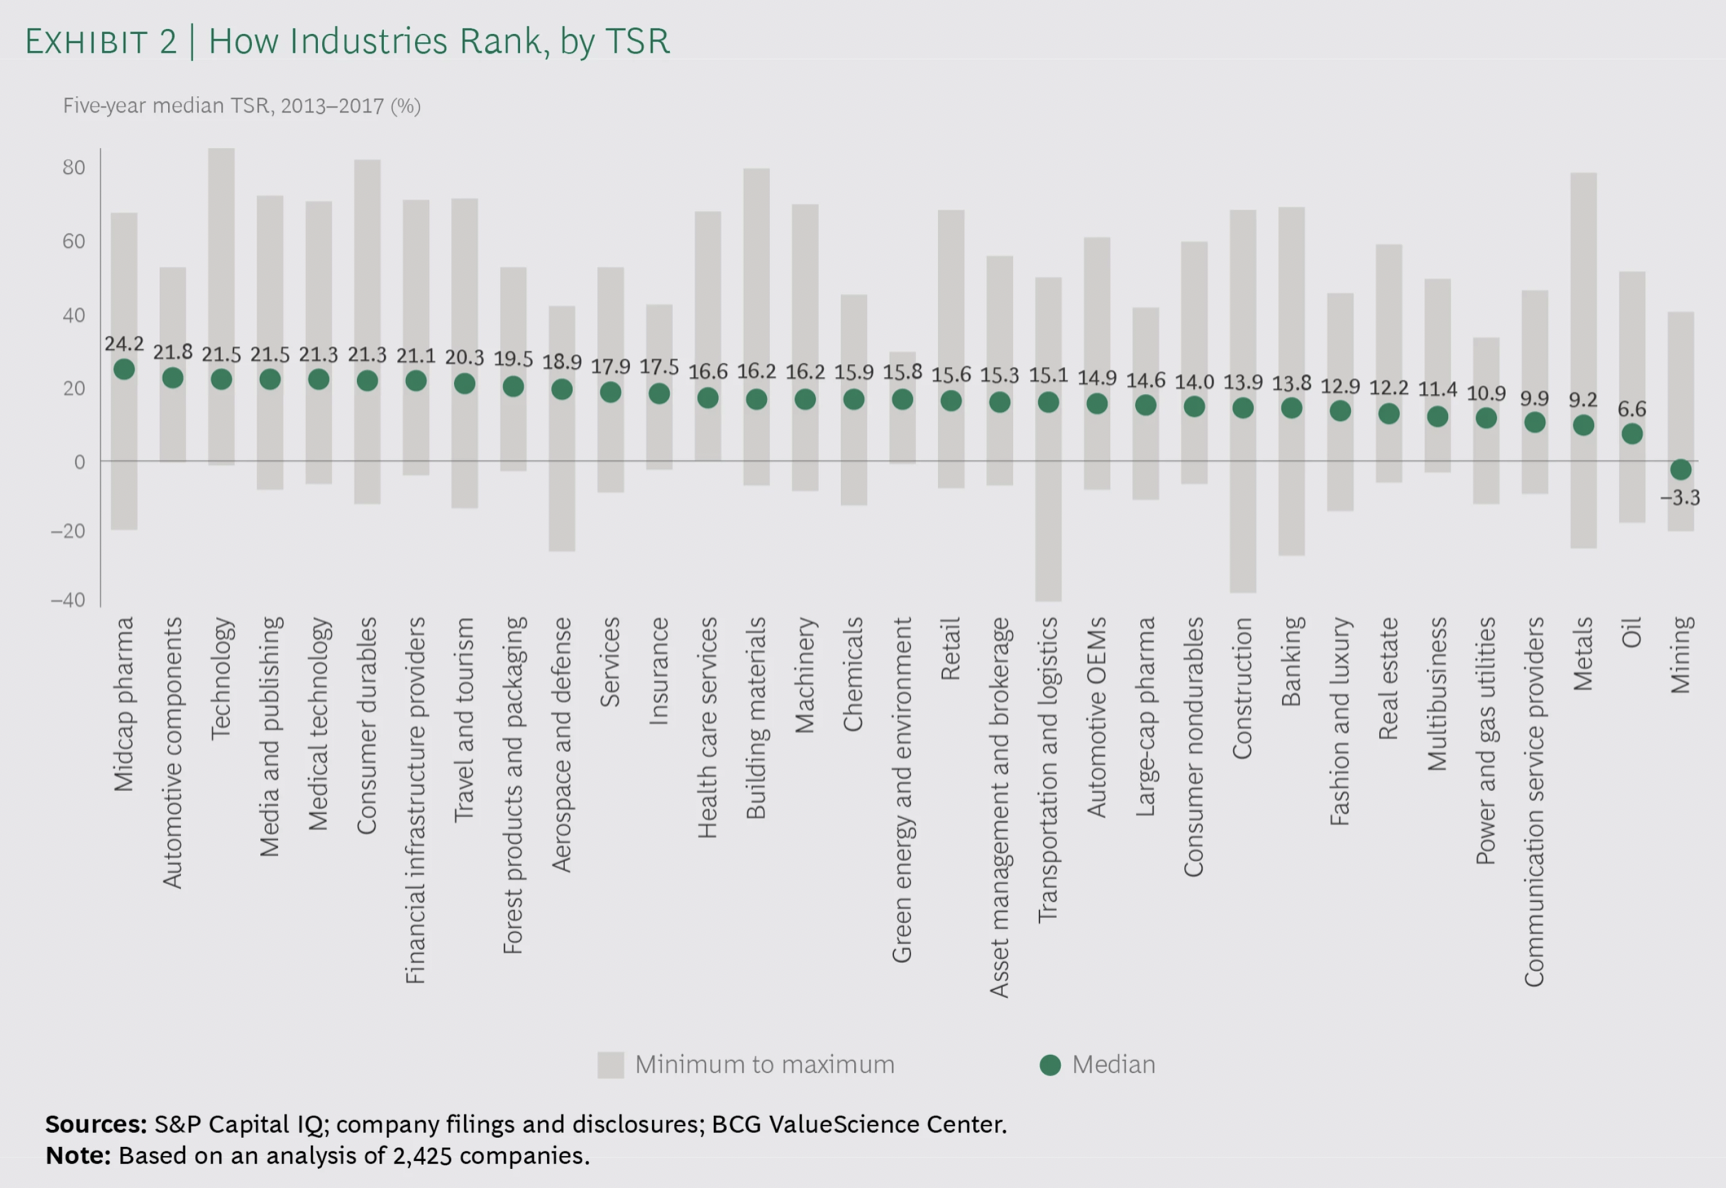
TSR across industries
- Interesting chart from BCG.
- It looks at TSR (Total Shareholder Return) over a 5-year period (2013-2017) across industries.
- “The median TSR of the top ten companies in each industry was higher than the industry’s median by 9 percentage points (in insurance) and 32 percentage points (in media and publishing as well as metals).“
- “The lesson is this: being in a sector whose market performance is below average is no excuse. TSR is a relative—as well as an absolute—metric, so whether an industry is under pressure or accelerating, every company has the opportunity to outperform its peers.”
Trade Tensions
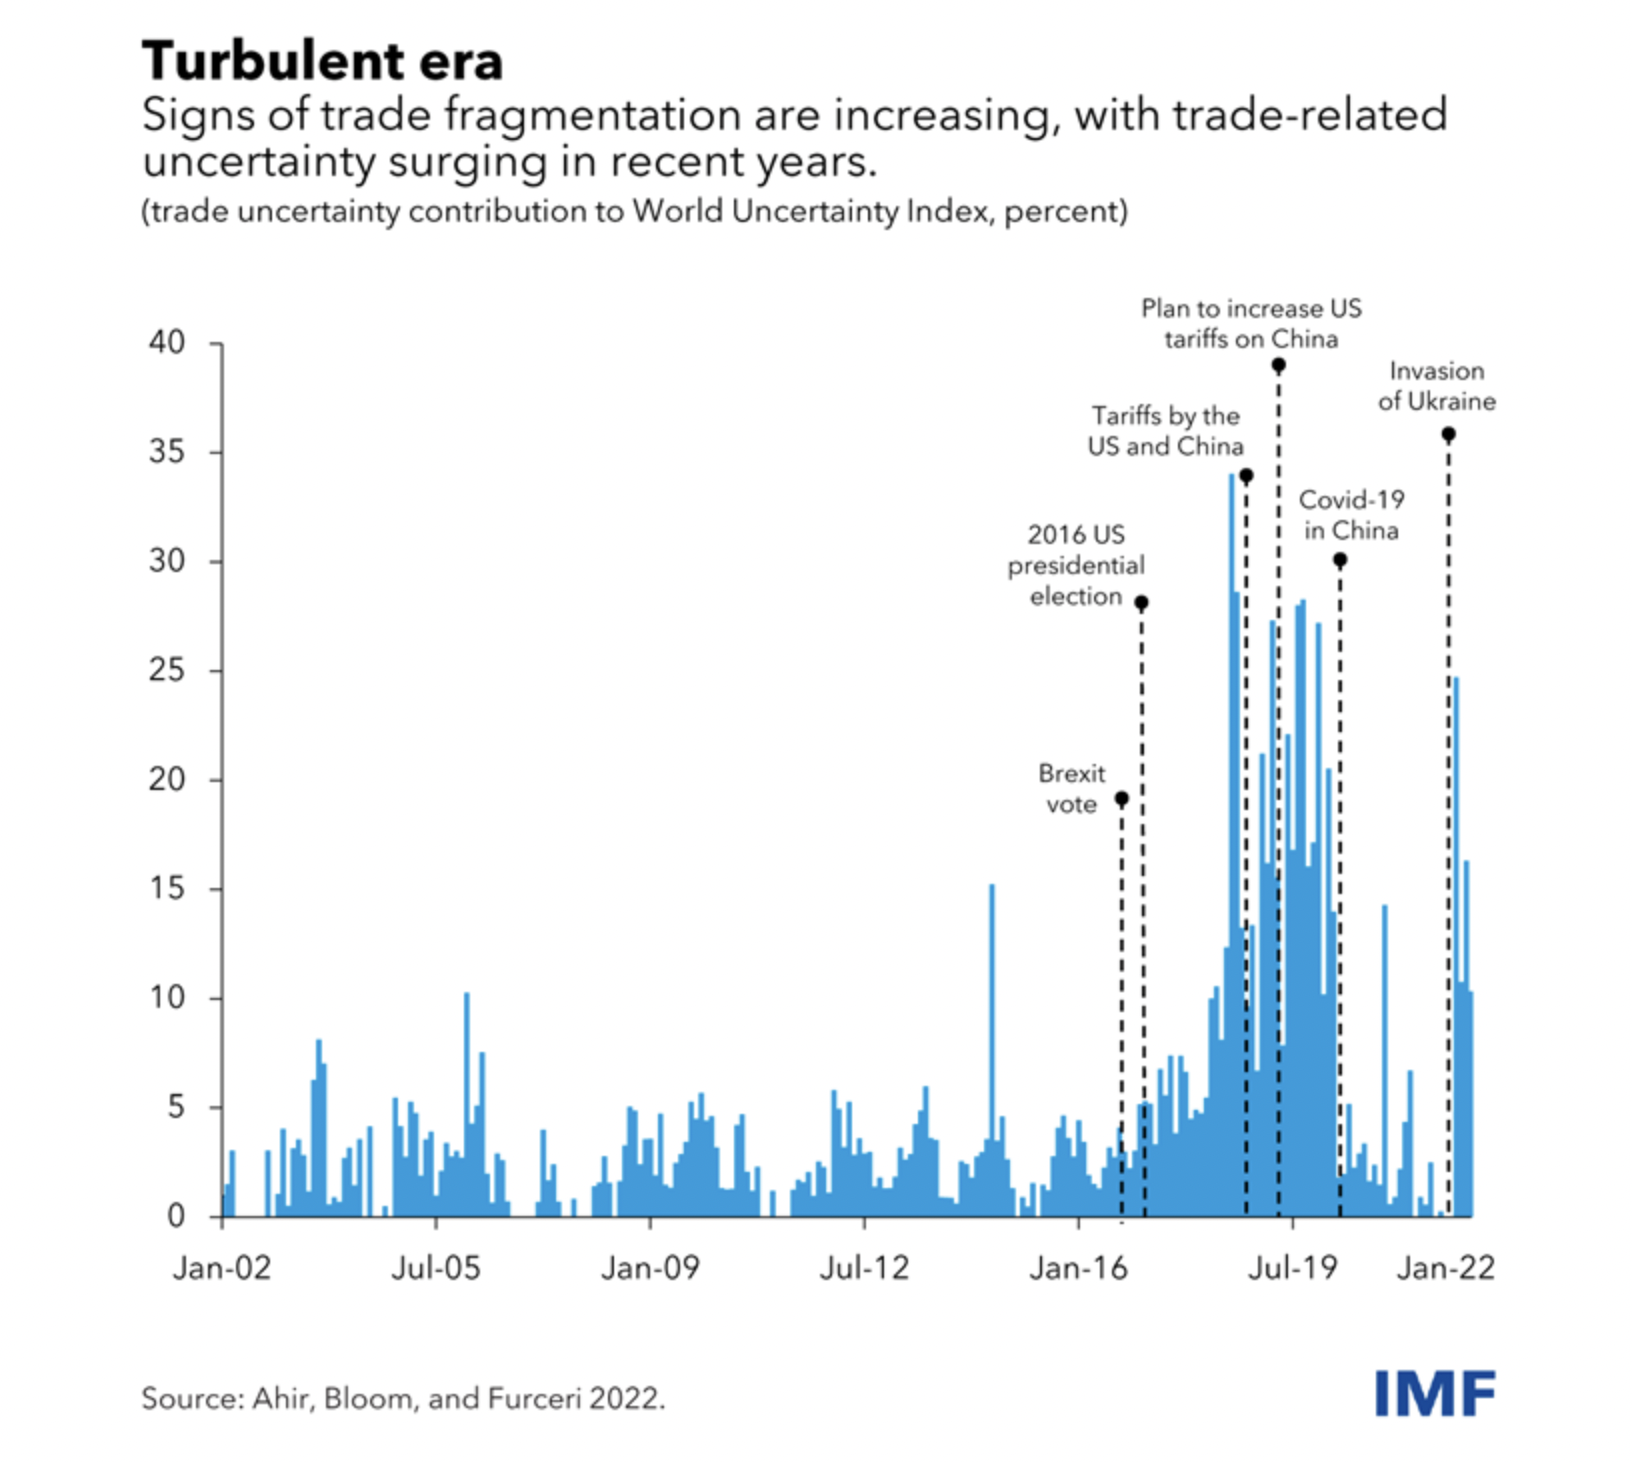
- Worrying rise in fragmentation documented by IMF.
- Source.
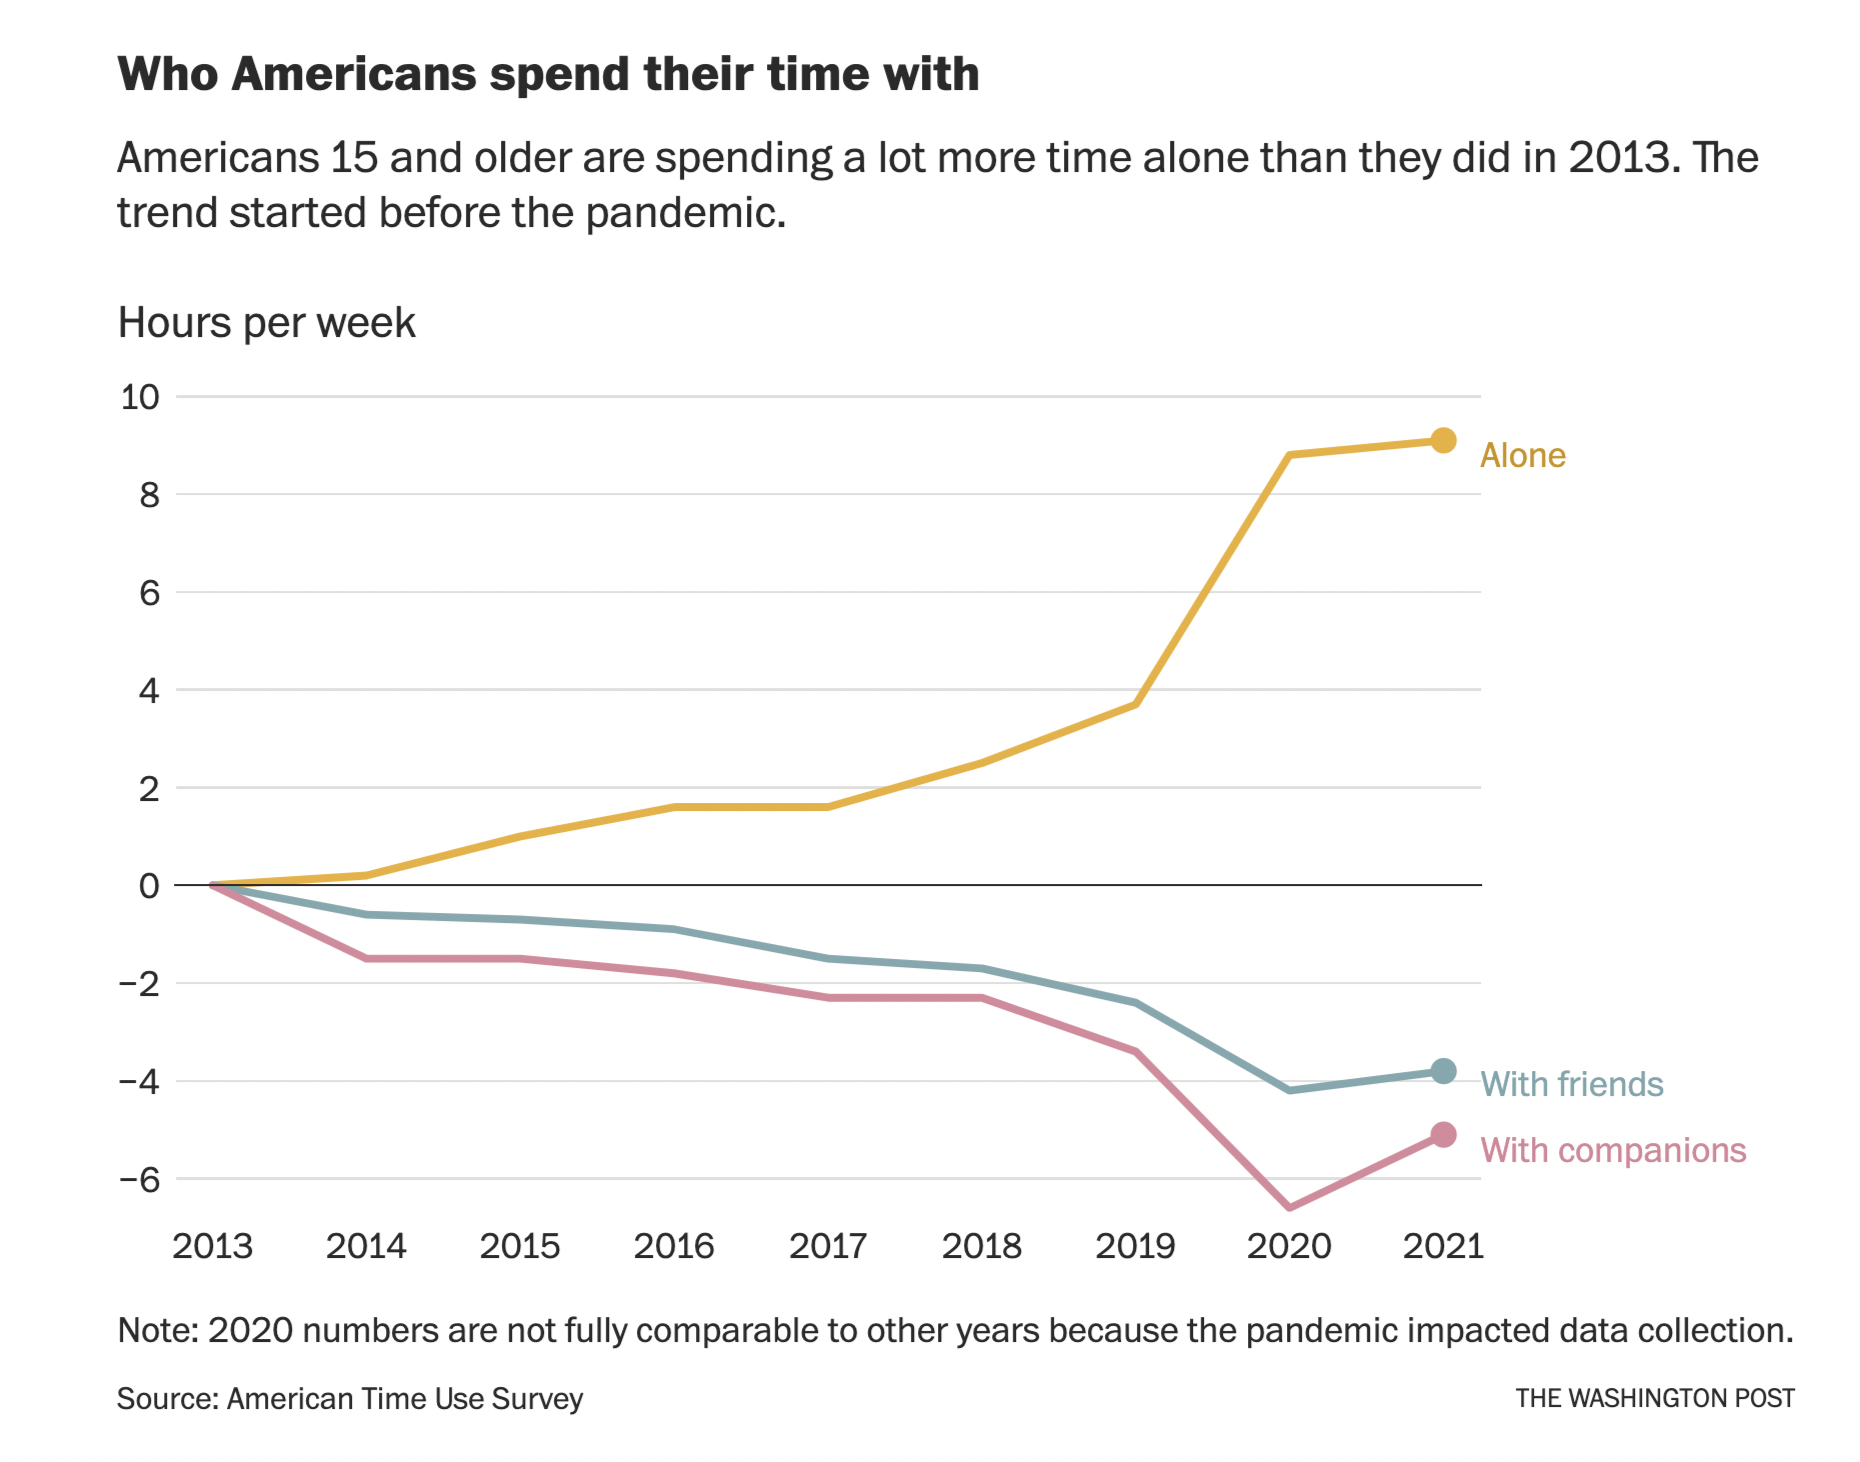
Being Alone
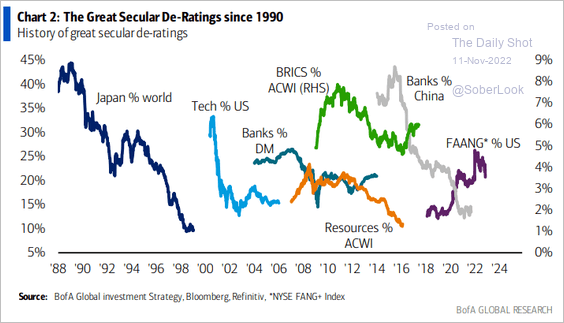
Secular de-ratings?
- Interesting chart from ML via Daily Shot.
How to Negotiate
- Fascinating article based on a Wharton professor’s guide to negotiating for reasonable people.
- Some of the key points:
- Leverage – “In general, the person who feels better about “no deal” has the most leverage, and the person that’s less okay with “no deal” has the least leverage.“
- Have specific justifiable goals – preparation is key here.
- Establish and maintain trust – “If it’s not there, trust is the single biggest obstacle to a good deal.”
- Get information – “More listening = more leverage.”
- Concessions – “Link them with “if…then.” Make sure they recognize you’re giving up something of value so they feel the need to reciprocate.“
Consumer Trends 2023
- The latest slide deck from Coefficient Capital and The New Consumer is out and it is worth a flick.
- Interesting slides include 37 (rising CAC), slides on celebrity-backed brands, slide 57, slide 66 (Instacart’s share!), 76 (growth of prestige beauty brands).
52 Snippet from 2022
This year I built a game. I also published nearly 420 Snippets. Here are 52 snippets I learned from the past year (a homage as always to Tom Whitwell):
- On Twitter, the most popular three words in an article headline, based on an analysis of 100 million articles, are “the future of” followed closely by “we need to”. [BuzzSumo]
- Cobblestone streets in Copenhagen haven’t been resurfaced in 500 years. That’s sustainable infrastructure. [WrathOfGnon’s Newsletter]
- From only being founded in 1949 to having no AI publication until 1980, the Chinese Academy of Sciences now firmly holds the top spot in quality AI research. [State of AI Report, 2021]
- In 1840, American George Washington Whistler, father to the famous painter, visited Russia and recommended a wider gauge for their railroads than the rest of Europe. This has enormous ramifications as today “no other European nation uses railroads to the extent that the Russian army does“. [War on The Rocks]
- From a design concept to a 95% complete prototype in just 2 years, Starship could be a game changer for space cargo – “intended to reach numbers as low as $1m/T and 1000 T/year for cargo soft landed on the Moon. Apollo achieved about $2b/T and 2 T/year for cargo soft landed on the Moon.“ [Casey Handmer’s Blog]
- UPS, in order not to upstage their customers, decided on using the subtle Pullman brown, the colour used on railroad cars to minimise signs of dust and dirt. [American Business History]
- In the early days of his fund, Third Point, Daniel Loeb used to post on forums as “Mr. Pink”. [Cloud Valley]
- As of 2021 “over 80% of global CO2 emissions are “pledged” to be eliminated if we include what is currently in policy documents.” [IEA Report]
- Despite Nike pulling all products from Amazon, its search rank on Amazon’s webpage search hasn’t been affected. [Market Places Year in Review 2021]
- Michael Lewis took a ten-year break after his hit book (Liar’s Poker) before he wrote his next one. [Collab Fund]
- One of John Foley, Peleton founder’s, “sales techniques was to have customers test out the bike; he’d give them headphones and turn up the volume so when they talked to him about how much they liked the product they’d end up shouting an endorsement to passers-by.“ [Snippet Finance]
- “Tailpipes are now so clean for pollutants that, if you were starting out afresh, you wouldn’t even bother regulating them.” Not so for tyres. [The Guardian]
- In 1984, The energy sector made 27% of all S&P 500 earnings, today that number is 1%. [Goldman Sachs]
- “One Kuwaiti diplomat managed to accumulate two unpaid parking fines every working day for a year” when working at the UN in NYC. There is a correlation between parking violations in NYC by diplomats and corruption in their home countries. [Tim Harford]
- Xi Jinping surpassed Mao Zedong in the number of times his name is mentioned on the front page headlines of the People’s Daily. [Dailyshot]
- You can now track what suppliers or manufacturers a company or product uses, based on bill of landings data for all US imports. [ImportYeti]
- 30 years ago, 65% of all funds in the US were managed by a single fund manager rather than a team, today that number is down to just 20%. [bpsandpieces]
- “Imagine it’s 10:00 AM on a small pond with a single lily pad. If the number of lily pads on the pond doubles every minute, and the entire pond is full of lily pads by 11:00 AM, at what time is the pond half full of lily pads?“ Answer in the link. [Of Dollars and Data]
- Limb extension surgery (it’s a thing) is one of the few cosmetic surgeries that has a documented financial benefit – every inch of height is equal to $800 more in annual earnings for men. [Glimpse]
- “People in some Greek regions work up to 12 hours longer than people in some regions of the Netherlands.“ [EU Data Journalism Network]
- Successful founder VCs have investment success rates that are 6.5% higher than professional VCs. [NBER]
- “On average people thought that Muslims made up 27% of Americans when the true proportion is 1% or that gays and lesbians made up 30%, when the true number is 3%.” [YouGov]
- Britons now pay almost as much out of pocket for healthcare as Americans. [FT].
- In 1967, 82.7% of Americans lived with their spouse. Today it is 37.5%. [StaDaFa].
- Black women in America die at childbirth at comparable rates to those seen in developing countries. [FT]
- “About 15% of gasoline customers venture inside to make additional purchases during their car’s few minutes at a Circle K pump, while 40% of EV drivers do so during the 20–30 minutes their vehicle is charging“ [Harding Loevner]
- Twitter makes sell-side analysts better. [Evidence Investor]
- Africa’s population is forecast to keep growing, reaching 35-40% of the world’s estimated population by 2100. How can we be so sure – “a large number of the mothers whose children will drive growth to 2050 have already been born.” [Adam Tooze]
- “85% of energy usage comes from burning things” and “human civilisation is powered by combustion.” [Mises Institute]
- “Over the last 20 years, across four Presidents (two Republicans and two Democrats) we have had exactly one energy secretary with any real-world energy experience before they were brought into the President’s cabinet“ [Lykeion]
- In 2023 the number of realtors working in the US has surpassed the 2008 housing bubble peak. [Jeff Weniger]
- The rate of growth of total football (soccer) transfer fees by season has flattened out. [James Reade]
- US patent applications cite recent papers less and less. [Whats New Under the Sun]
- In a stark change from the past – “Today, countries where more women work, more babies are born.” [Vox EU]
- Of a total of 1228 issues of the New York Review of Books ever published only 1%, or 12 issues, had 50% or more articles written by women. Nine of these appeared in the past three years. 16 issues did not have a single woman contribute an article. [Dan Stone]
- New tunnels for New York’s East Side Access project cost $4bn per kilometer. A similar project in Paris was done for $230m per kilometer. South Korean tunnels cost $100m per kilometer. [Utah University]
- In 2016 only 6% of all S&P 1500 CEOs had appeared on a podcast, in 2020 22% had. [SSRN]
- Leading actors in movies are getting a lot older – in 2020 a record 20% of films had a lead actor over 60 years old. [Patrick Collison]
- When 1,700 people were asked what the probability implied by the words “real possibility” was – answers ranged from 20% all the way to 80%. [HBR]
- It is estimated that the average internet user sees 490,000 words per day – equivalent to the length of War and Peace. [The Guardian]
- In the UK, an 1839 Act of Parliament created the Uniform Penny Post – a single low postage rate and the first adhesive postage stamp, replacing a complex distance-based system. It was the most profound change in communication history. [CEPR]
- Countries, where men do more housework, have higher total fertility rates. [Vox EU]
- “At the end of Jane Street internships: interns get a stack of 100 poker chips and spend half a day getting asked brainteasers and then betting on their confidence in the answers … This would actually be a pretty fun way for a math-minded person to spend a few hours, if it weren’t so high-stakes: the winners get a job from which people routinely retire rich in their 30s, and the losers… don’t.“ [The Diff]
- One team of funders in the 1930s supported all but one of the 18 scientists who went on to receive the Nobel Prize in genetic molecular biology research, funding this revolution. [New Science]
- “I learned this one from the psychoanalysts. Nobody likes an awkward silence. If a patient tells you something, and you are awkwardly silent, then the patient will rush to fill the awkward silence with whatever they can think of, which will probably be whatever they were holding back the first time they started talking. You won’t believe how well this one works until you try it. Just stay silent long enough, and the other person will tell you everything.“ [Slate Star Codex]
- “The reason we don’t have fusion already is because we, as a civilization, never decided that it was a priority. Fusion funding is literally peanuts: In 2016, the US spent twice as much on peanut subsidies as on fusion research“ [Astral Codex Ten]
- Fire departments in the US now perform the role of ambulances – in 1980 they attended 5 million medical calls but in 2020 this was 24 million (Covid notwithstanding, a huge rise). [Terra Nullius]
- Three firms (Vanguard, BlackRock, and State Street) in 2021 held on average 28.2% of all shares in a small company in the S&P 600 benchmark. [Lazard]
- “Netflix was not founded after its co-founder Reed Hastings was charged a $40 late fee by Blockbuster. Hastings made the story up to summarize Netflix’s value proposition, and Netflix’s founders were actually inspired by Amazon.” [Wikipedia]
- “The 2021 baby bump is the first major reversal in declining U.S. fertility rates since 2007 and was most pronounced for first births and women under age 25, which suggests the pandemic led some women to start their families earlier. Above age 25, the baby bump was also pronounced for women ages 30-34 and women with a college education, who were more likely to benefit from working from home“ [NBER]
- Electrical vehicle prices are growing much faster than combustion vehicle prices – not what you would expect from a new technology. [S&P Global]
- 6174 is magical. Take any four-digit numbers (at least two different digits), arrange them in descending and then ascending order to get two four-digit numbers, subtract the smaller from the larger. Repeat. You will eventually come back to 6174 – Kaprekar constant. For more numbers trivia play [Bull Bear].


