Earlier this year we covered Biogen’s decision to file Aducanumab (their experimental treatment for Alzheimer’s Disease) here and here.
This saga reignited this past week with the publication of FDA adcom documents which on the surface looked positive sending the shares soaring only to be voted down (8-1) at the meeting on Friday sending them crashing down.
This really good blog post discusses these events and why it is always important to read all the details.
The final FDA outcome is yet to be determined (Adcom decisions aren’t binding) and as previously highlighted could be political.
“When teaching, an idea is often put forth and the students may not grasp it. It’s like sailing into the wind. So what do you do? You tack with an analogy. You move to the side so that in the end you will make progress towards a goal that can’t be reached directly. “
An awesome database of analogy and metaphor to improve your writing – Metamia.
“I came across this guy, Sean Ellis. Now, Sean ran growth in the early days at Dropbox, LogMeIn, and Eventbrite. He even coined the term “growth hacker.” Now Sean found a leading indicator of product to market fit, one that is benchmarked and predictive. Just ask your users this. How would you feel if you could no longer use the product? And measure the percent who answer, very disappointed. After benchmarking hundreds of startups, Sean found that thecompanies that struggle to grow always get less than 40% very disappointed. The companies that grow most easily almost always get more than 40%, very disappointed. In other words, if more than 40% of your users would be very disappointed without your product, you have initial product to market fit. Now, this metric turns out to be more objective than a feeling. It predicts success better than net promoter score, and it’s not only the best way to measure product to market fit”
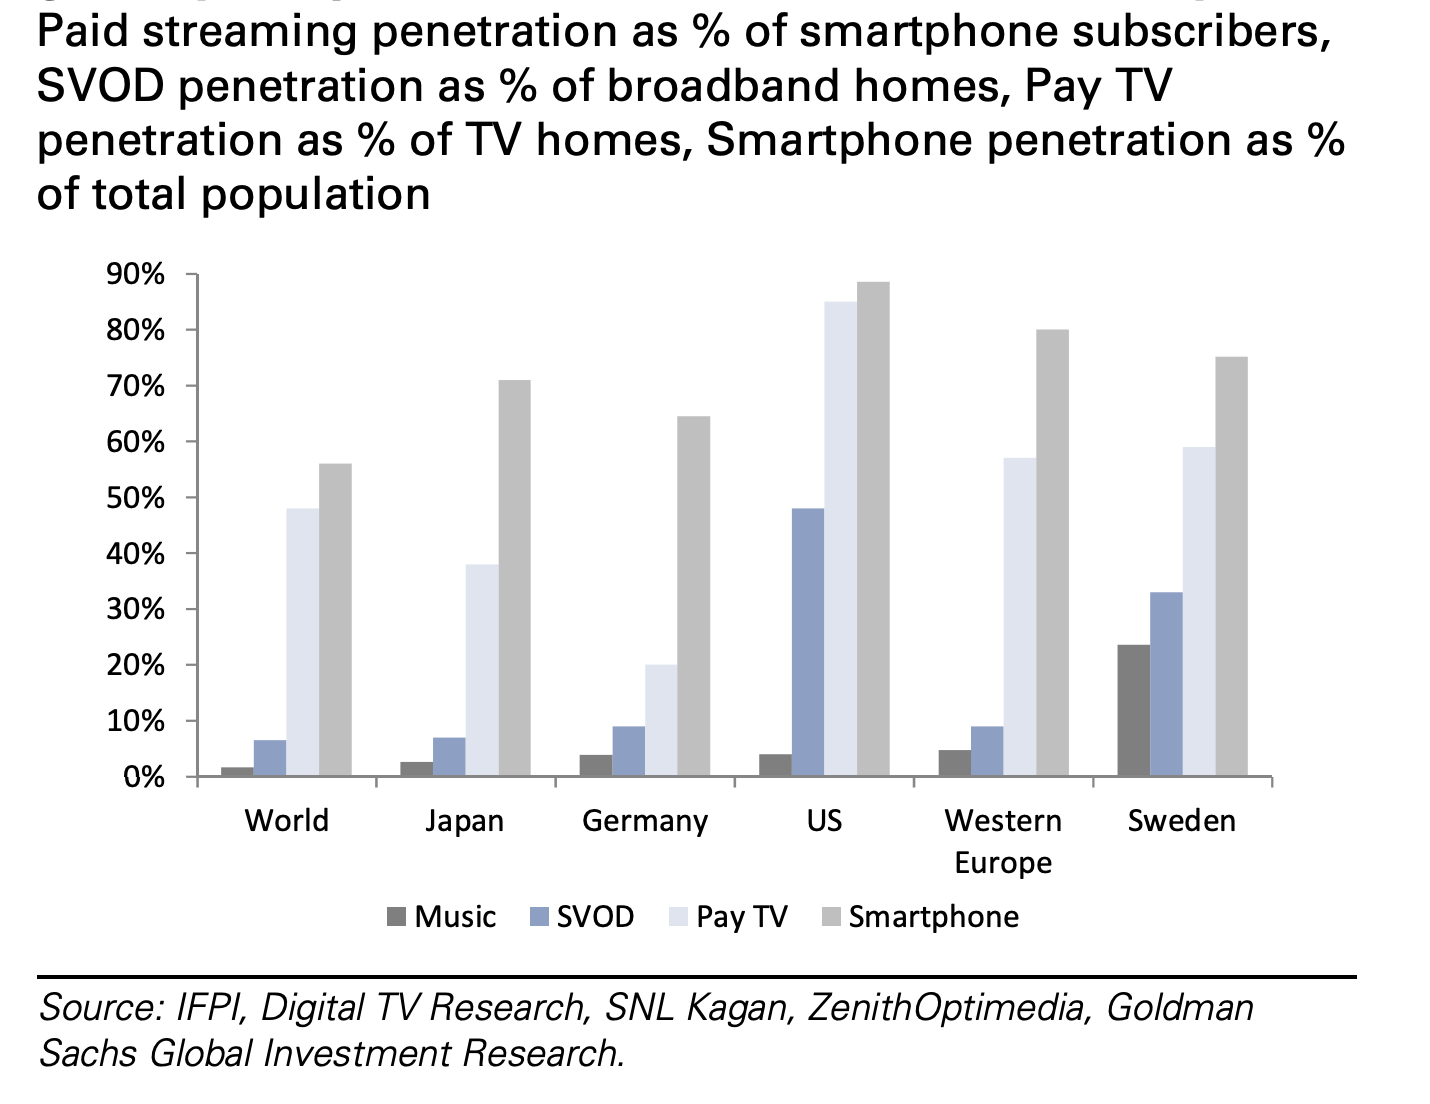
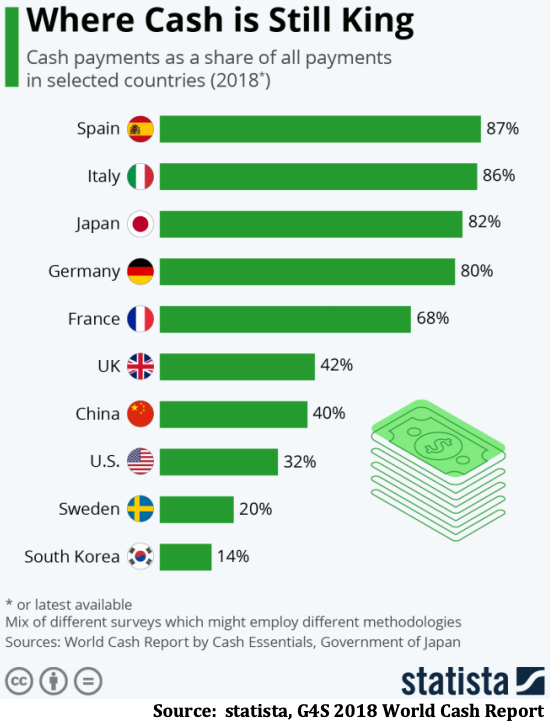
Eye opening stat from Domino’s Pizza courtesy of The Transcript.
“There was a trend toward digital ordering pre-pandemic, and that significantly accelerated during the pandemic. I don’t expect customers to go back to calling on the phone, I expect digital ordering to continue to grow post-pandemic. And I feel that we are very well-positioned in that space today with 75% of our sales in the U.S. digital as we sit here today”
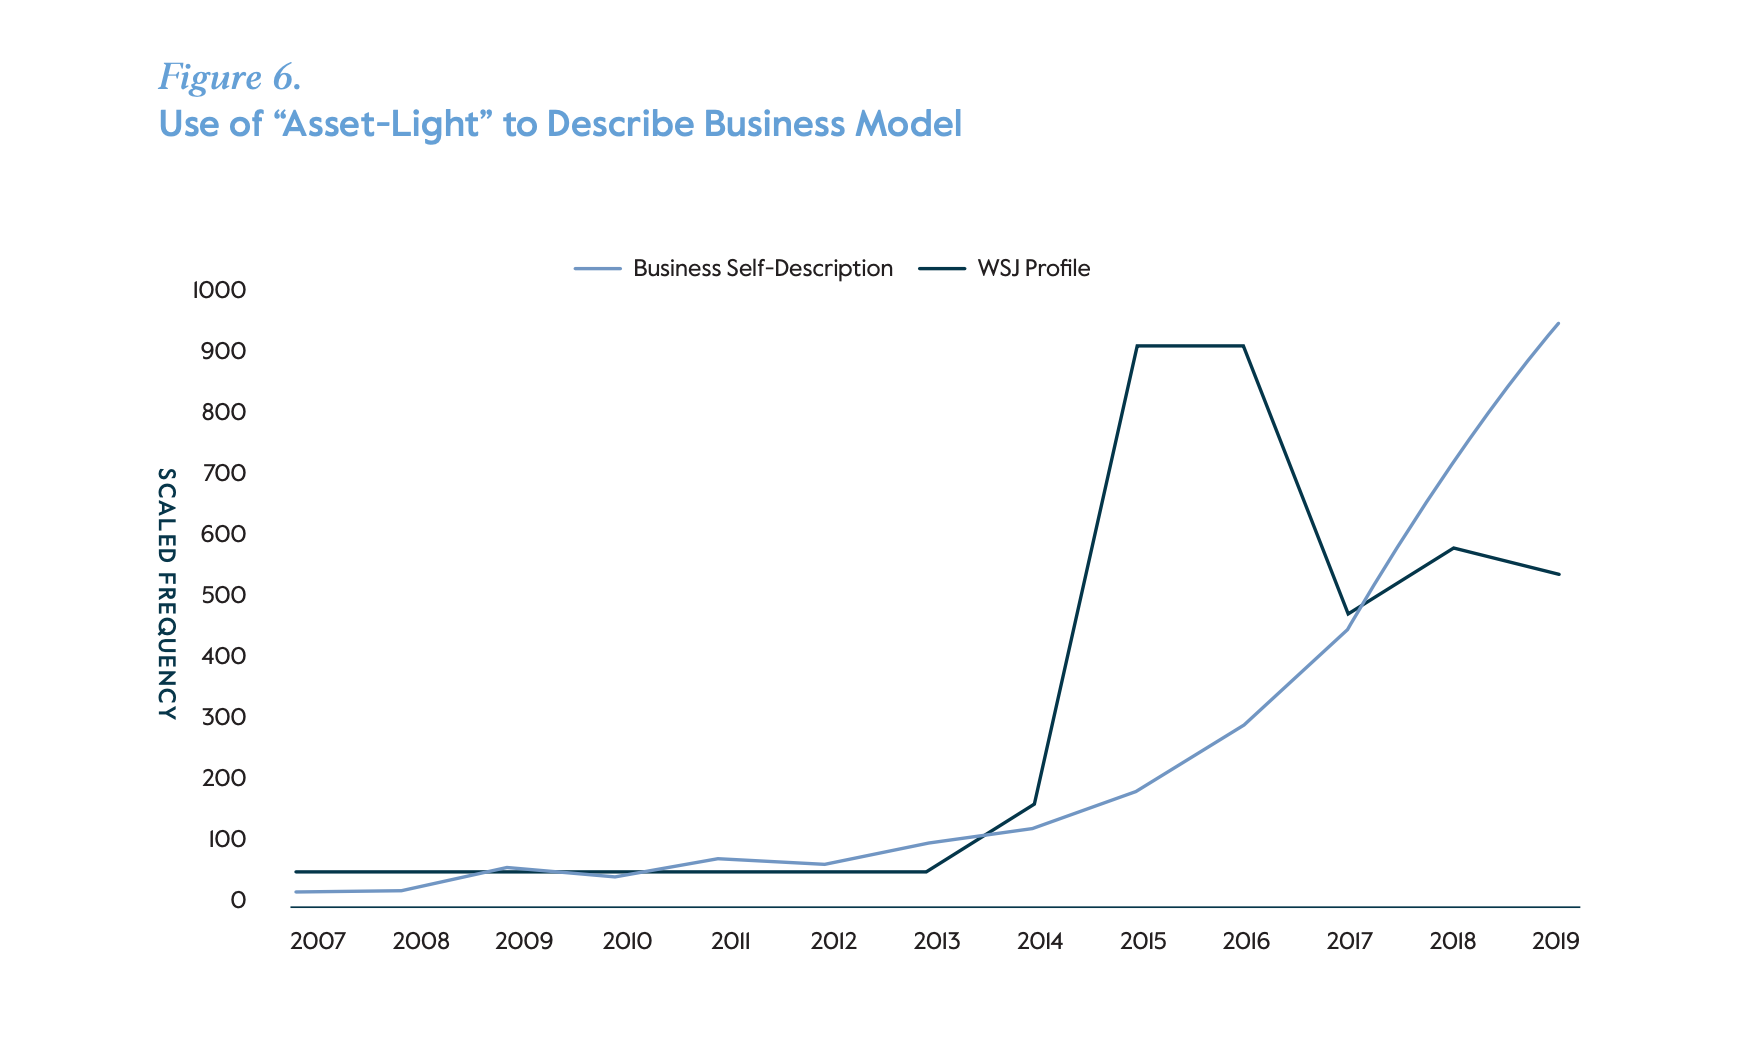
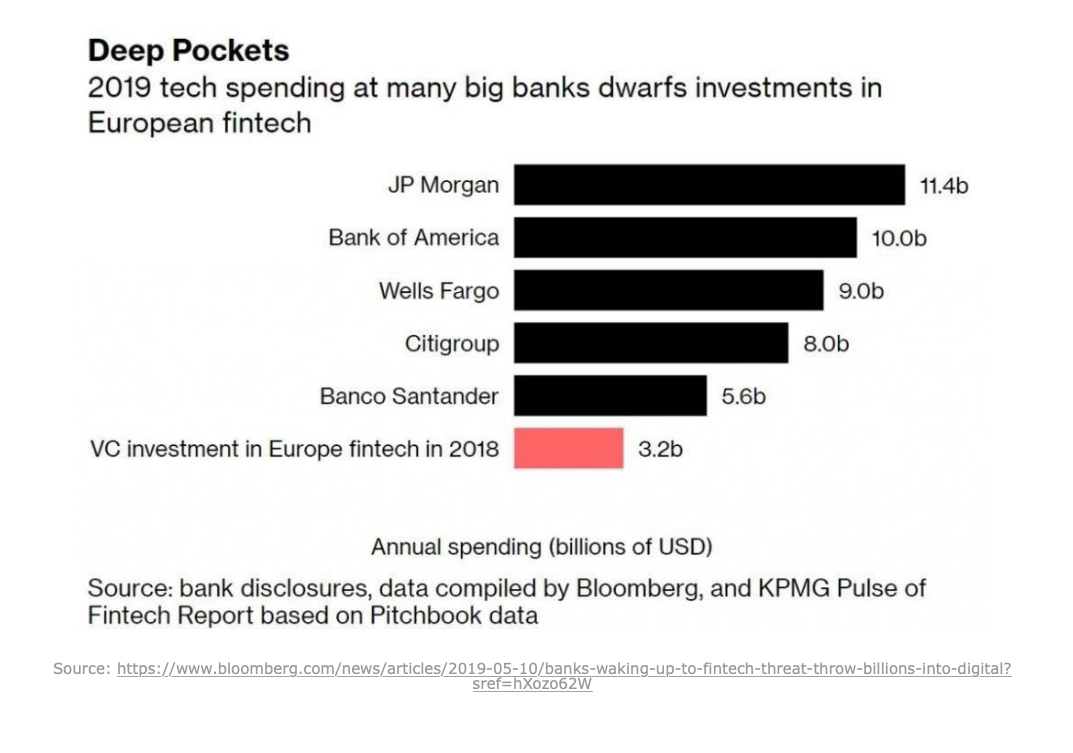
Suddenly, “size,” “footprint” and “incumbency” came to be understood as an expensive legacy rather than a competitive advantage. Investors wanted companies that were smarter instead of larger, as reflected in the new patois of sell-side flipbooks which now marketed businesses as “agile,” “disruptive,” “nimble” and – especially – “asset light”.
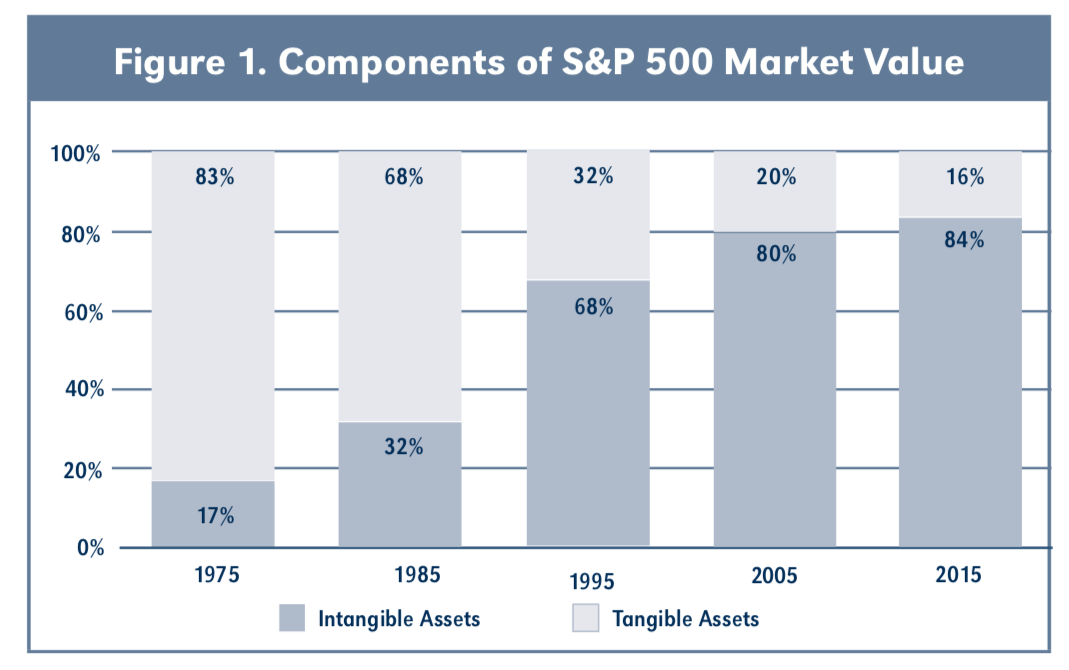
First Snippet Blog article points the finger at the pictured chart.
The chart depicts the rise of intangible assets in firm value described as a “second industrial revolution”, burying with it traditional analysis, accounting, value investing and lending support to ESG.
By digging into the definition and associated formula, the article argues this chart is in fact just showing the rise in valuation across firms as measured by Price to Tangible Book.
By framing the problem in the first way one assumes a single explanation for the rise – intangible assets, itself an ambiguous word, when the intellectually honest way should be to frame it in the second way, which leaves the question open.
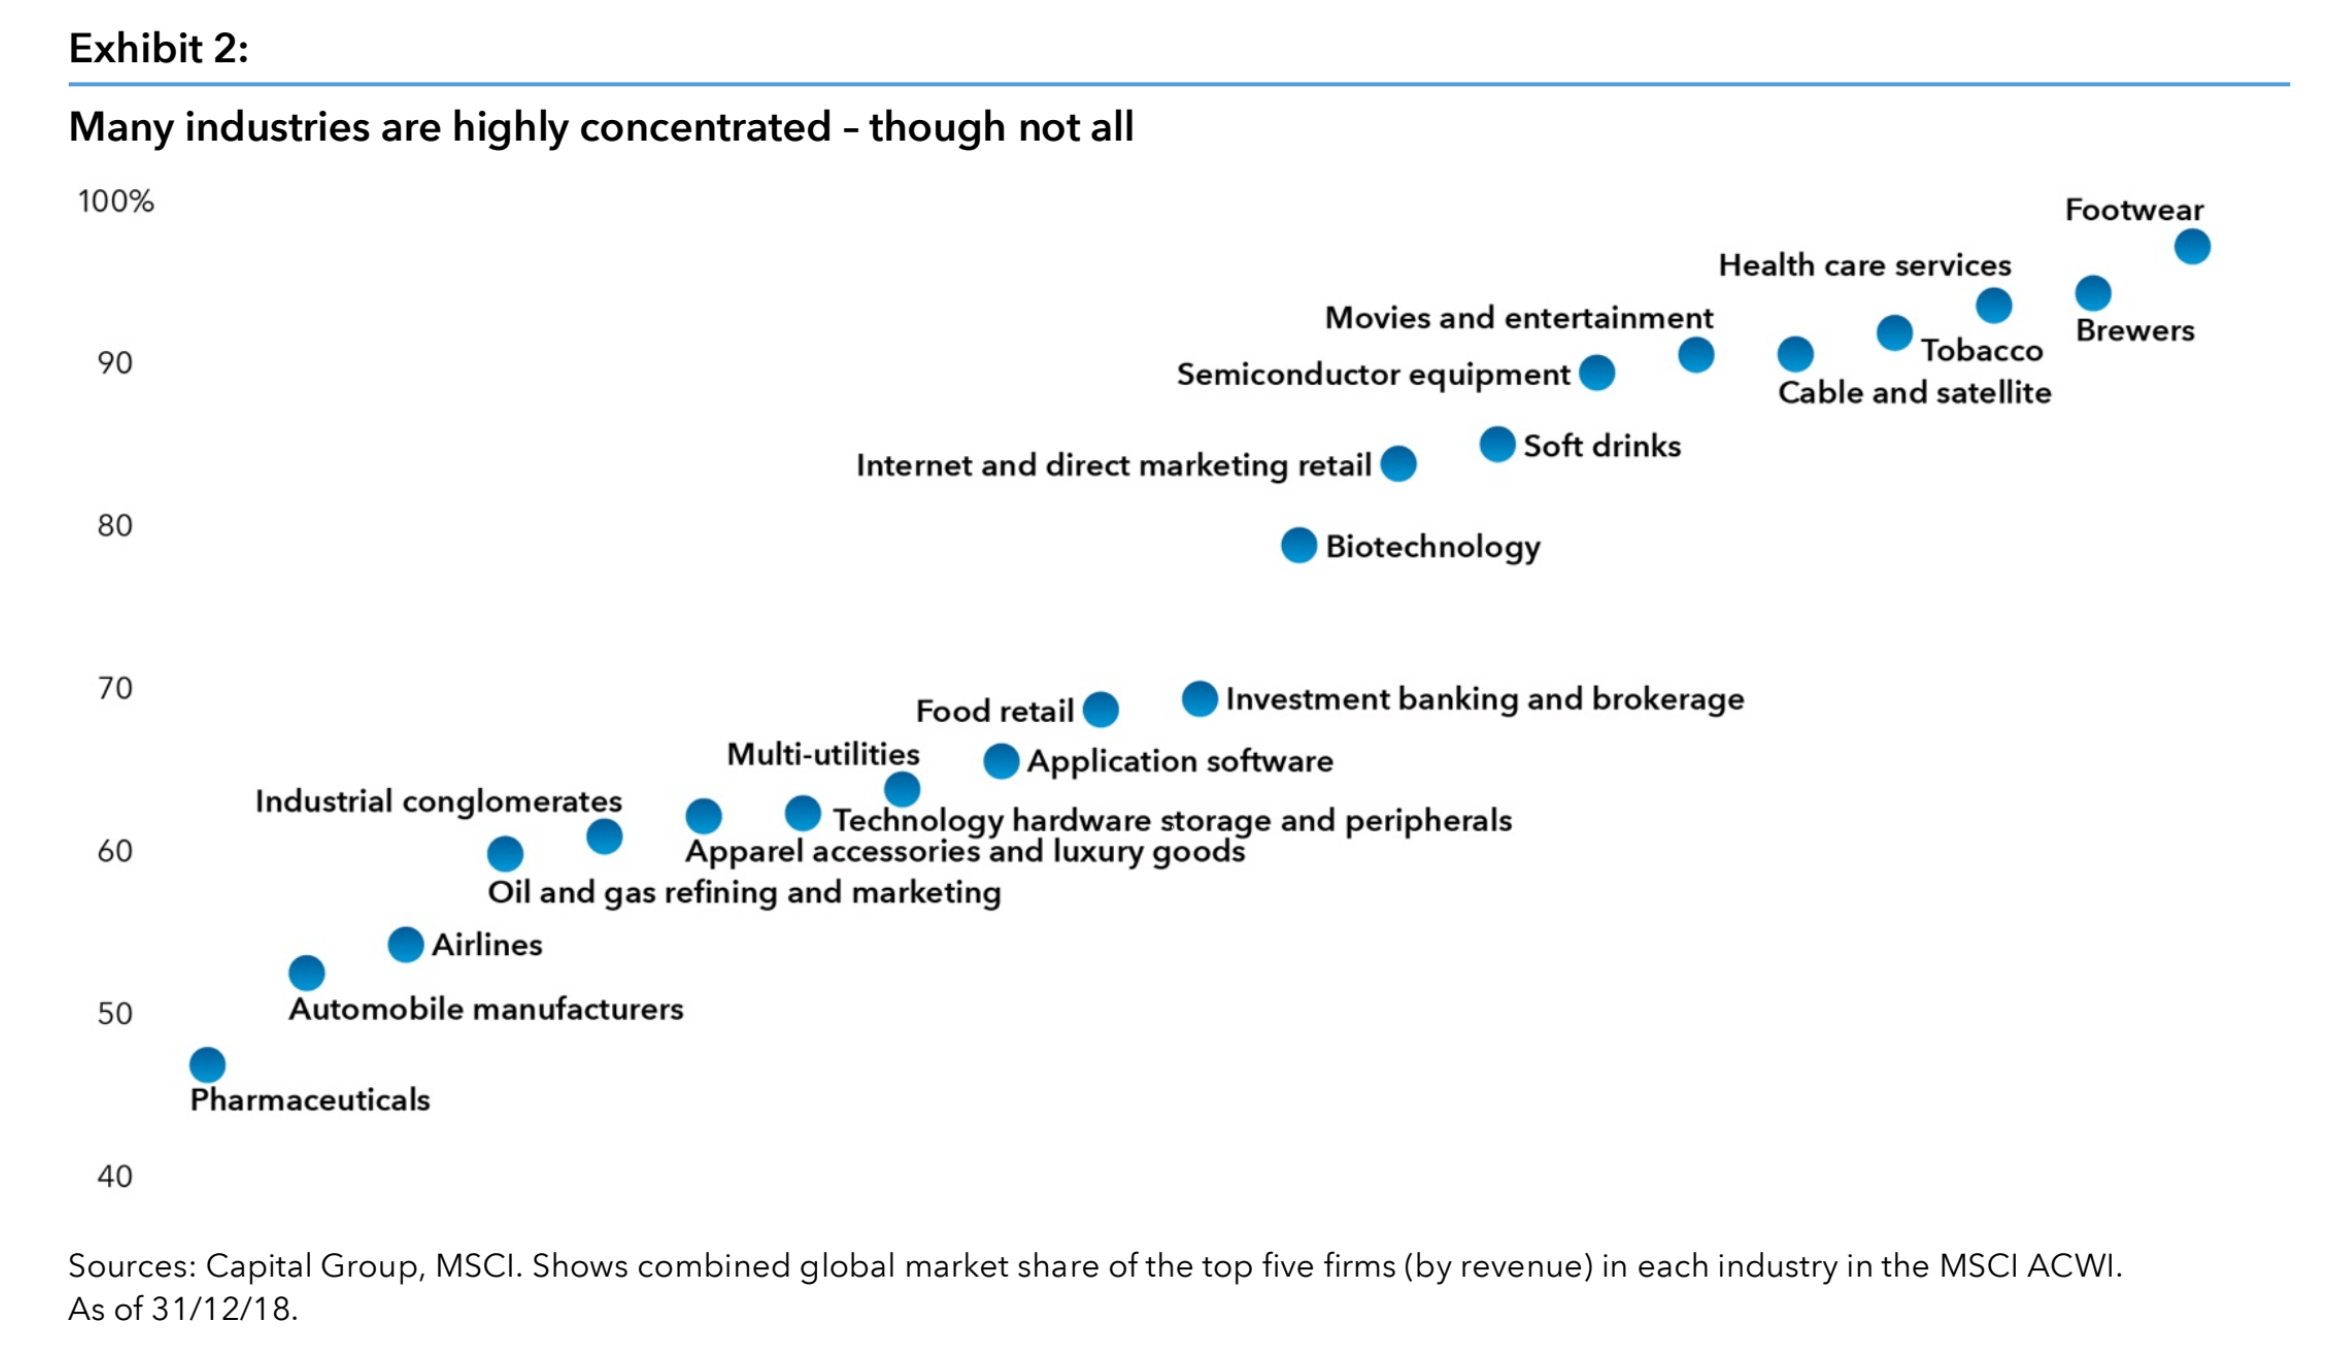
A thought-provoking piece (first one in the link) arguing against concentrated equity portfolios – the orthodoxy of the day.
Concentrated portfolios are built on the idea of “analytical certainty” which lends itself easily to “overconfidence” and “overweighting hubris”
Institutions that hold several such concentrated portfolios, thereby diversifying, might find instead they suffer from other forms of correlation – in terms of stock size (large cap) and style (quality or growth).
They will also find that the higher fees charged by concentrated active portfolios add up and don’t average down.
Most interestingly concentration “underweights luck” – that term most fund managers have pushed deep into their subconscious.