Skip to content
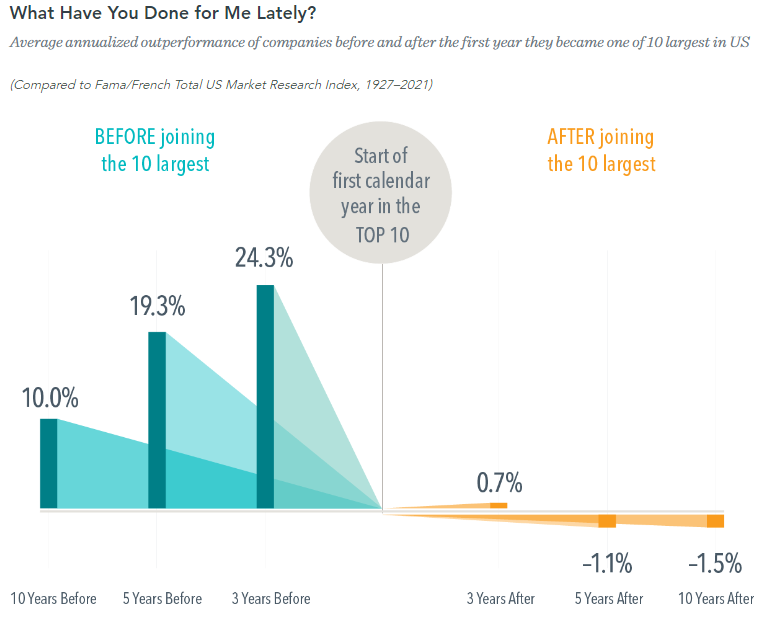
- Looks like a step change – should be positive for active management.
- Source: Blackrock.

- This chart “shows the average annualized outperformance of stocks after they’ve become one of the largest top 10 in the S&P 500.”
- “As you can see, the top 10 largest companies underperform by an average of -1.5% over the subsequent 10 years.”
- Source.

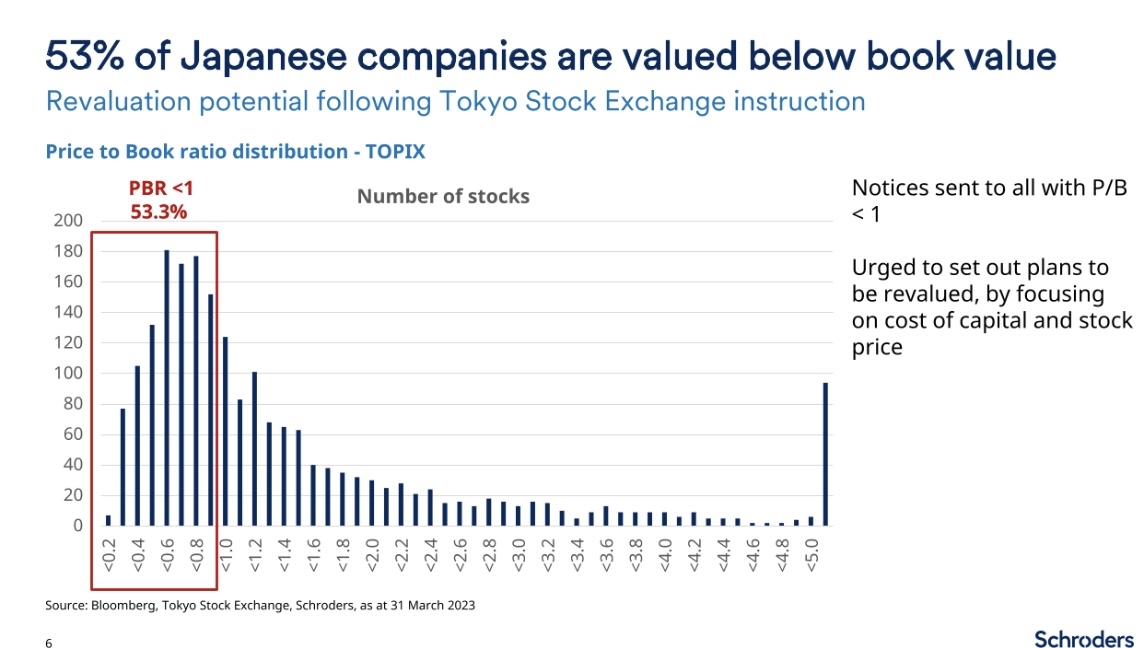
- Has been on a bit of a tear recently (TOPIX +19%).
- It really is a stand-out market – 53% of companies trade below book value.
- Change is afoot – Tokyo stock exchange sent letters to all of these urging them to set concrete plans to reverse this valuation.
- Source: Schroders.
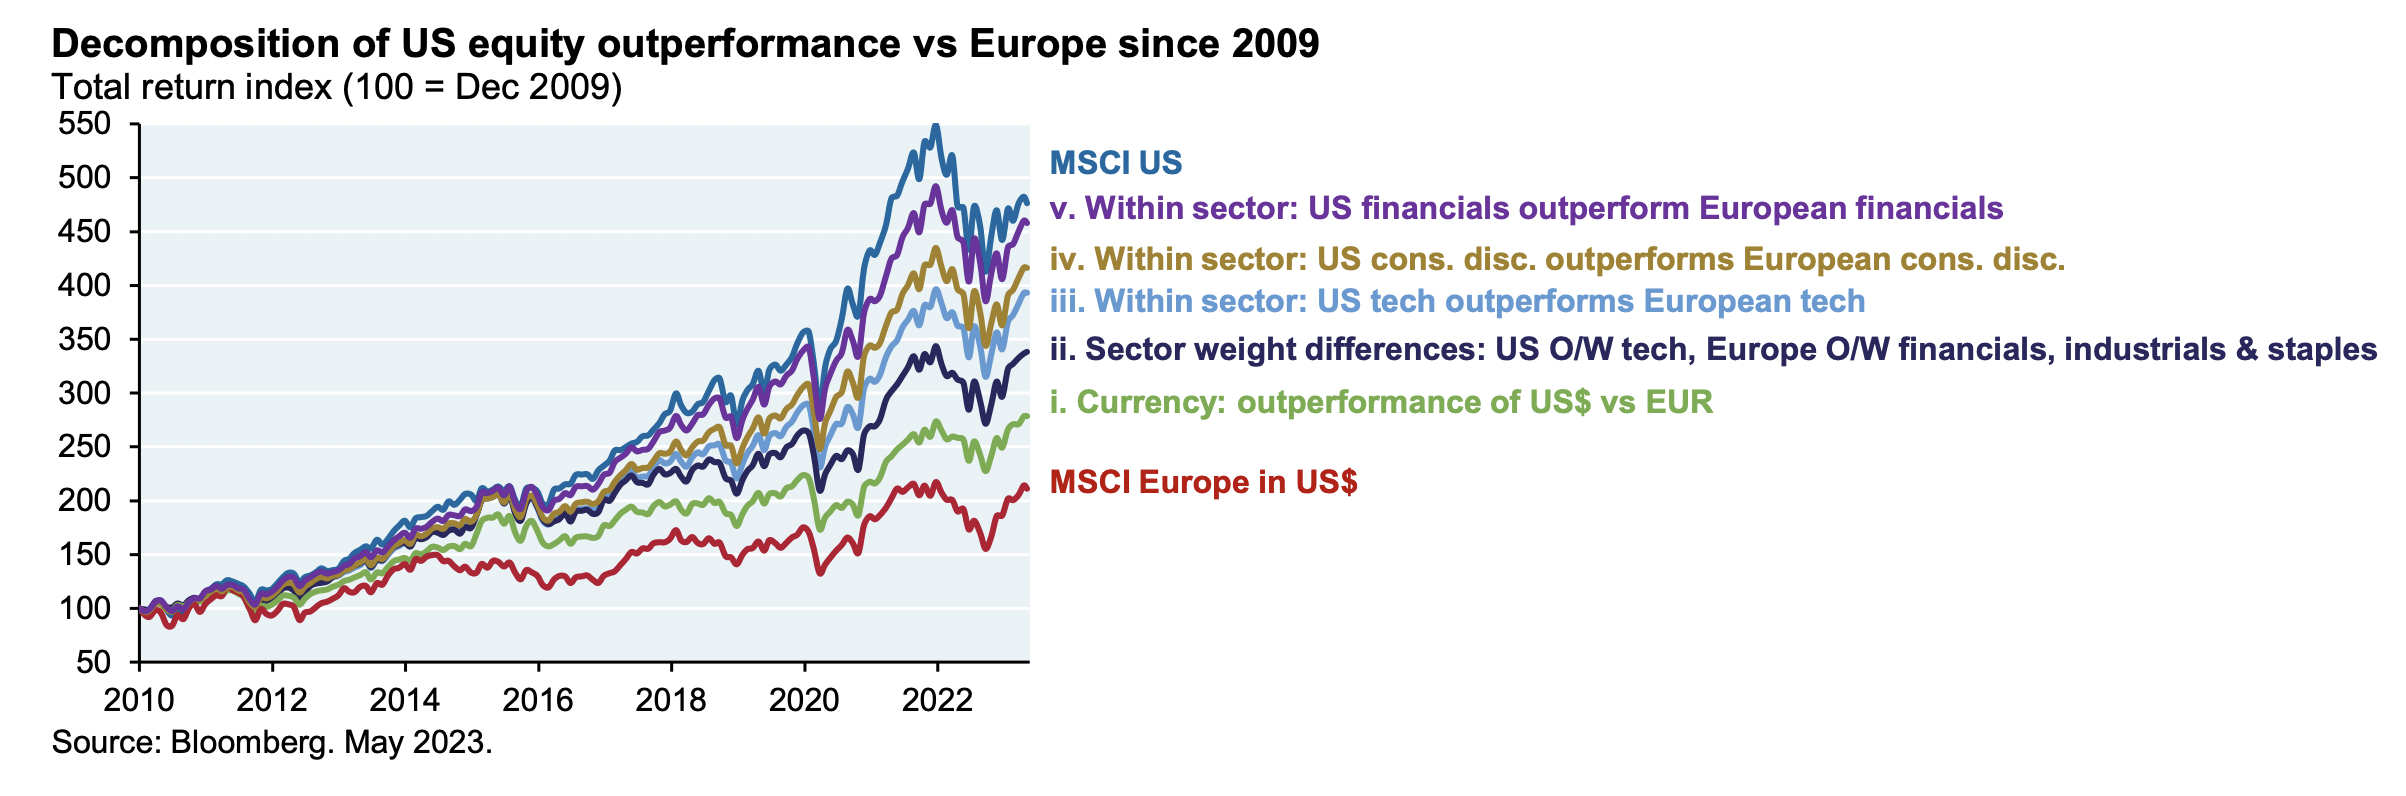
- Chart decomposing the outperformance of MSCI US vs. MSCI EU from 2010 until last year.
- Source.
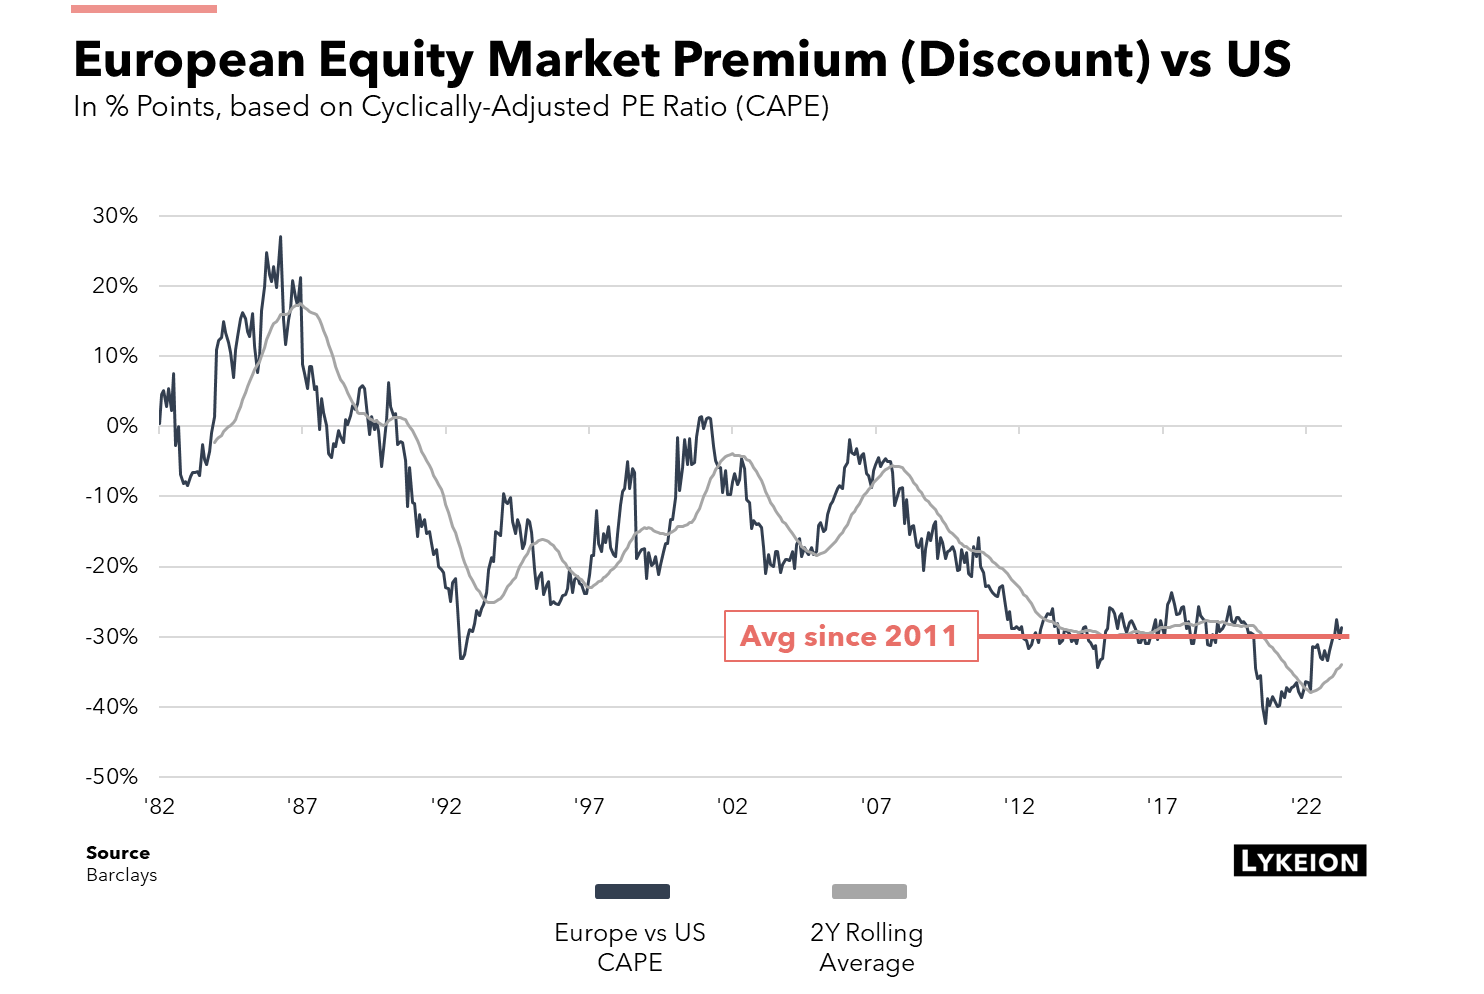
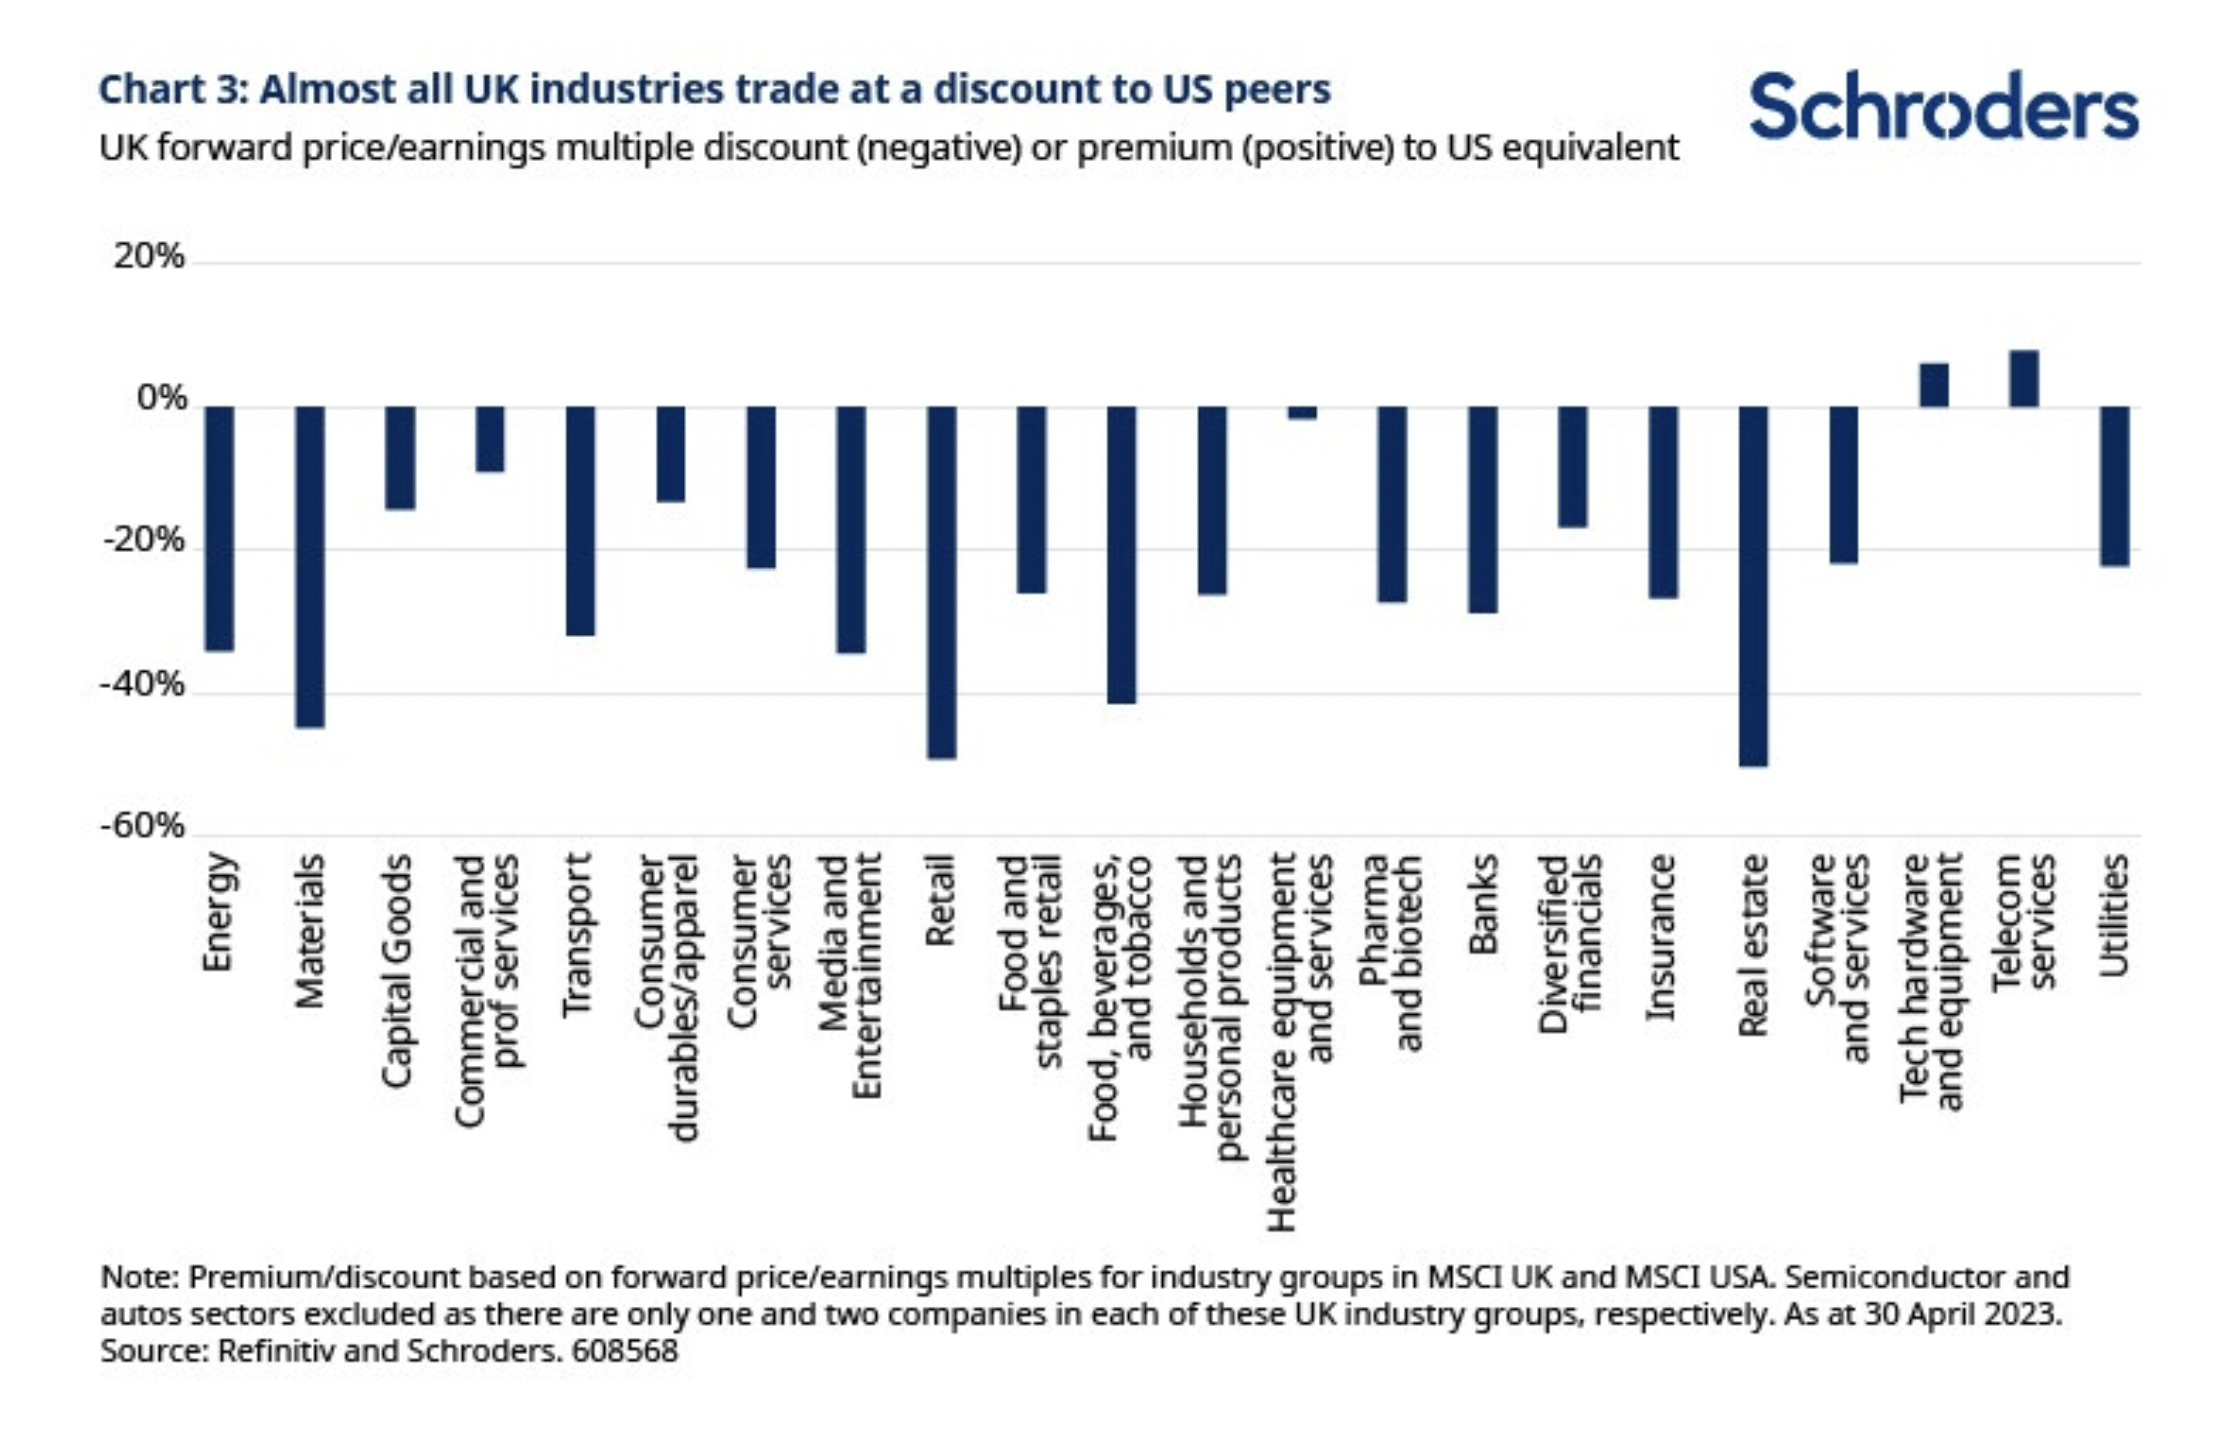
- After a recent rally, the discount is back to its post-2011 average.
- A nice set of six charts showing how cheap the UK is.
- The UK trades at a near-record 40% forward P/E discount to the US and 20% vs the EU.
- Almost every industry, as seen in the chart, is cheaper than the US.
- A topic Snippet has covered a few times.
- For example – (1) how to adjust valuation for intangible assets (here) and (2) why some people confound their importance (here).
- This is a great webcast with Michael Mauboussin and Kai Wu on the topic – (requires sign-up; grab a free two-week trial here).
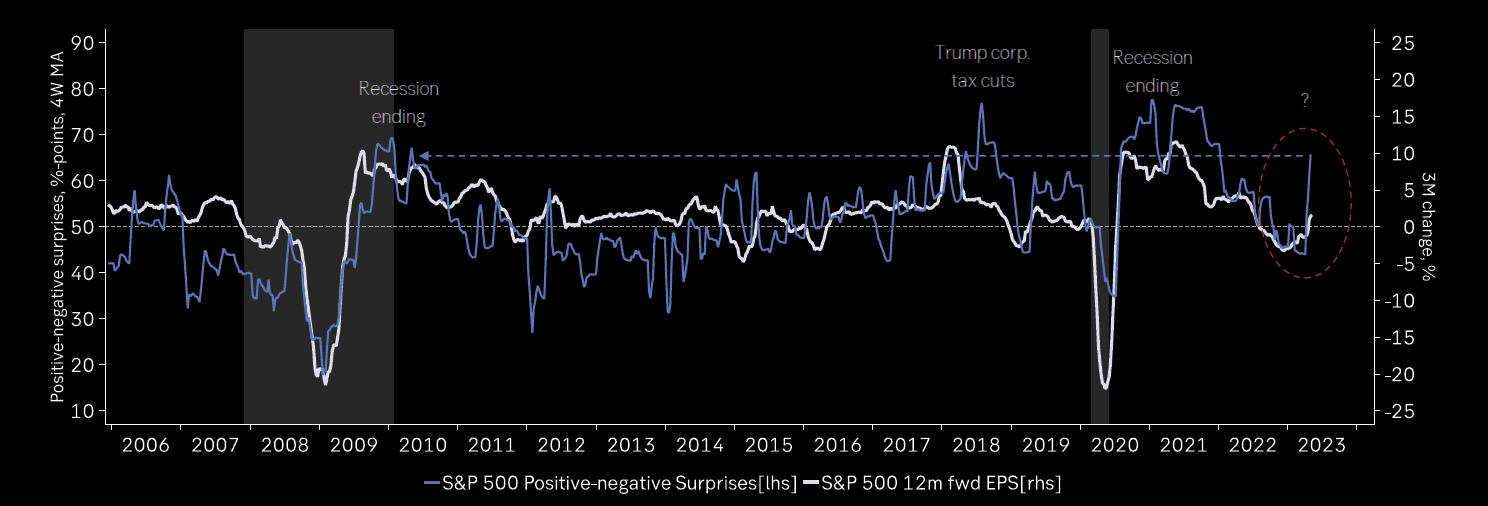
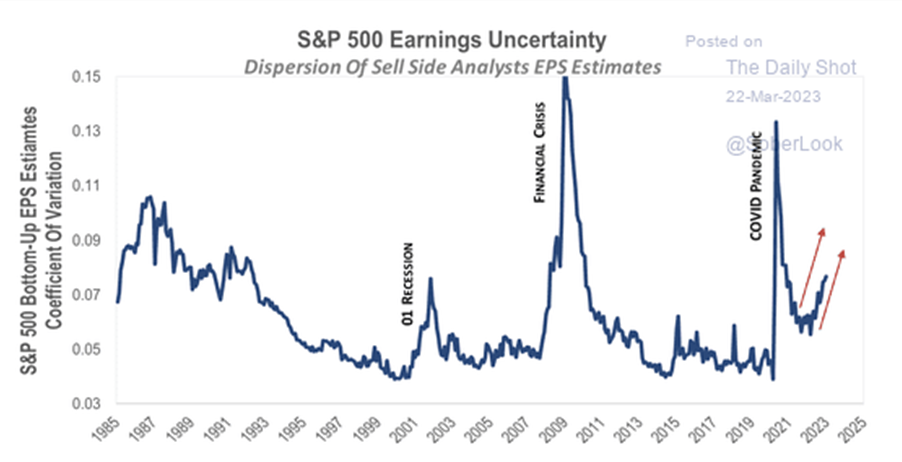
- Rare to see this level of positive surprises when a recession is expected.
- Source: themarketear.com.
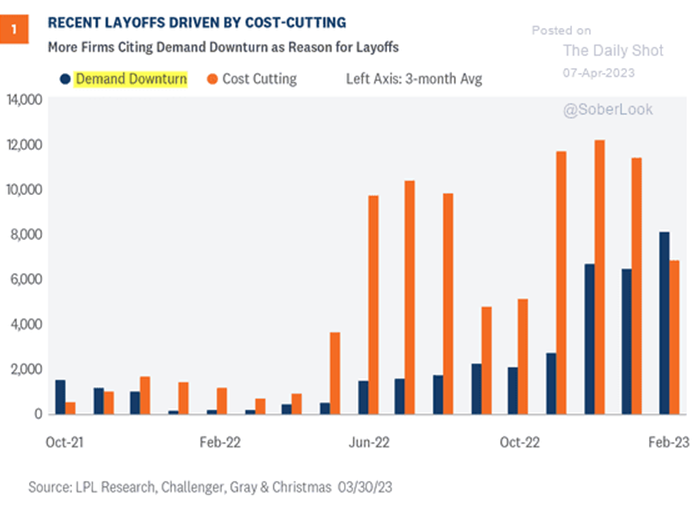
- “Demand downturn” overtook “cost cutting” as a key reason for layoffs.
- h/t DailyShot.
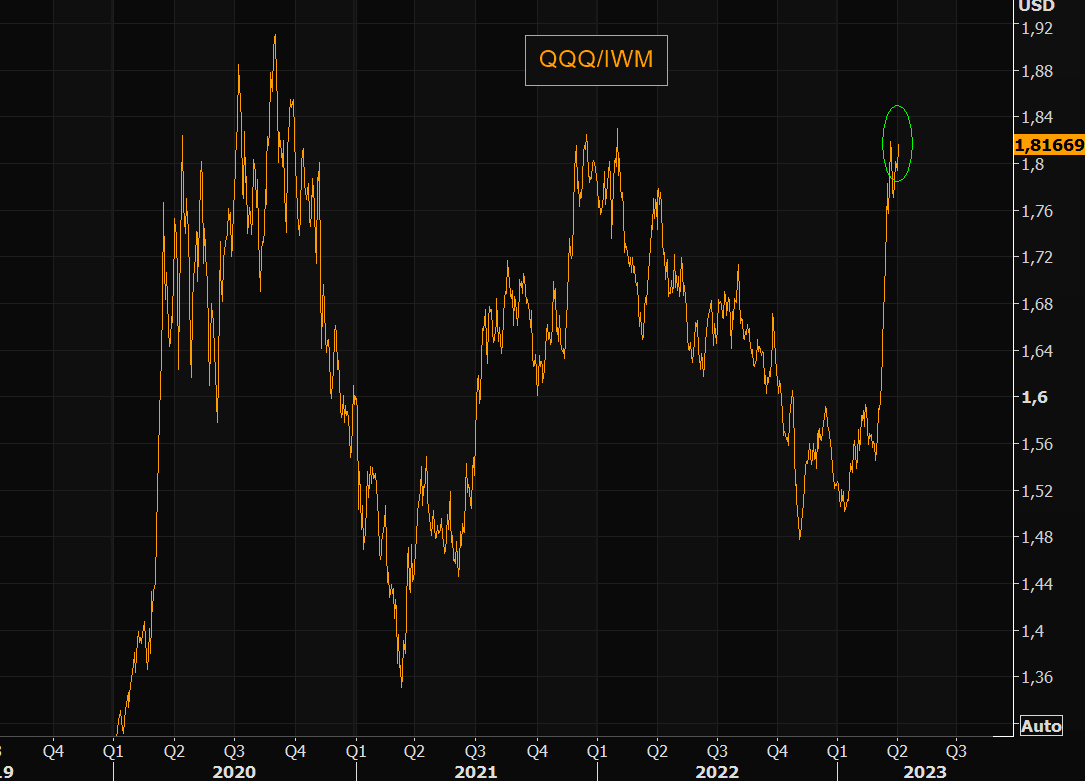
- Really something that QQQ relative to Russel 2000 (IWM) is almost back to 2021 peak with record speed.
- Source: themarketear
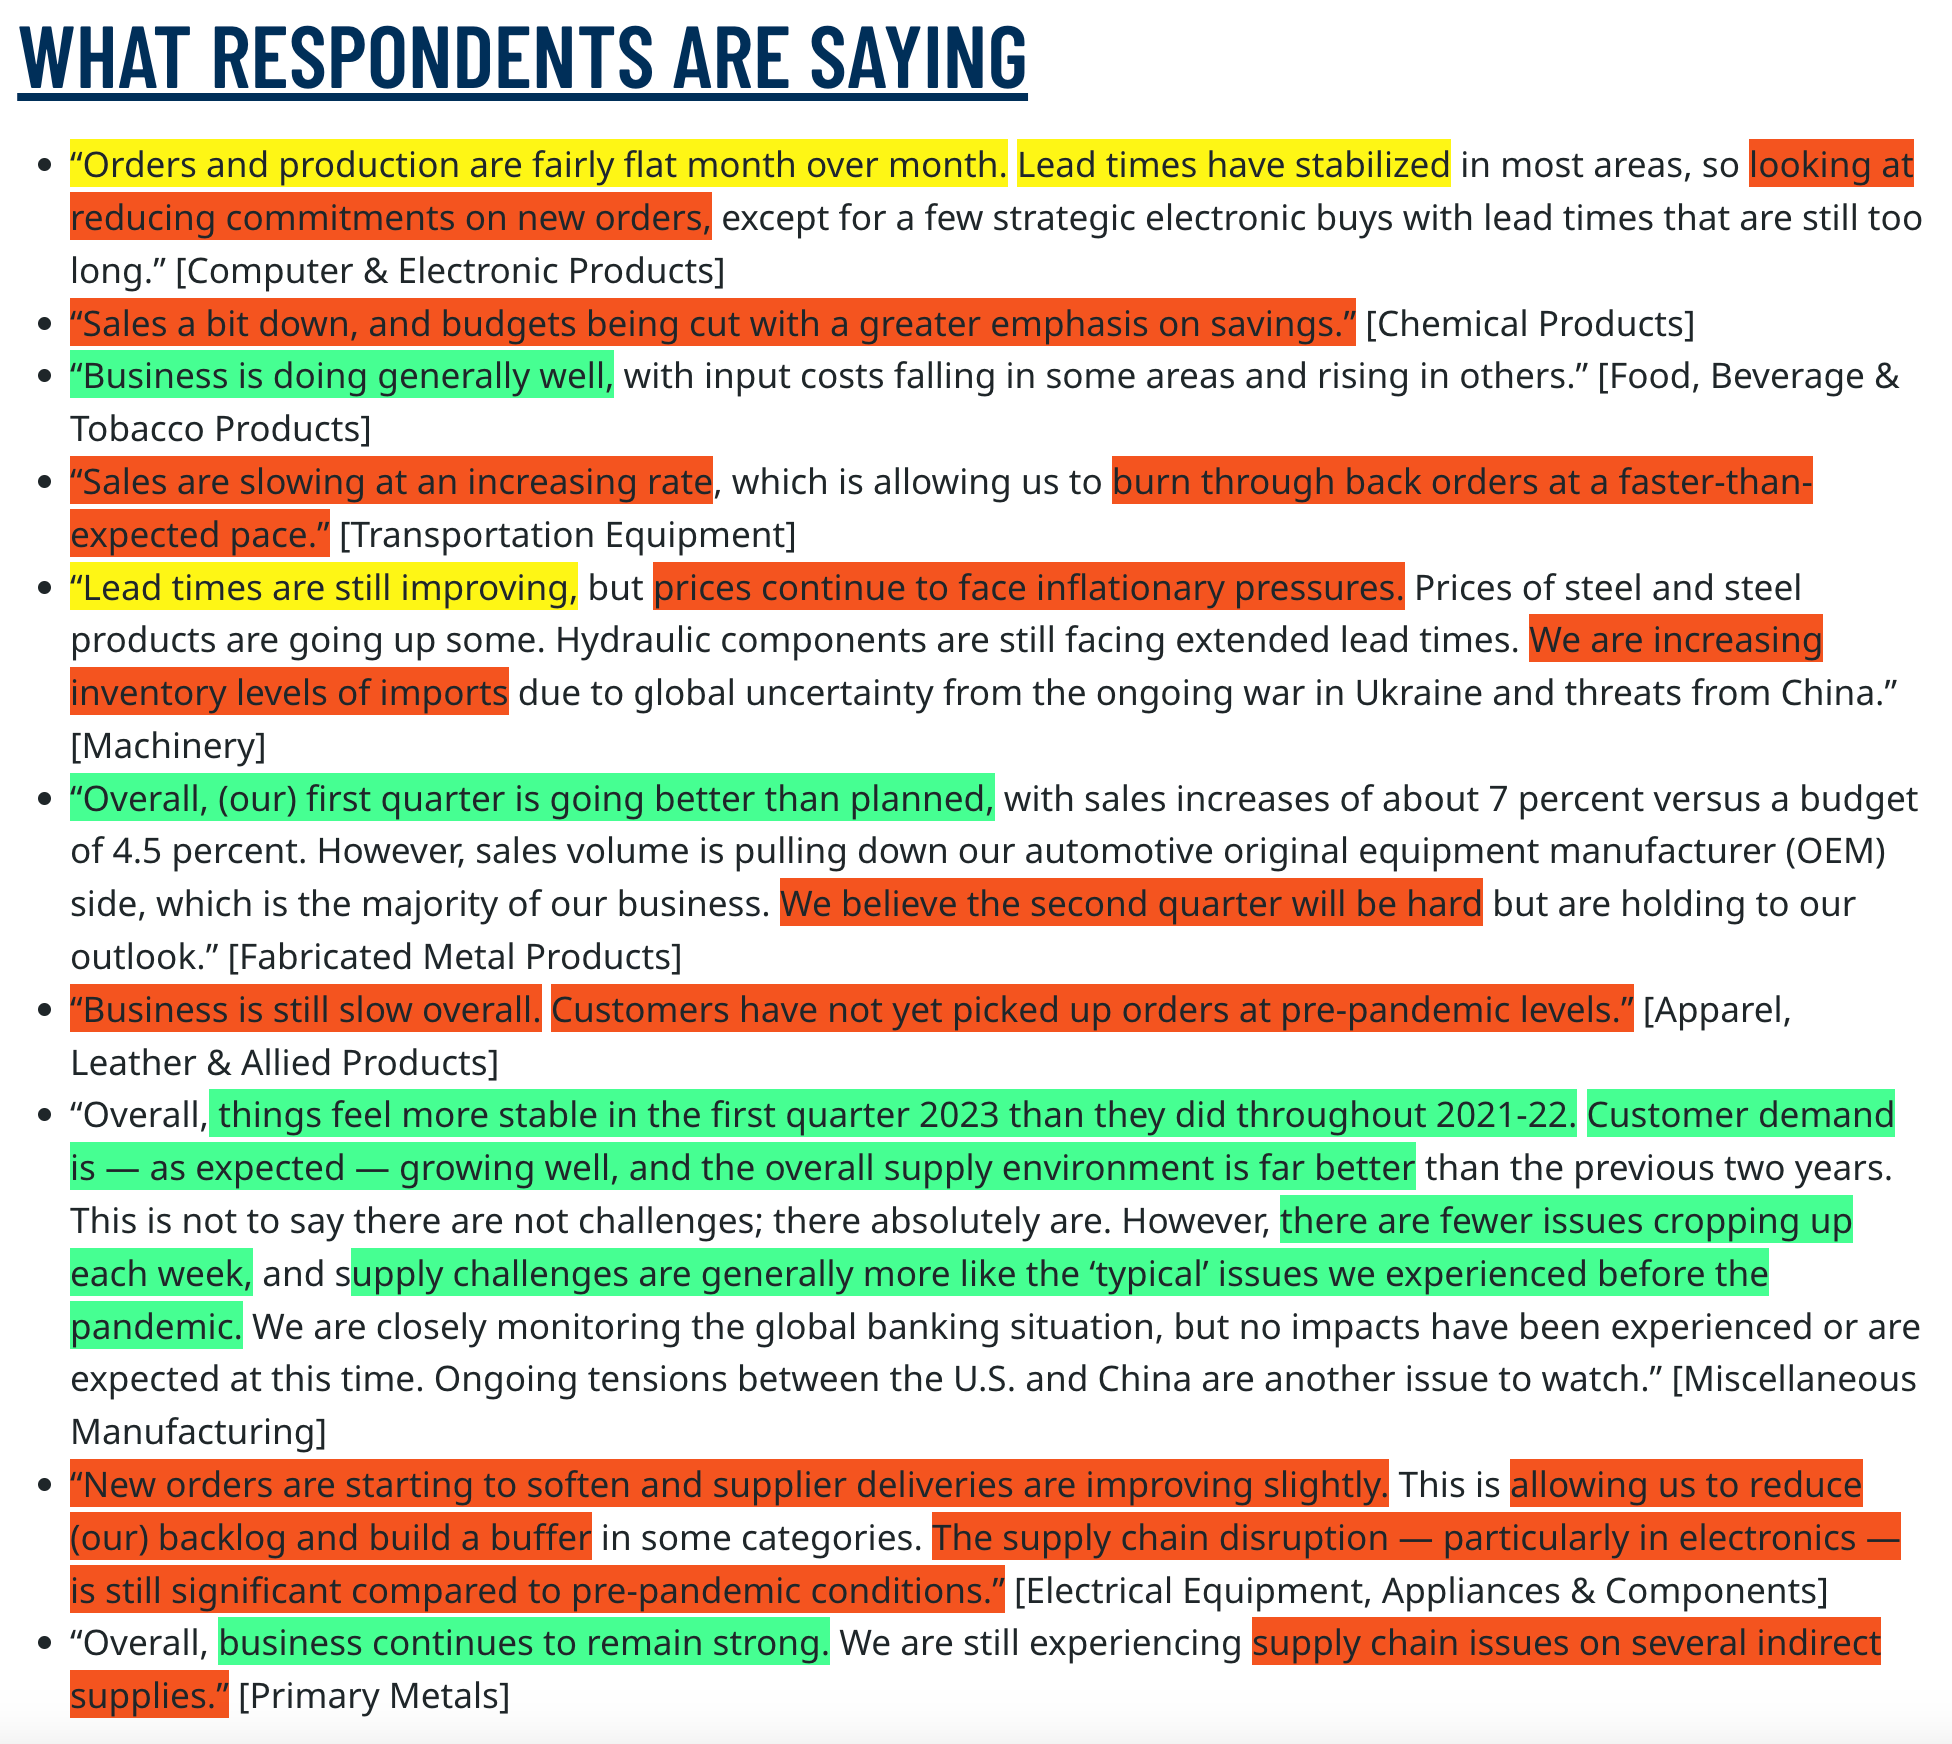
- Many investors look at the headline PMI number (46.3) but some of the guts of the release are well worth reading.
- FXmacro newsletter pulls the main quotes and categorises them into positive and negative.
- Very useful and worth subscribing.
- Typically a sign of economic turbulence.
- Source: Daily Shot.
- According to Stifel (via themarketear) historically stocks trade in a range and only start to properly struggle when recession is clear.
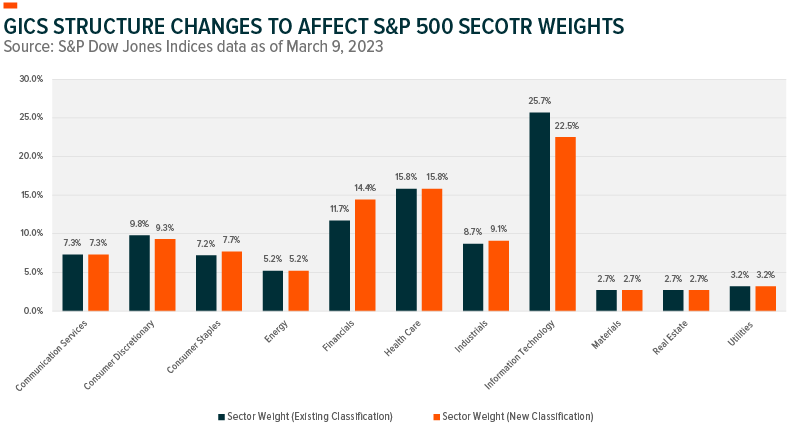
- Fintech is getting more recognition in the new GICS changes.
- As of March 17th, 11 S&P stocks will be reclassed out of IT and eight of them will land in Financials, into a new sub-industry focussed on payments.
- This will raise the Financials weight to 14% from 11% – though clearly reducing the weight of banks within that, at an interesting point in time.
- Source.
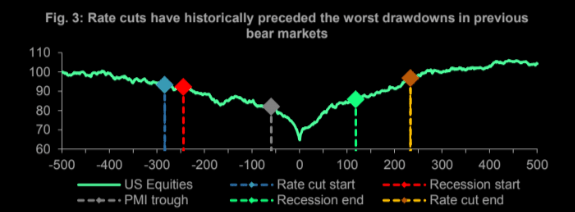
- Equities typically bottom some time after the first rate cut, based on historic bear markets since 1984.
- h/t themarketear.com
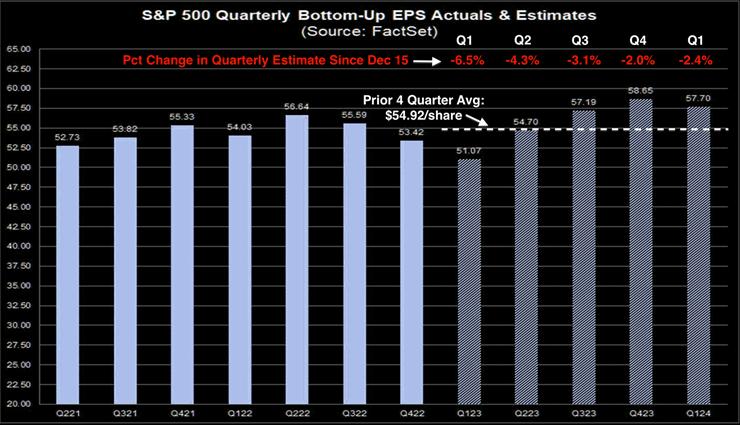
- Most of the earnings cuts have been to Q1/Q2 2023E.
- The typical pattern of an H2 recovery is still assumed.
- h/t themarketear.com
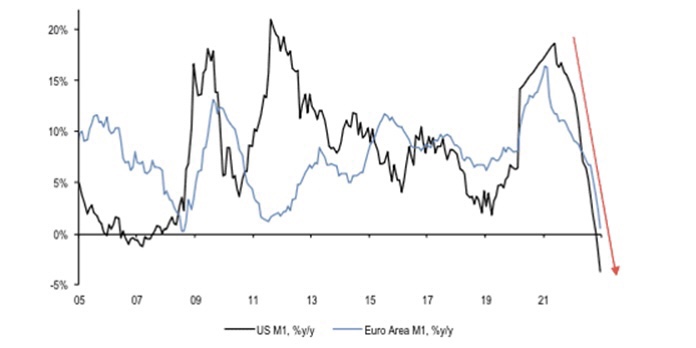
- Money supply in developed markets keeps decelerating.
- In the US it’s in correction territory, for the first time since 2006.
- h/t: Daily Shot.
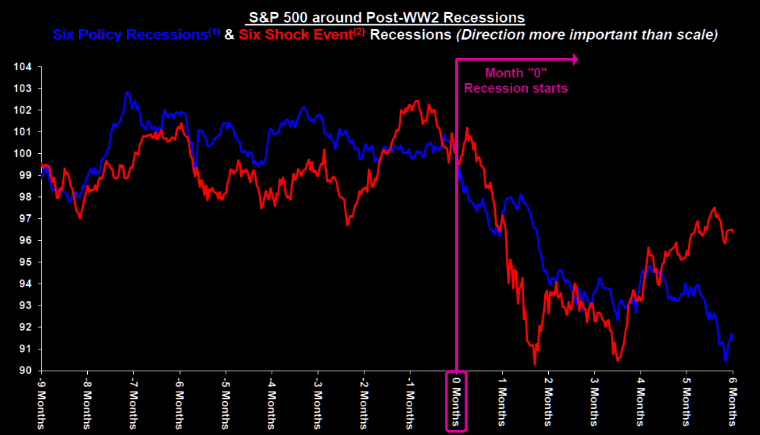
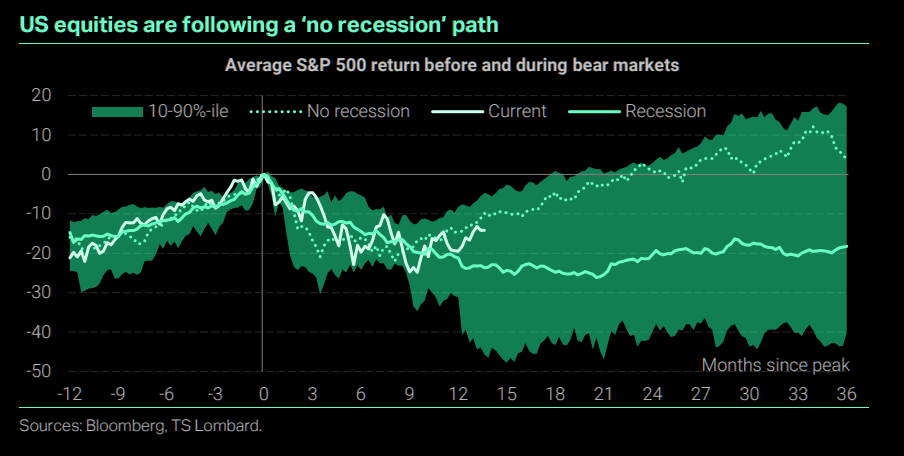
- Equities are following a no-recession path currently.
- If one does happen, things could look very different.
- Source: TS Lombard via themarketear.
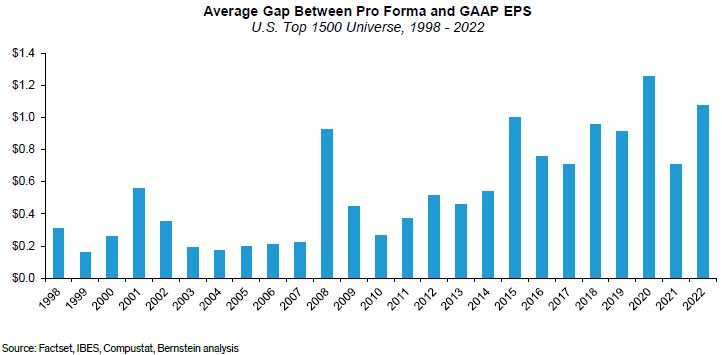
- The quality of reported earnings in the US has been deteriorating.
- Source: Bernstein.
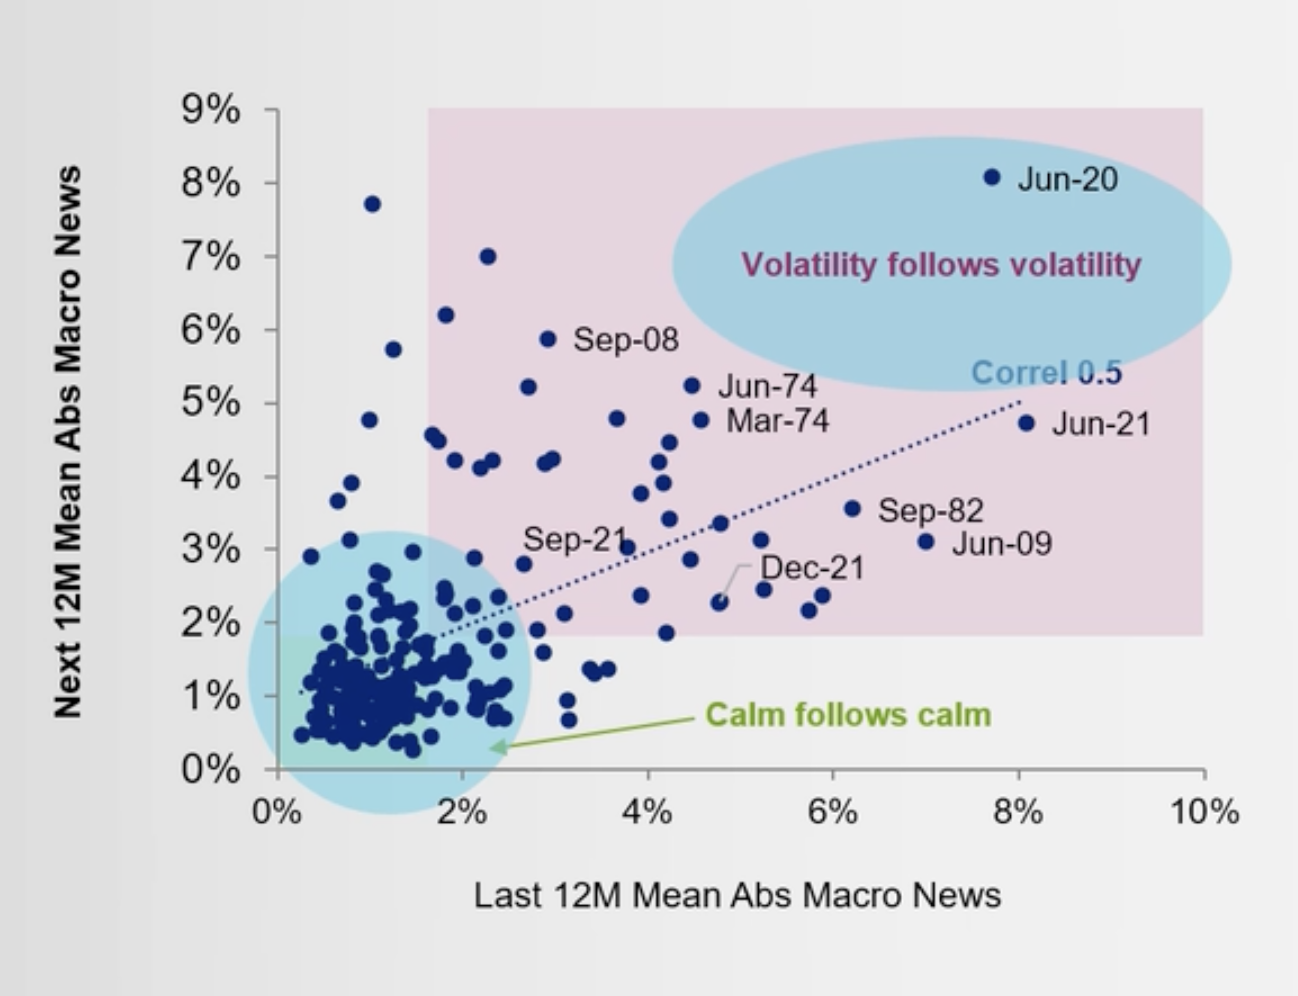
- Calm begets more calm, volatility begets more volatility.
- Source.
WordPress Cookie Notice by Real Cookie Banner