- Bids from private equity into Europe, and especially the UK, are on the rise with 2021 seeing a record year (almost rivalling 2006 in value terms).
- H/T 361 Capital.
Author: Snippet.Finance
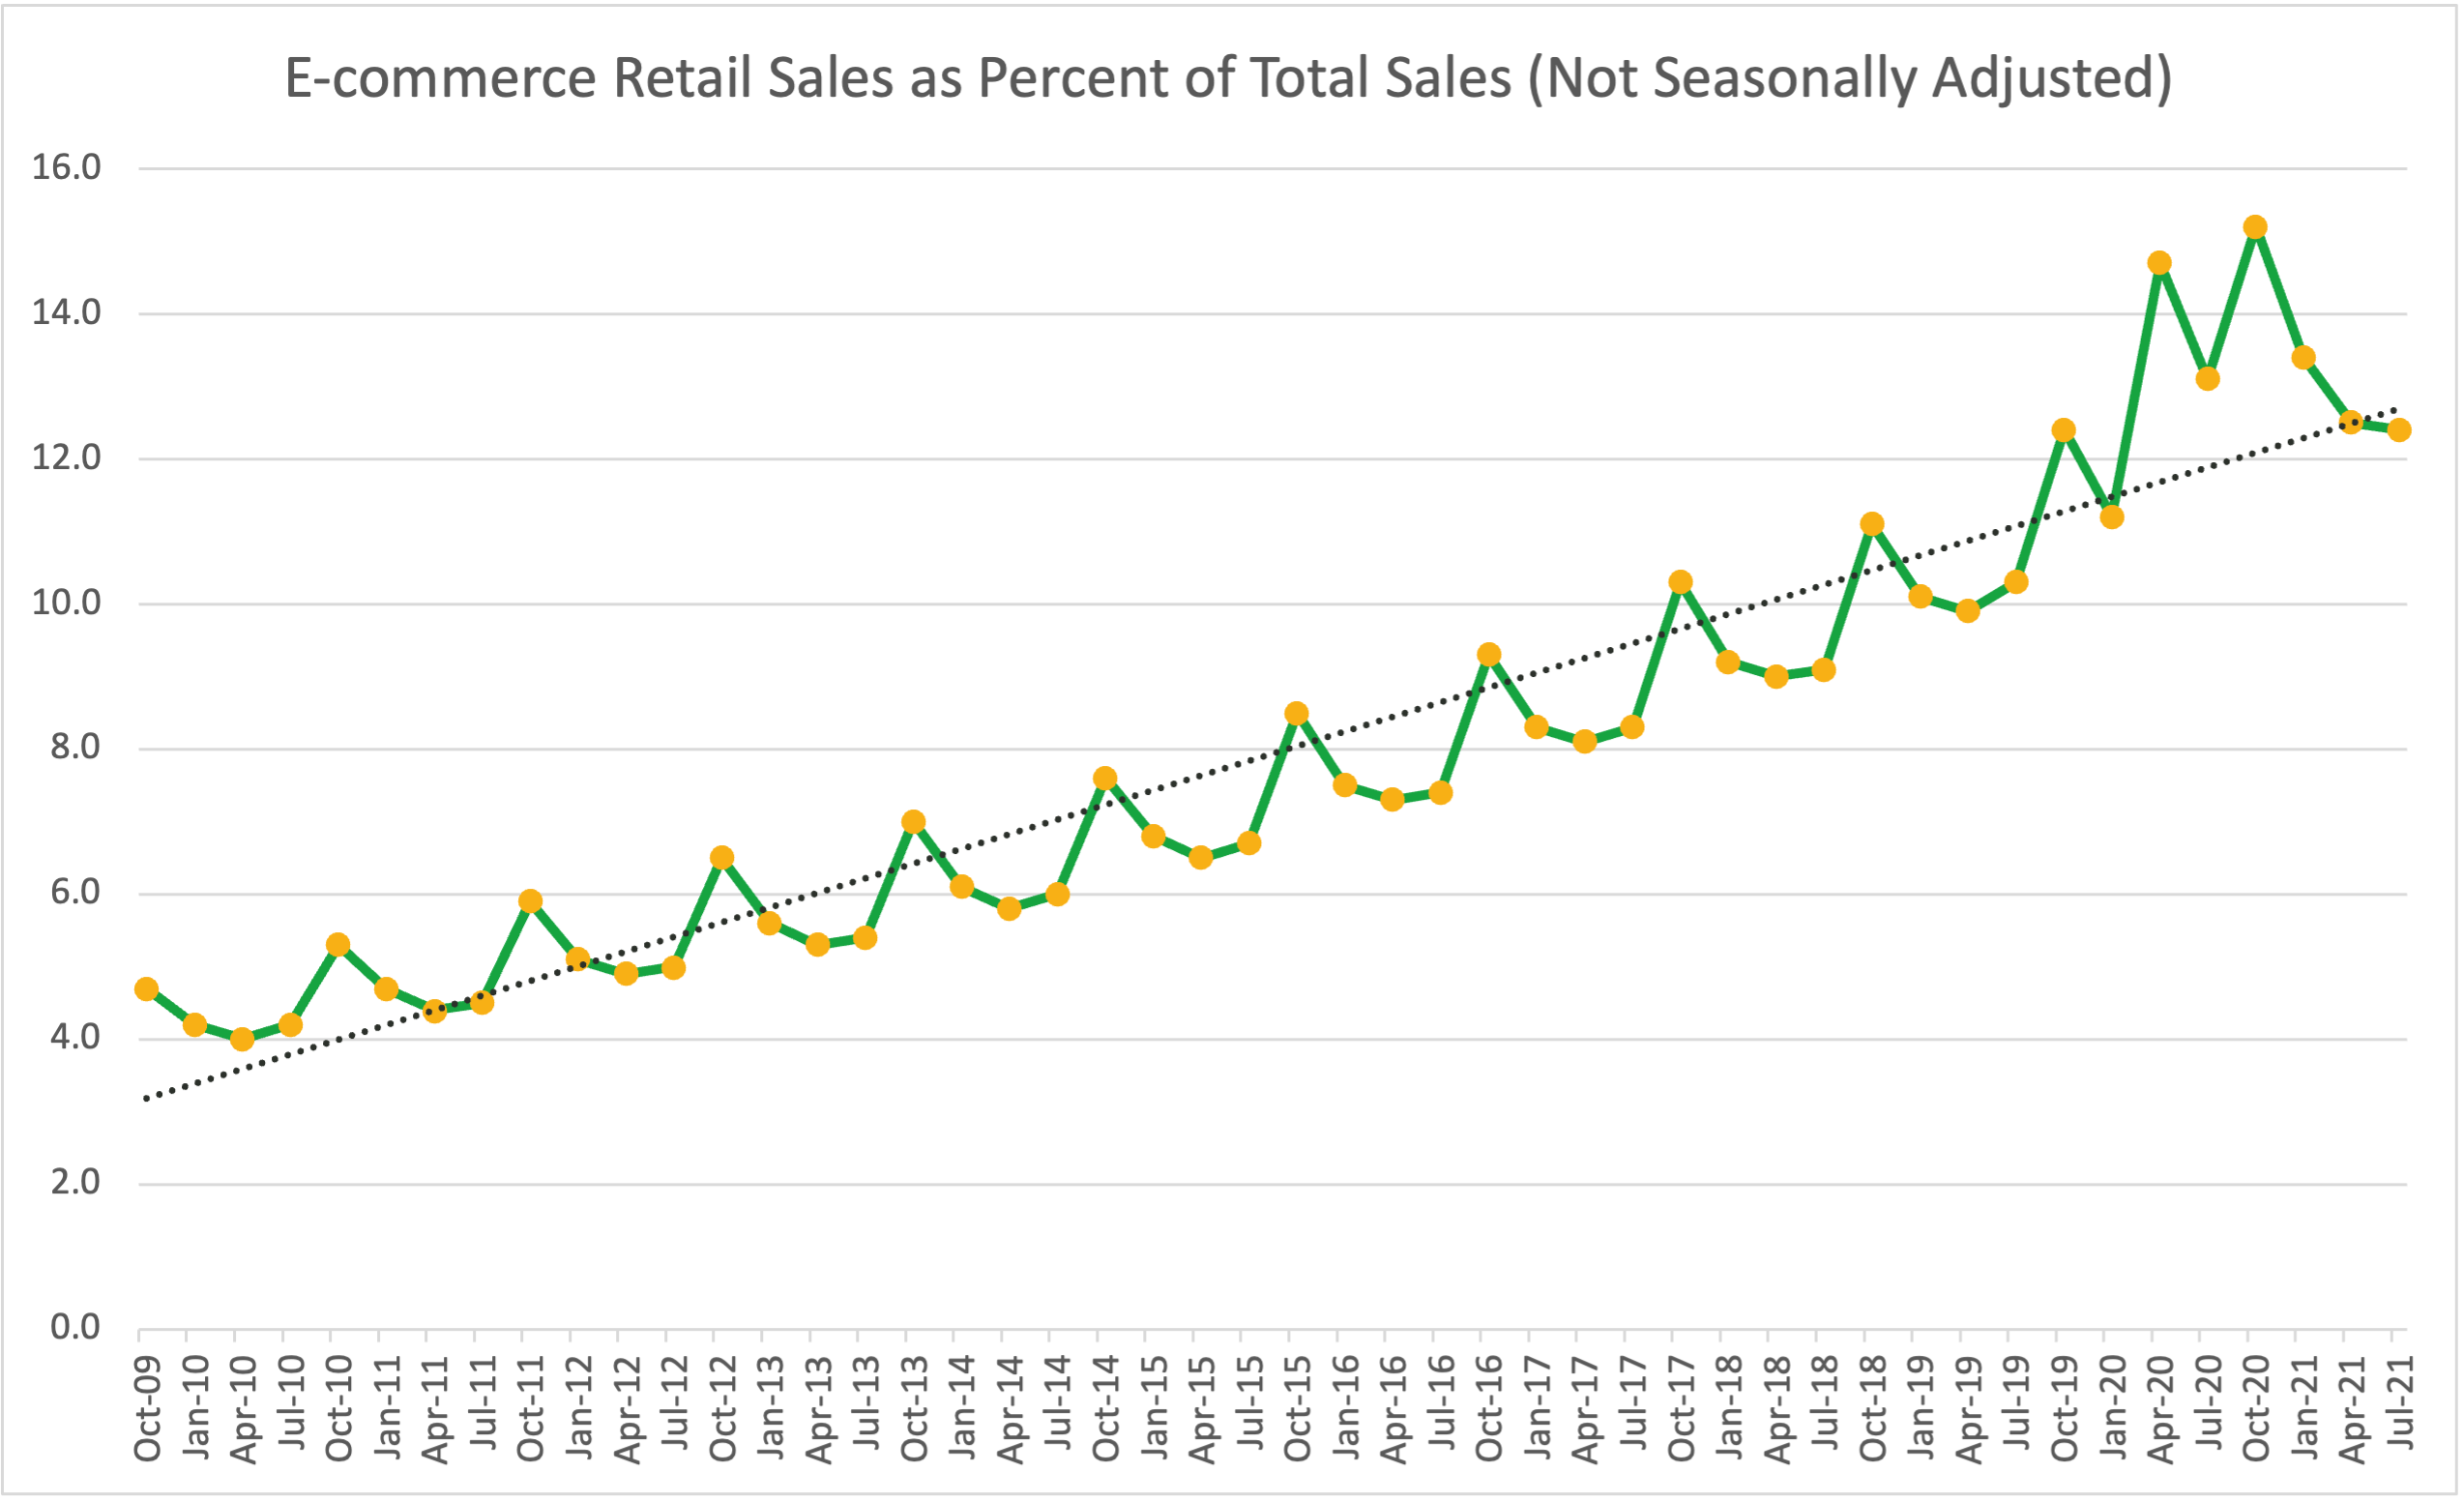
E-Commerce Sales Share
- Counter to the prevailing narrative – e-commerce hasn’t seen a step change and is almost exactly where a 10-year trend line would have predict it would be as a share of total retail in the US.
- The reason for this is that total retail sales has grown strongly (+13% vs. normally being +2-3%). In absolute terms, shoppers spent $204bn on e-commerce in Q3 2021 but the pre-pandemic trend would have predicted $183bn.
- h/t NZS Capital and Marketplace Pulse.
Dan Loeb
- A belated snippet of this outstanding profile of legendary investor Dan Loeb (I posted his letters several times) – founder of Third Point Capital, a $20bn hedge fund, that compounded over +15% pa for 25 years and pioneered activist investing.
- Third point is named after his favourite surf break in Malibu.
- In the early days of the fund – Loeb posted on forums as “Mr Pink”. Interesting to see further confirmation of media-first investors.
Newsletters
- There is a growing trend of financial newsletters being acquired.
- Abrdn (the newly renamed Aberdeen Asset Management) has acquired Finimize and their 1m subs (40,000 premium).
- Morning Brew went to Business Insider for $75m (ca. 3.8x sales or $25 per each of its 3m subs).
- Robinhood acquired MarketSnacks.
- Others are looking to deploy serious capital into financial media.
- Big media is also noticing (e.g. The Information launched a tech stack for newsletters).
Christmas Holiday Break
- Snippet Finance is taking a holiday break, returning on Monday 3rd of January 2022.
- For those of you that entered last year’s Christmas competition, the results will be tallied up and winner announced in the new year.
- Wishing everyone Happy Holidays.
52 Snippets from 2021
This year I did a bit more of my own writing. I also published nearly 400 Snippets. Here are 52 things I learned:
- Cornelius Vanderbilt, at one point, commanded one in every nine dollars in the United States. [Masters Invest]
- For the first time in 35 years, no oil flowed from Saudi Arabia to the United States, according to EIA data. [Oil Price.com]
- “Tsundoku (積ん読) is a beautiful Japanese word describing the habit of acquiring books but letting them pile up without reading them.” [Ness Labs]
- The population of vertebrate species has fallen 60% since 1970, despite (or because of) 97% rise in human population and 285% rise in GDP. [Snippet Finance]
- “Often, the screams we hear in movies and TV are created by doubles and voice actors. One stock scream is so well-used it’s got a name, the Wilhelm. It’s in hundreds of films.“ [NYT]
- Norwegian pop sensation A-ha is responsible for the country’s lead in electric vehicles. [Reasontobecheerful]
- Commercial rocket development (think Space X) has reduced the cost of a typical space launch by a factor of 20x while NASA’s launch cost to ISS has declined by a factor of 4. [Conference on Environmental Systems]
- The number of Italian lira (then Euros) that could be bought with one US dollar is 280 times more now than in 1900. [Credit Suisse]
- “The Uber map is a psychological moonshot because it does not reduce the waiting time for a taxi but simply makes waiting 90 per cent less frustrating.“ [Collaborative Fund]
- 63% of respondents on the property site Redfin said they made an offer on a home without seeing it. [Snippet Finance]
- Going to the movies is the second most popular out-of-home experience in the US. Seven times more movie tickets are sold than every sports event in the United States in 2019. [The Transcript]
- The UK lost 11,000 stores from its retail landscape in 2020. [Drapers]
- The city of Kyoto in Japan has kept records of the peak bloom date of their famous cherry blossom trees since 812 AD. 26th March 2021 peak bloom date was the earliest peak bloom date ever recorded, surpassing the previous record of 27th March 1409 (a century before Columbus sailed for America).[Washington Post]
- “Since 1980, more than 40% of all companies in the U.S. stock market have experienced a decline of 70% or worse without recovering.“ [JPM Asset Management]
- Nearly everything you see on an Amazon or Ebay page is an ad. [Market Place Pulse]
- Singles’ day sales in China dwarfs all US holiday retail events combined. [JP Morgan]
- Last year Korea’s Asiana Airlines operated 75 flights to nowhere. These flights, that physically go nowhere, allowed 8,000 passengers to shop duty free, spending on average $1,450 per flight. [Moodie Davitt]
- In 1996 just 0.2% of Starbucks stores were outside of North America. Today it is 48.2%. [Snippet Finance]
- As the world shifts to renewable energy it becomes very dependent on a handful of countries for crucial minerals. The Democratic Republic of Congo controls nearly 75% of the world’s cobalt. [IEA]
- Yemen, Serbia and Montenegro come second, third and fourth in the list of top countries by firearms per 1,000 people. [Vox]
- Hershey have started to put a “add a Hershey” to online checkouts in an effort to reignite impulse buying online. [Wired]
- If you can return 20% per year for 50 years you will 9,100 times your money. [Snippet Finance]
- In 1976 George Lucas asked for just $150,000 to direct Star Wars (he could have commanded $1m+) and instead asked for all the merchandise rights. Fox executives, hot off the 1967 write down of Dr Dolittle toys, accepted. Lucas went on to make $45bn from these rights. [Real Vision]
- A bottomless soup bowl was found to lead to 73% more consumption of soup. This psychological trick is programmed into every social medial feed – infinite scrolling. [Marie Dolle]
- L’Oréal makes its own TV shows. [The Drum]
- 80% of users in India only have a mobile phone to access the internet. [Ofcom]
- Even a low-end car now has 100 electronic control units and over 100 million lines of code. [IEEE Spectrum]
- A firm that almost went bust now handles 36% of Poland’s e-commerce volume. [Forbes]
- In 2006 Stripe co-founder Patrick matriculated to MIT with an SAT score he got at the age of 13 after doing the last 2 years of high school in 20 days. [The Generalist]
- The United States is blessed with the world’s largest (one million square miles) contiguous piece of extremely well-irrigated farmland – the Mississippi basin. [Thomas Pueyo]
- China’s anti-monopoly laws were first passed in 2007, a century after the US, and almost a decade after all the major tech firms were founded. [Lillian Li]
- The jury is in – it costs 40% less to maintain an electric vehicle when compared to an internal combustion engine. [Energy.gov]
- George Lucas was forced to sell Pixar to fund his divorce. 35 Venture capitalists and 8 strategic partners turned them down for funding. Disney, who eventually paid $7bn for the firm, could have had them for free in the 1970s. The reason for Pixar’s eventual success = Steve Jobs. [IEEE Spectrum]
- 34% of US companies rely on paper checks for the majority of their payments. [SSRN]
- In 2019, Tiger Global wasn’t even in the Top 15 European venture investors, In 2021 it was number 1. [Lazard]
- Americans rank themselves (or their partner) as the second best source of financial advice. Financial professionals in the media come dead last. [RIA Intel]
- “Forty million acres of land in the US consists of lawns. Maintaining them requires 800 million gallons of mower fuel and three million tonnes of (carcinogenic, endocrine-disrupting) fertilisers a year, and they guzzle up to 60 per cent of fresh water in urban areas.“ [LRB]
- Gitlab publishes its entire employee handbook (13,804 pages) online for everyone to see. [Git Lab]
- Since Xi Jinping took power, air pollution in Beijing is down 60%. [Snippet Finance]
- Companies that use simple language on earnings calls substantially outperform those that use complex language, irrespective of length of these calls. [Snippet Finance]
- If you took 1/3 of all the volume of the entire biopharmaceutical industry today you could only produce 22 million pounds of lab-grown meat – 0.02% of US annual meat production. To get even 10% would require 4,000 bio-reactors and cost $1.8 trillion dollars. [The Counter]
- 2020 probably saw net migration from the EU into UK go negative for the first time. [Snippet Finance]
- Famous mathematicians including Paul Erdos all argued that Marilyn vos Savant, who held the moniker world’s smartest woman, was wrong about the Monty Hall Game show problem. She was right. Try solve the problem yourself first. [Behvioral Scientist].
- The owner of the most onshore oil and gas wells in America is not Exxon Mobil. In fact its a firm you have never heard of. [Bloomberg]
- Wang Huning, a man you have likely never heard of, is arguably the single most influential “public intellectual” alive today. [Palladium Mag]
- To earn $1,000 per month one needs to have at least 100,000 followers on Instagram, but only 230 subscribers on Substack. [Creator Manifesto]
- Geneticist George Church finished his undergraduate degree in 2 years and then worked 100 hour weeks in the lab during grad school, famously getting kicked out due to not attending classes because he was so absorbed in his research. [Stephen Malina]
- The number of people employed in UK local government is the lowest level since 1963. In contrast central government employment has never been higher. [Snippet Finance]
- Honus Wagner, although a baseball star during his time, was also a very shrewd operator, restricting images of himself. The result is that his baseball cards are so rare – a few dozen are known to exist – they recently sold at auction for $6.6 million. [ESPN]
- A fully electric Volvo XC40 in a world where all electricity was renewable would still need to drive 49,000 kms to breakeven in CO2 terms with the petrol version. [Volvo]
- Peter Thiel, the silicon valley legend, actually tried to convince Mark Zuckerberg to sell Facebook for $1bn to Yahoo. [LRB]
- Walt Disney World’s land parcel is so enormous that it’s a kind of self-governing municipality with its own fire department and emergency services. It is governed by a five-person board elected by the landowners. As a result, high-level Disney employees essentially run the entire region. [Visual Cap]
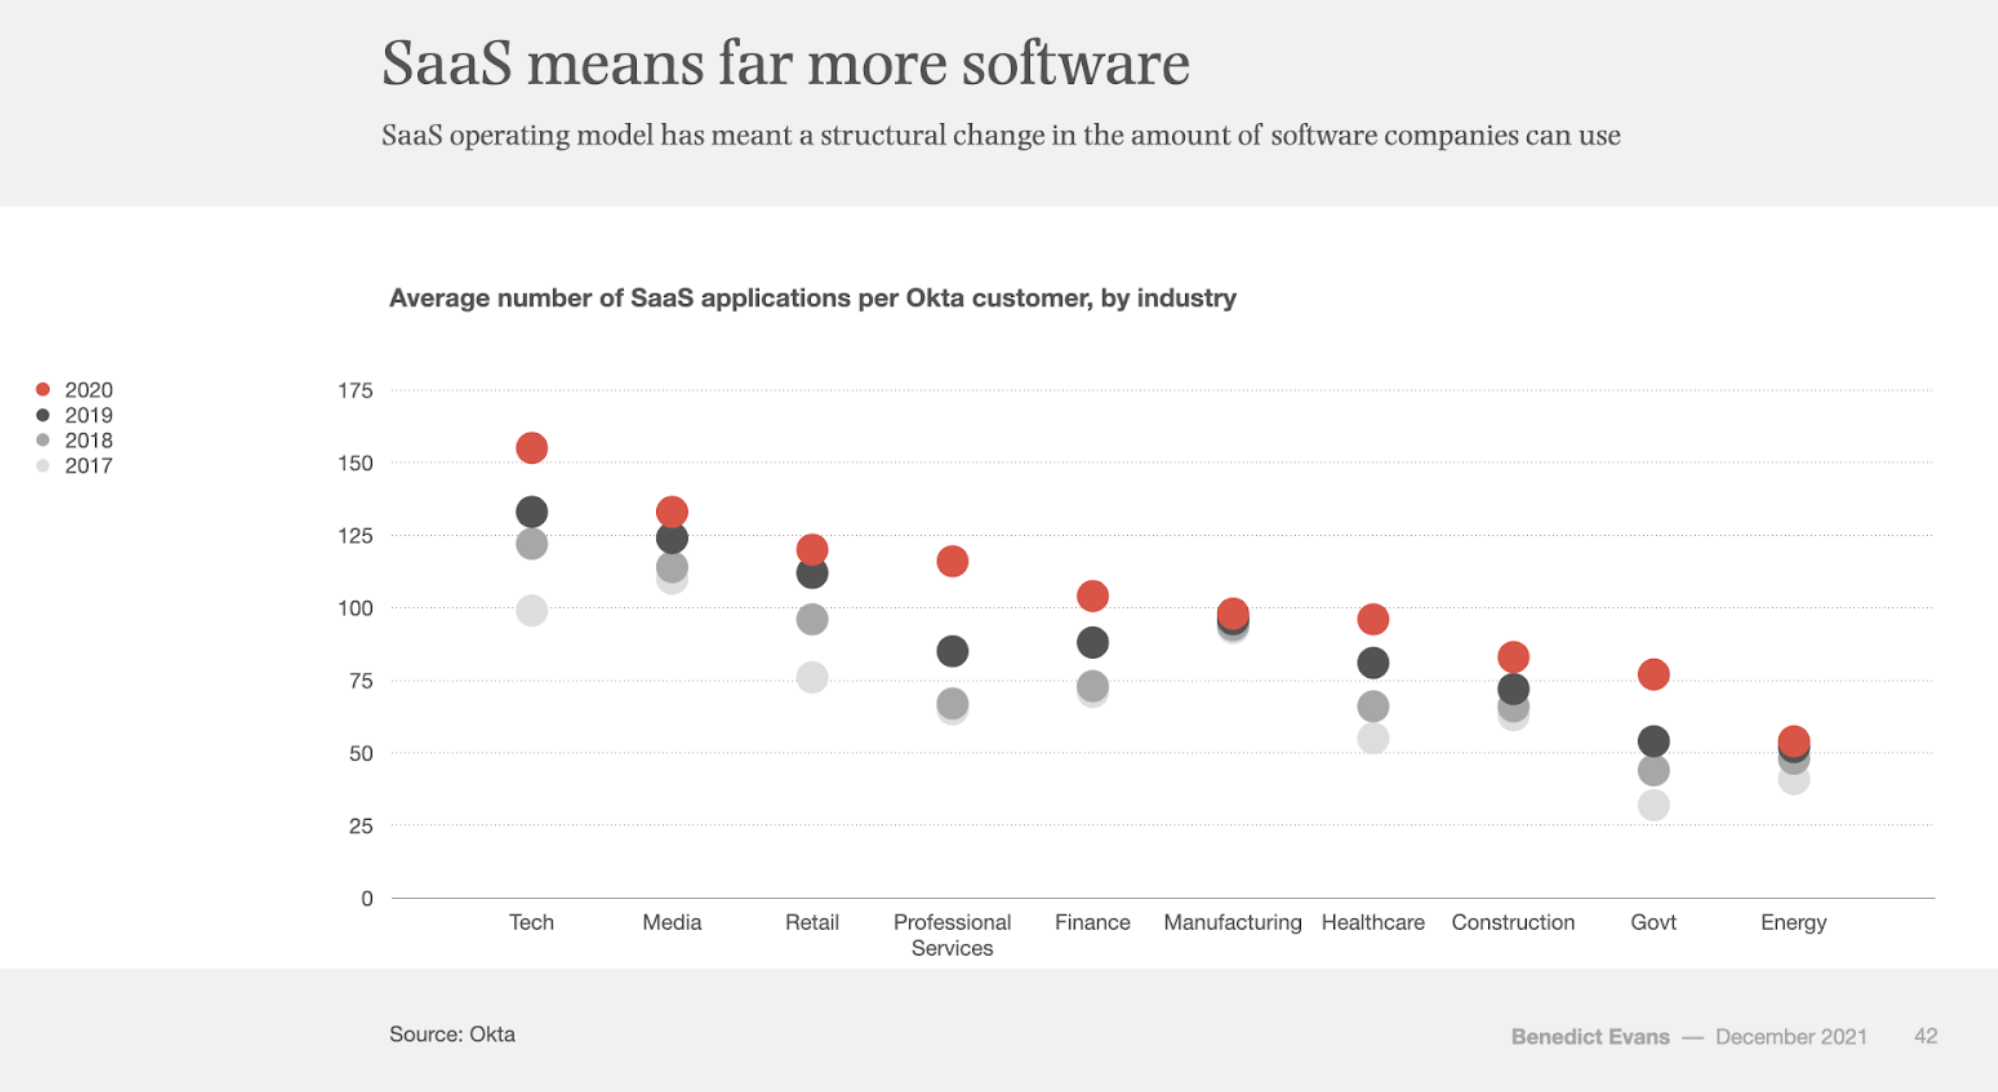
SaaS Unlocks Software Use
- Latest annual presentation is out from Benedict Evans.
- Absolutely worth a look as it nicely covers macro and strategic trends from the tech industry.
- This chart shows how software as a service (SaaS) has pushed up the amount of software companies can use (as there is no need to get IT to install/support/configure new applications).
- The move to cloud delivery for software has miles to go (it is just 10-15% of enterprise IT spend and 20-30% of workloads).
France
- “France is a monarchy that undergoes a succession crisis every five years, by way of an election.“
- Simply fascinating read on the structure of French politics – namely the importance of the presidential seat of power.
- This is all down to de Gaulle and his dislike of parliamentary democracy.
- Through a referendum in 1962 he effectively destroyed the legislative branch.
- “In France the President truly is the Roi-Soleil, the Sun-King, just by virtue of what you may call political gravity. There is a reason why the often petulant Macron calls himself Jupiter. It rings somewhat ridiculous and orotund. It also happens to be correct.“
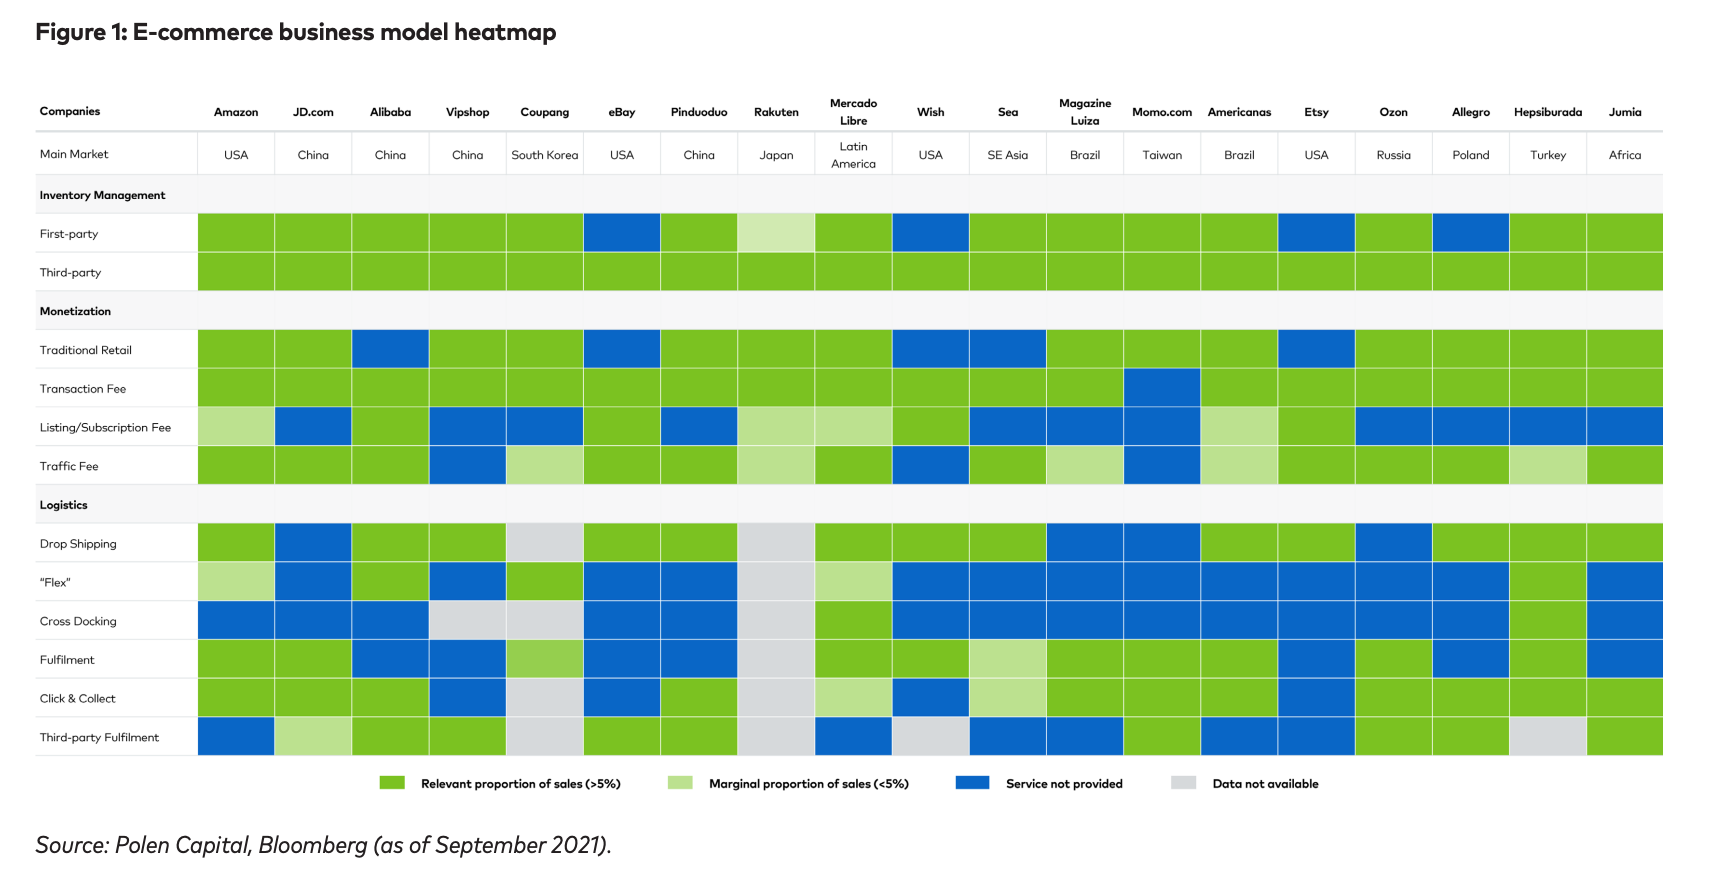
E-commerce Heat Map
- Nice heat map of the various business models employed by the world’s largest e-commerce companies.
- Source.
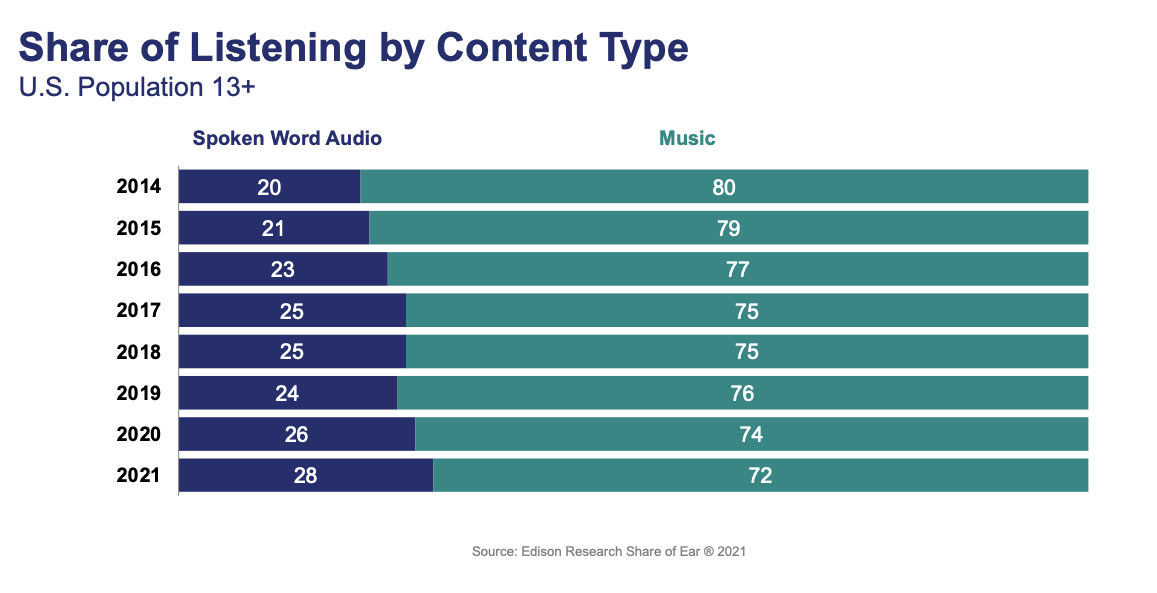
Spoken Word
- Spoken word audio (think podcasts, audiobooks etc) is taking share of listening away from music.
- 22m more people in the US are listening to spoken word than seven years ago.
- The biggest growth driver has been podcasts – which represent 22% of spoken word, up from 8% in 2014.
- Lots more stats in this NPR/Edison Research report.
Climate Fund Flows
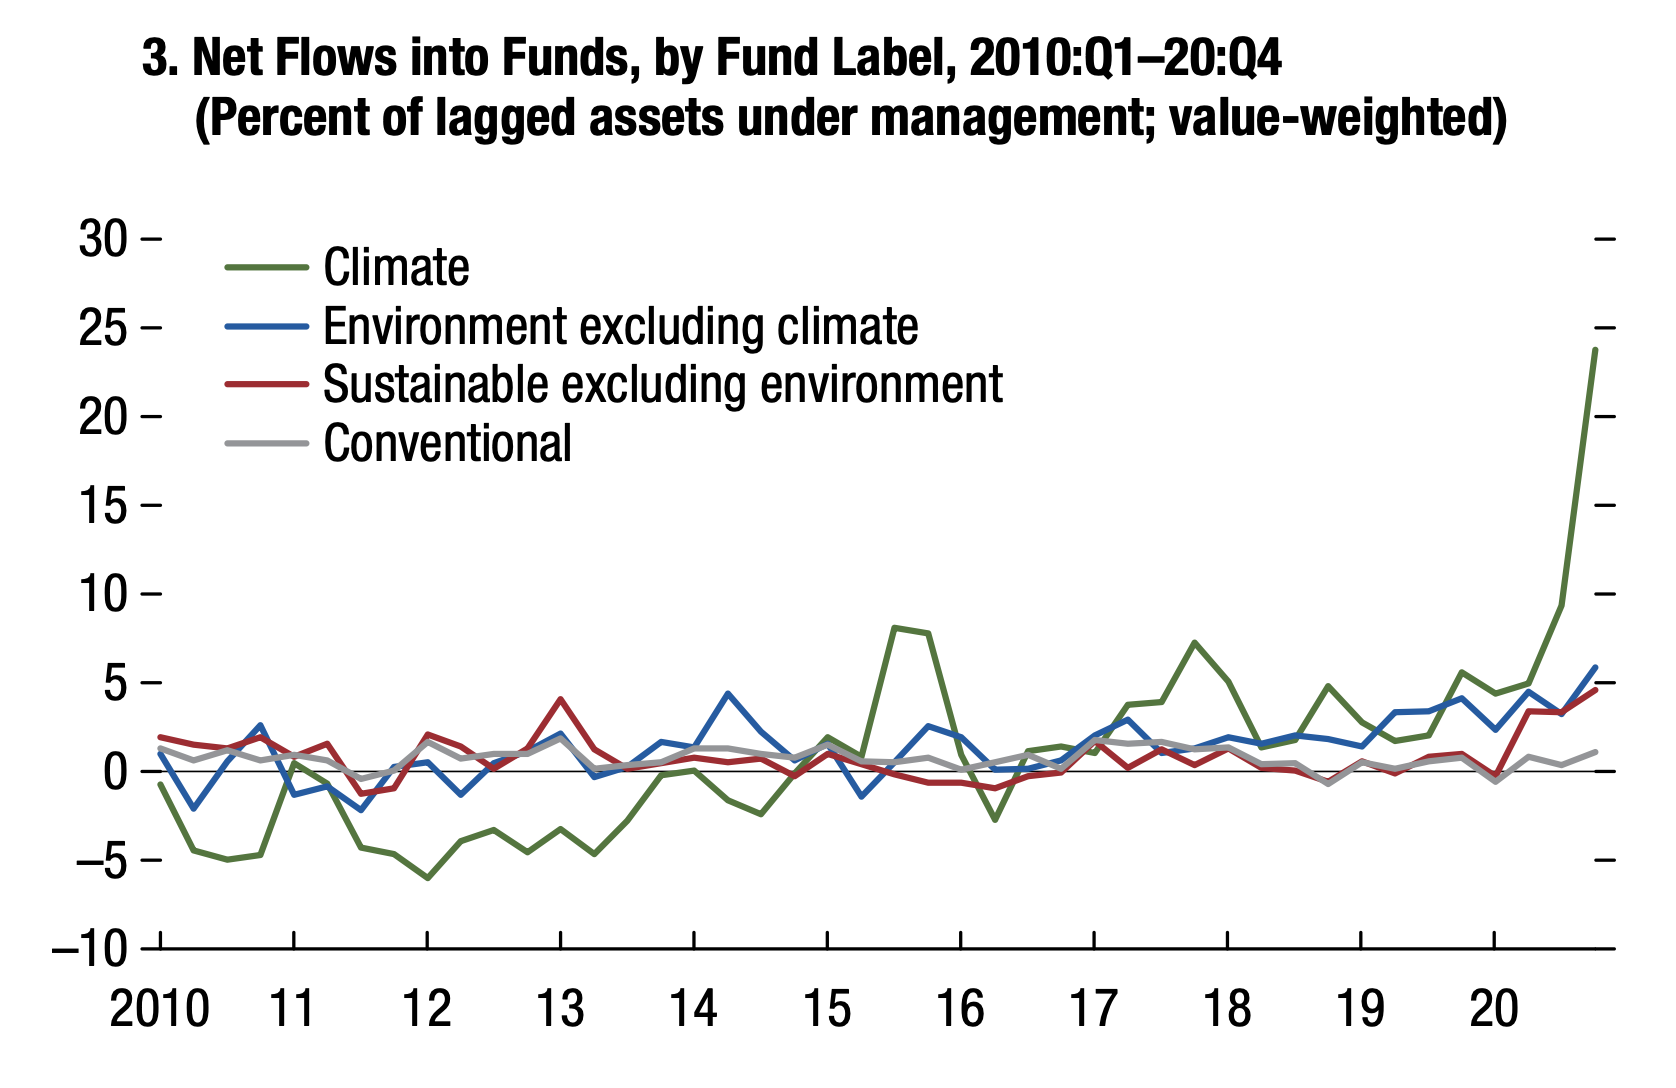
- Flows into sustainable funds started to break away from conventional funds only in the last few years.
- 2020 changed this with a substantial acceleration of flows, especially into climate funds.
- Source: IMF.
Share Snippet Finance
- Snippet Finance launched just over two years ago.
- The problem: Investors’ voracious appetite for insights on a limited time budget.
- The mission: Use my experience as an investor to curate the most interesting snippets of information and deliver them in a short easy to digest way.
- I think I’d curate snippet even if no one read it, and use it as a sort of living notebook. However, I am so grateful for so many of you for subscribing and for all your feedback.
- I NEED YOUR HELP: Please forward Snippet Finance to anyone you think will find these nuggets valuable. This is the best way to help support the site.
- Thank you!
52 Things I learned – 2021 edition.
- We previously covered this brilliant list of 52 things learnt for 2018, 2019 and 2020.
- Here is the 2021 edition – full of gems. A few choice examples:
- “Social media headlines are evolving fast. Since 2017, they’ve got shorter (11 words vs 15 words), and many clickbait phrases like “…will make you…” or “things only … will understand” no longer work.” [BuzzSumo].
- “Adding nature imagery (grass, trees, rainbows) to a pitch document seems to increase the likelihood of investment a little.”
- “Baileys Irish Cream was invented in 45 minutes in 1973 by two ad creatives in Soho.“
COBOL
- COBOL is the programming language that underpins the entire financial system.
- “Over 80% of in-person transactions at U.S. financial institutions use COBOL. Fully 95% of the time you swipe your bank card, there’s COBOL running somewhere in the background.“
- “The second most valuable asset in the United States — after oil — is the 240 billion lines of COBOL”
- The language is old (from the 1960s) and runs on huge machines (mainframes), yet it is extremely suited to the task of processing billions of transactions very fast.
- A fascinating read.
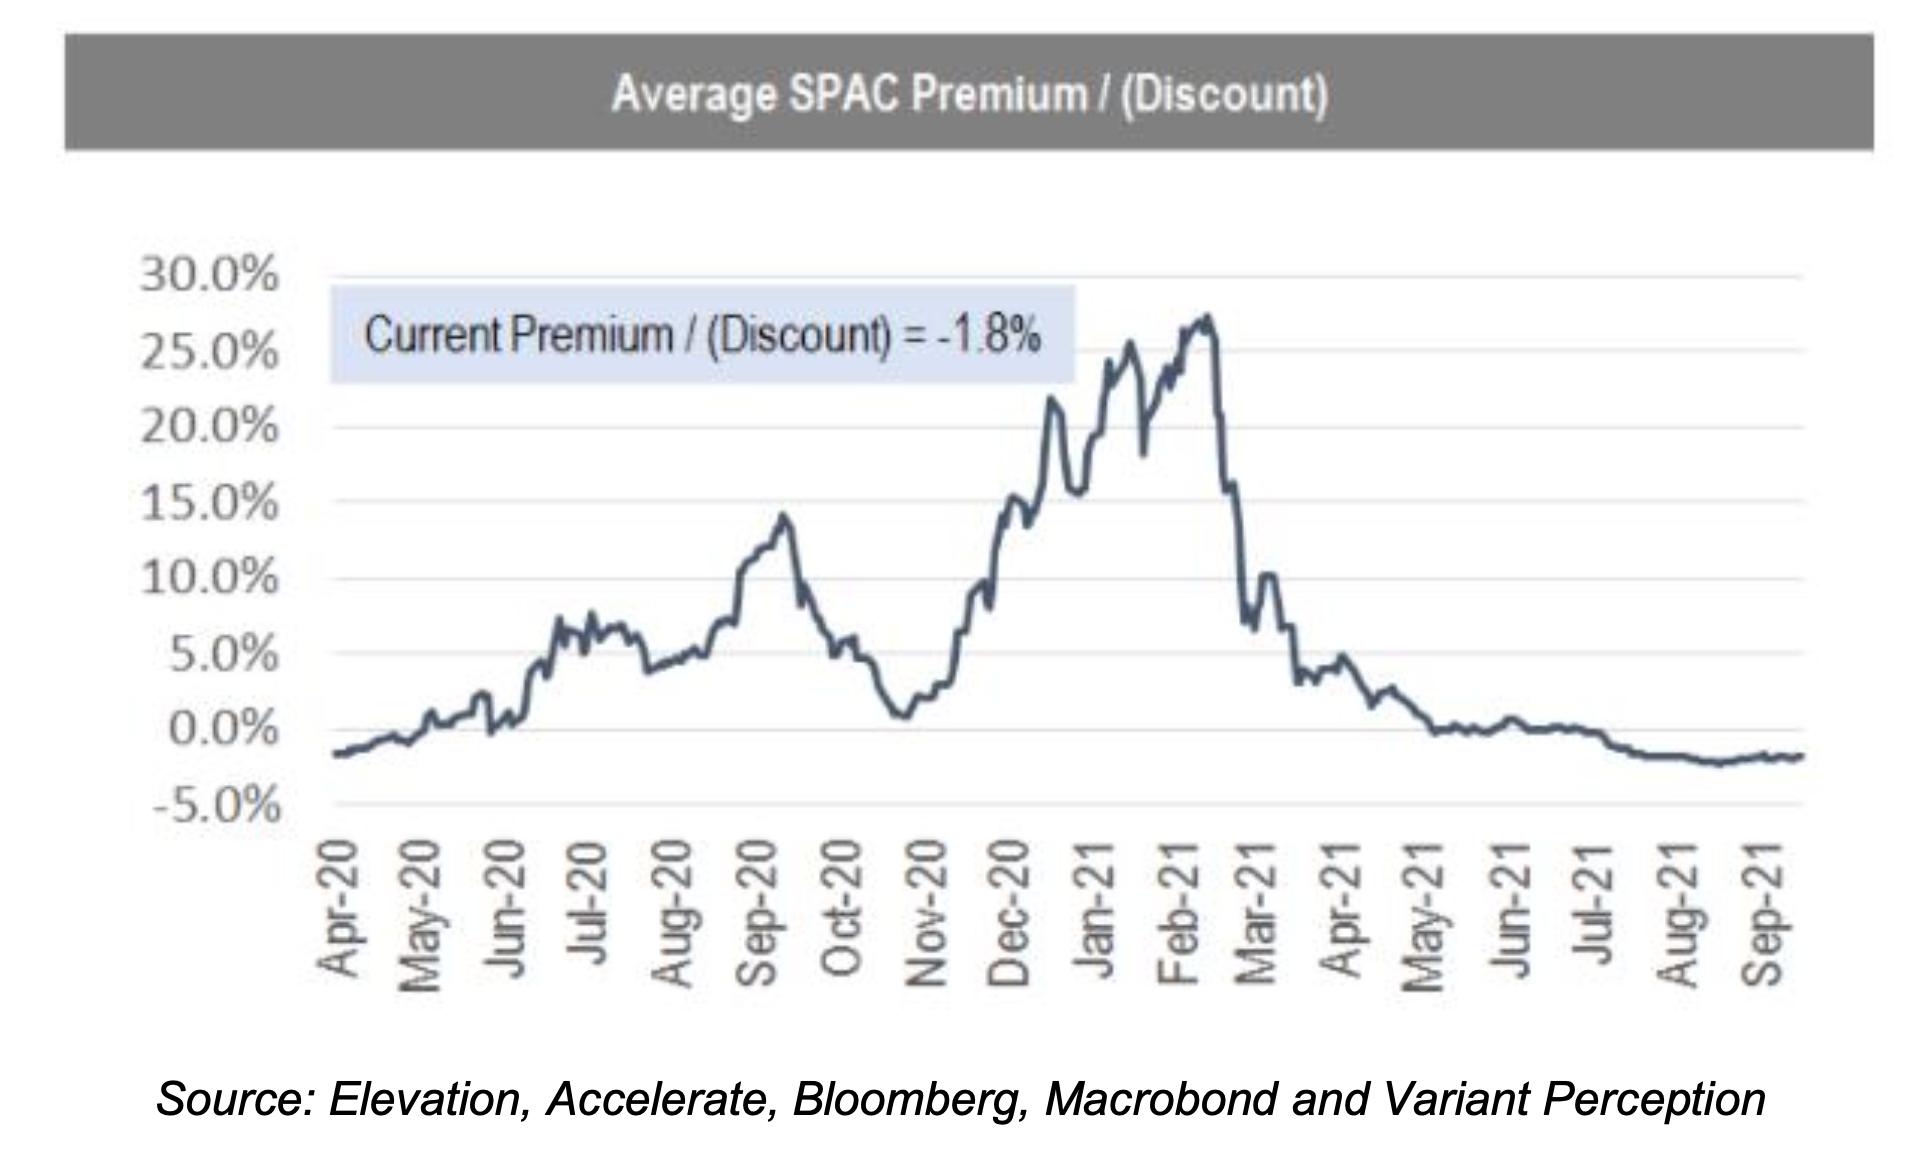
SPACs Pt 2
- Time to look at SPACs?
- Source: Variant Perception.
Fintech Lending
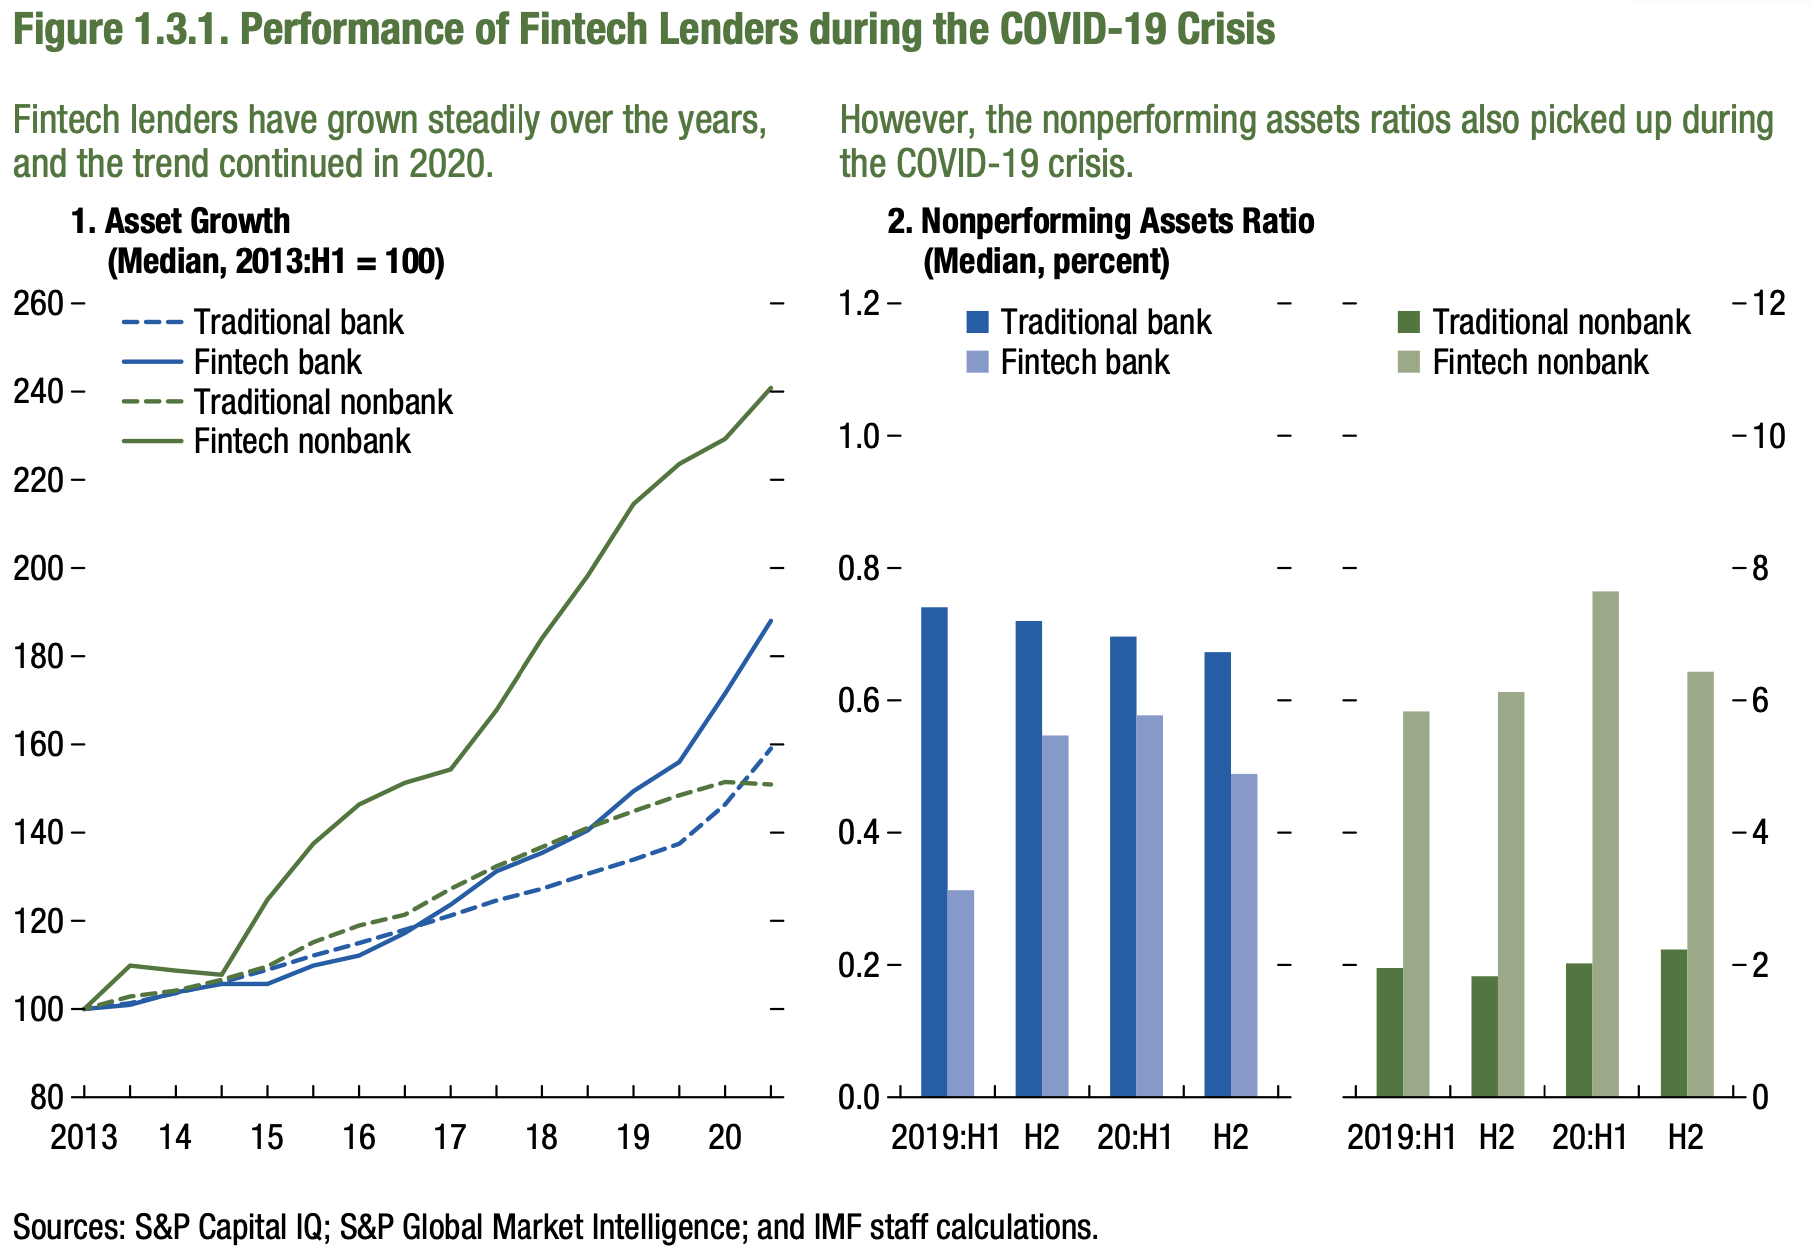
- Interesting study by IMF on fintech’s experience during the Covid crisis.
- The chart shows continued strong growth through 2020 by fintech lenders, outpacing traditional institutions.
- But also a pronounced increase in non-performing assets, something traditional lenders did not see.
- This work is based on data from 20 economies and is part of the IMF Global Financial Stability Report.
SUVs
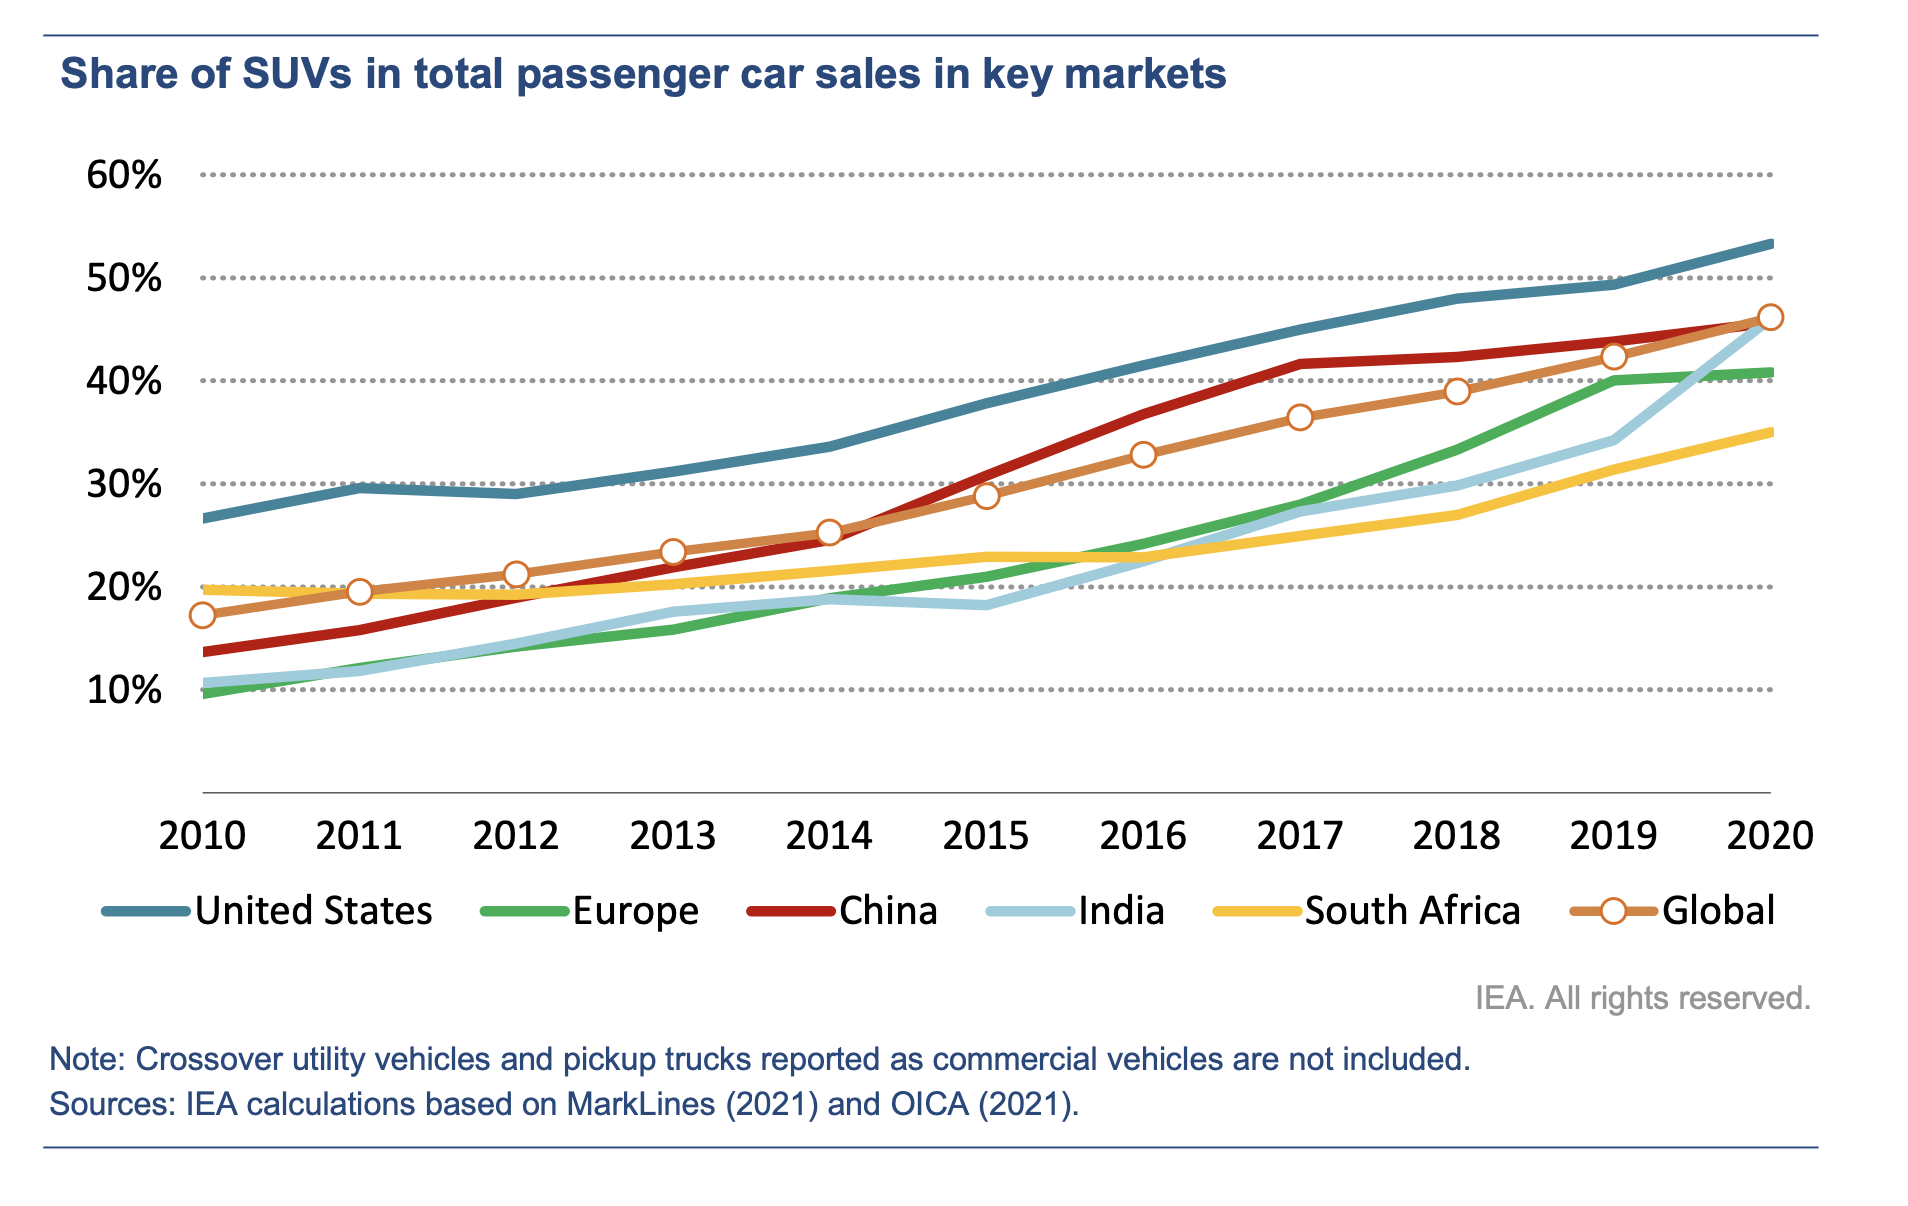
- The popularity of SUVs continues unabated.
- This is despite 20% higher fuel cost (which has improved due to increased mix of electric SUVs and improving fuel economy).
Factors
- Since its inception financial research has been on the hunt for factors that can consistently generate positive returns. Most famously Fama and French’s value factor.
- This search has led to a what one author has termed the “factor zoo” – a proliferation of factors – a direct consequence of data mining.
- There is also a replication crisis – that factors are not internally (i.e. the results can’t be replicated within the original sample) and externally (i.e. results can’t be replicated out of sample) valid.
- This paper (summary here) is a rebuttal of these issue – it uses Bayesian updating from a prior that a factor’s usefulness is zero. Their work finds that no crisis exists.
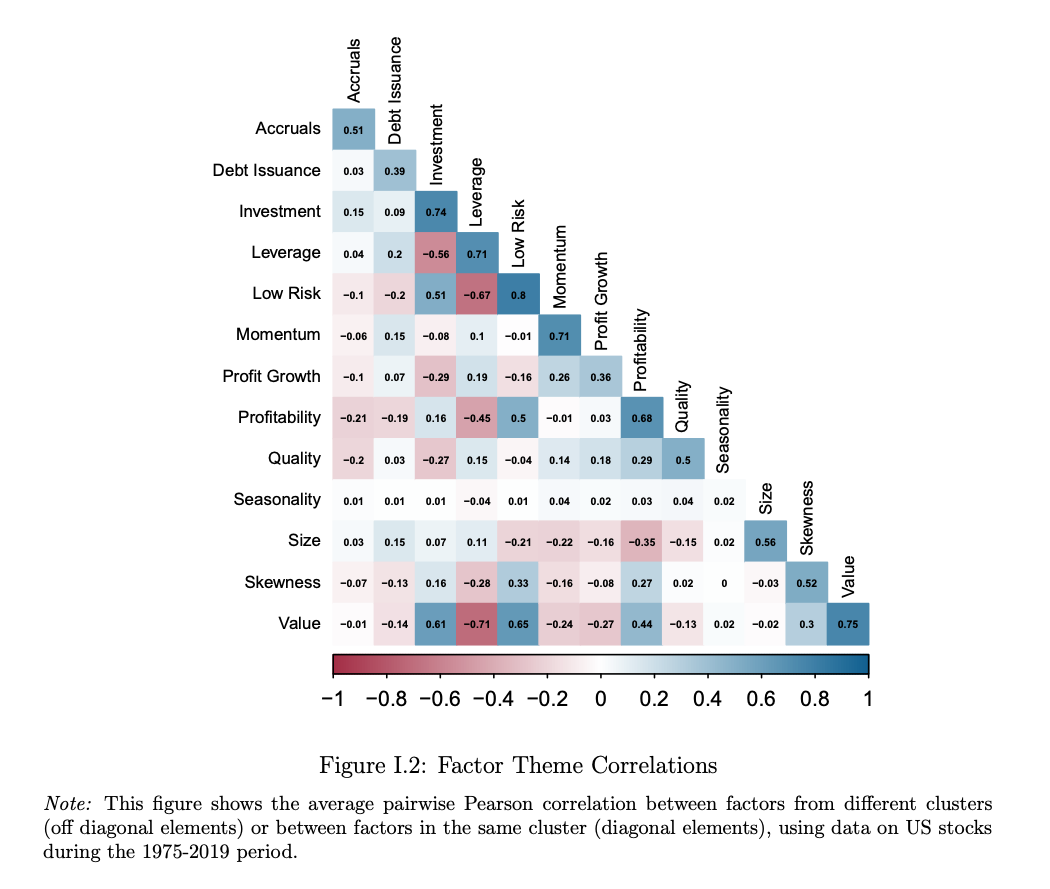
- One idea worth thinking about is that according to the authors the 153 factors explored actually cluster into 13 themes – “possessing a high degree of within-theme return correlation and economic concept similarity, and low across-theme correlation” (as seen in the chart).
- h/t AQR Research.
UNPRI
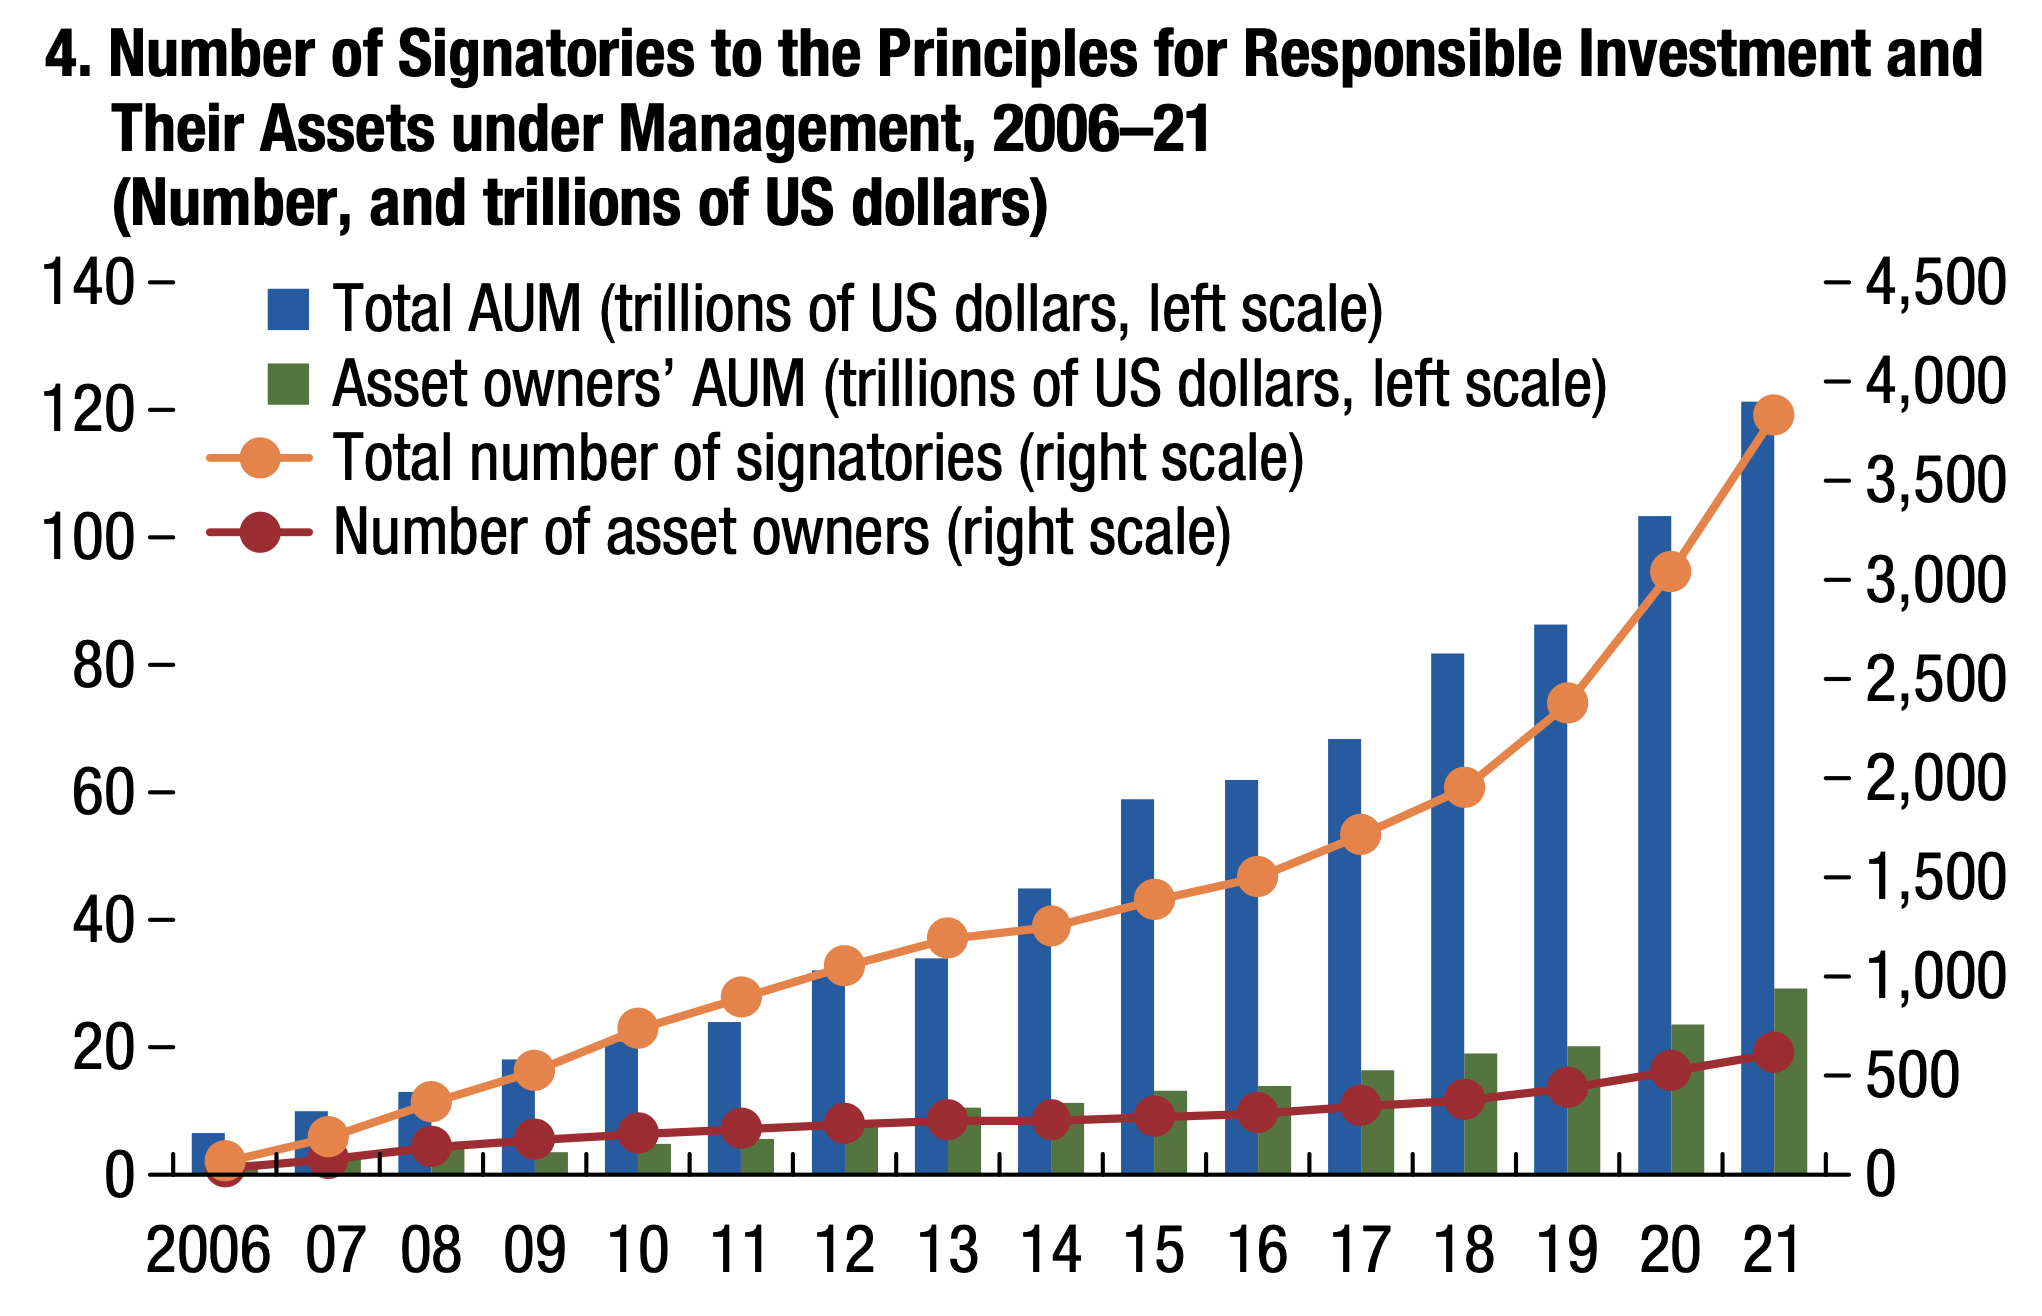
- “The number of asset managers and asset owners that are signatories to the Principles for Responsible Investment – thereby committing to incorporate environmental, social, and governance considerations into investment analysis and decision-making processes – more than doubled from about 1,400 in 2015 to more than 3,000 in 2020“
- Source: IMF.
Video Game Developers
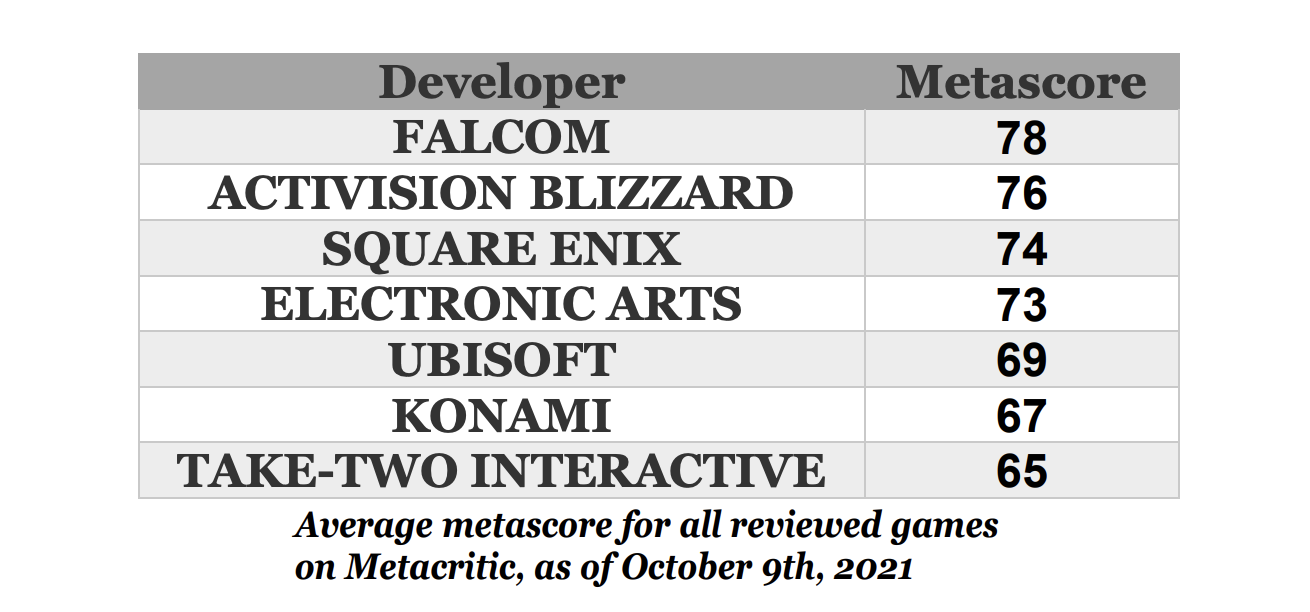
- Bet you haven’t heard of the top games developer by average Metacritic score for all reviewed games.
- Source (further reading inside).


