- UK’s Inheritance Tax (IHT) system seems broken.
- The effective rate looks very different to other countries and raises less than it should.
- In addition, take this chart from HMRC’s (UK tax authority) analysis of 2016/17.
- It shows estate values on the x-axis and the effective tax rate on the y-axis.
- Notice the huge drop off for large estates (£9m+).
- It turns out the IHT is only progressive for mid/upper-mid classes.
- There are plenty of reasons why this is (listed in the article).
- IHT is “a tax with a terrible combination of a high rate (which makes it unpopular and drives avoidance) and poorly targeted/overly-generous exemptions (which then enable avoidance).“
Macroeconomics
Snippets on the big picture.
Re-shoring
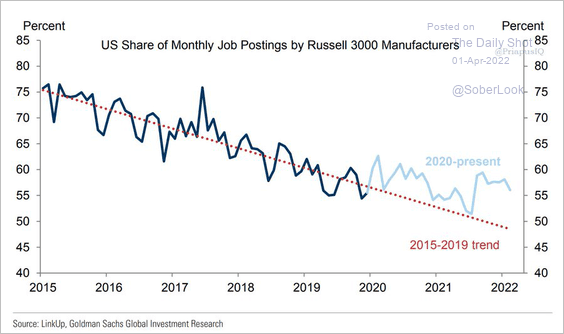
- Data showing a break in the long term trend of declining US manufacturing jobs.
- Source: Daily Shot.
Inflation Inequality
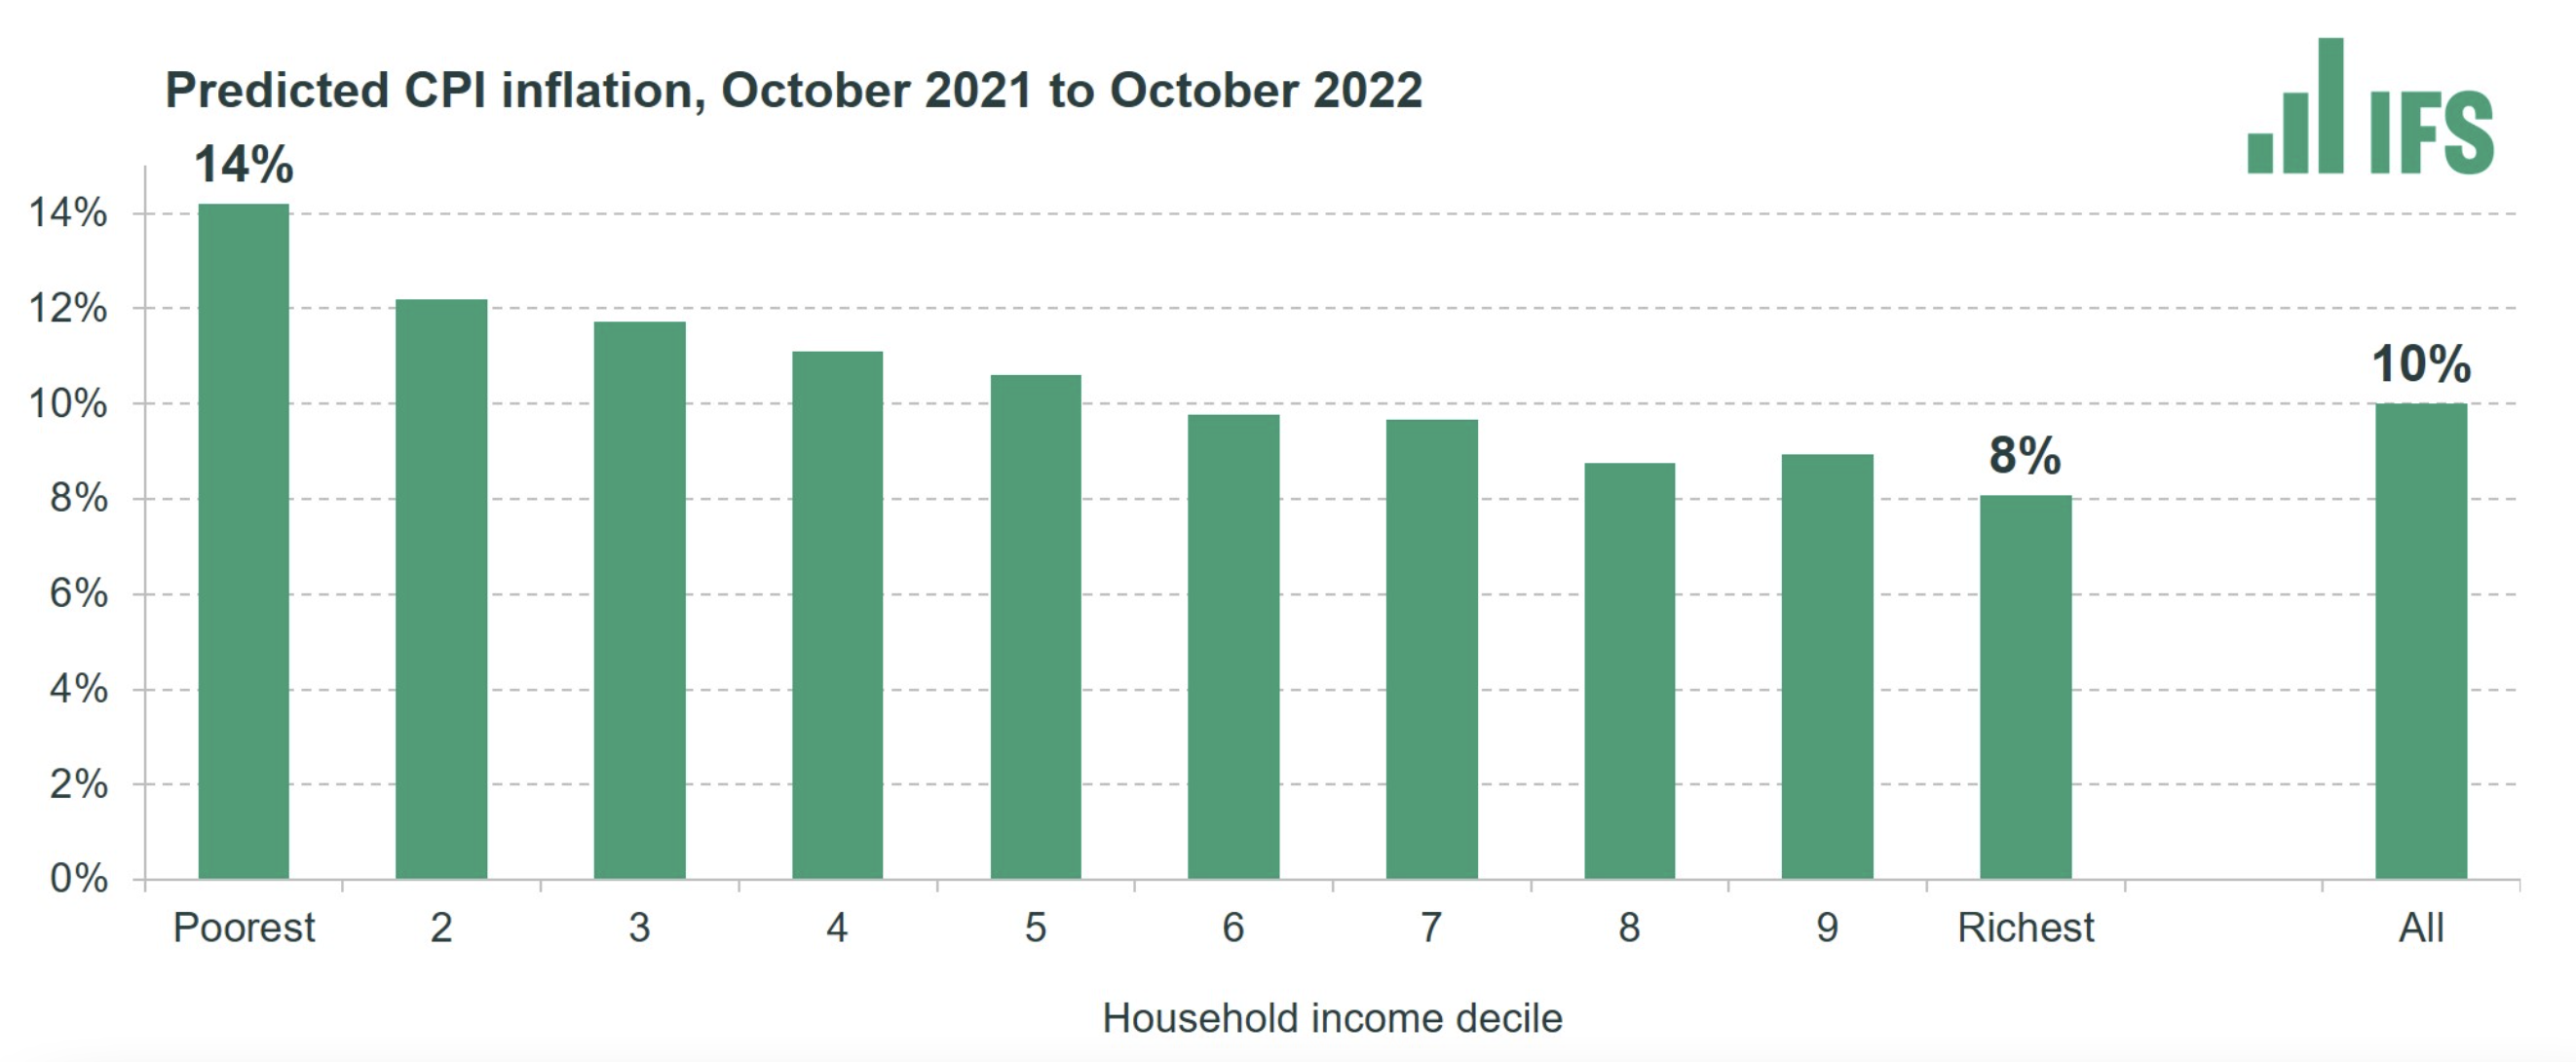
- UK latest (April) headline inflation came in at 9%.
- Until April inflation was hitting all households the same.
- April was different, as Ofgem raised the energy price cap by 54%, leading to a 70% YoY increase in gas/electricity costs.
- As poorer households spend more of their budget on energy, inflation is starting to tilt towards hitting them harder.
- Ofgem is communicating a further rise of £800 for the price tariff cap in October, so the situation could look a lot worse.
- “Analysis suggests that the poorest households may face average inflation rates of as high as 14%, compared to 8% for the richest households.“
US Oil to Gas Ratio
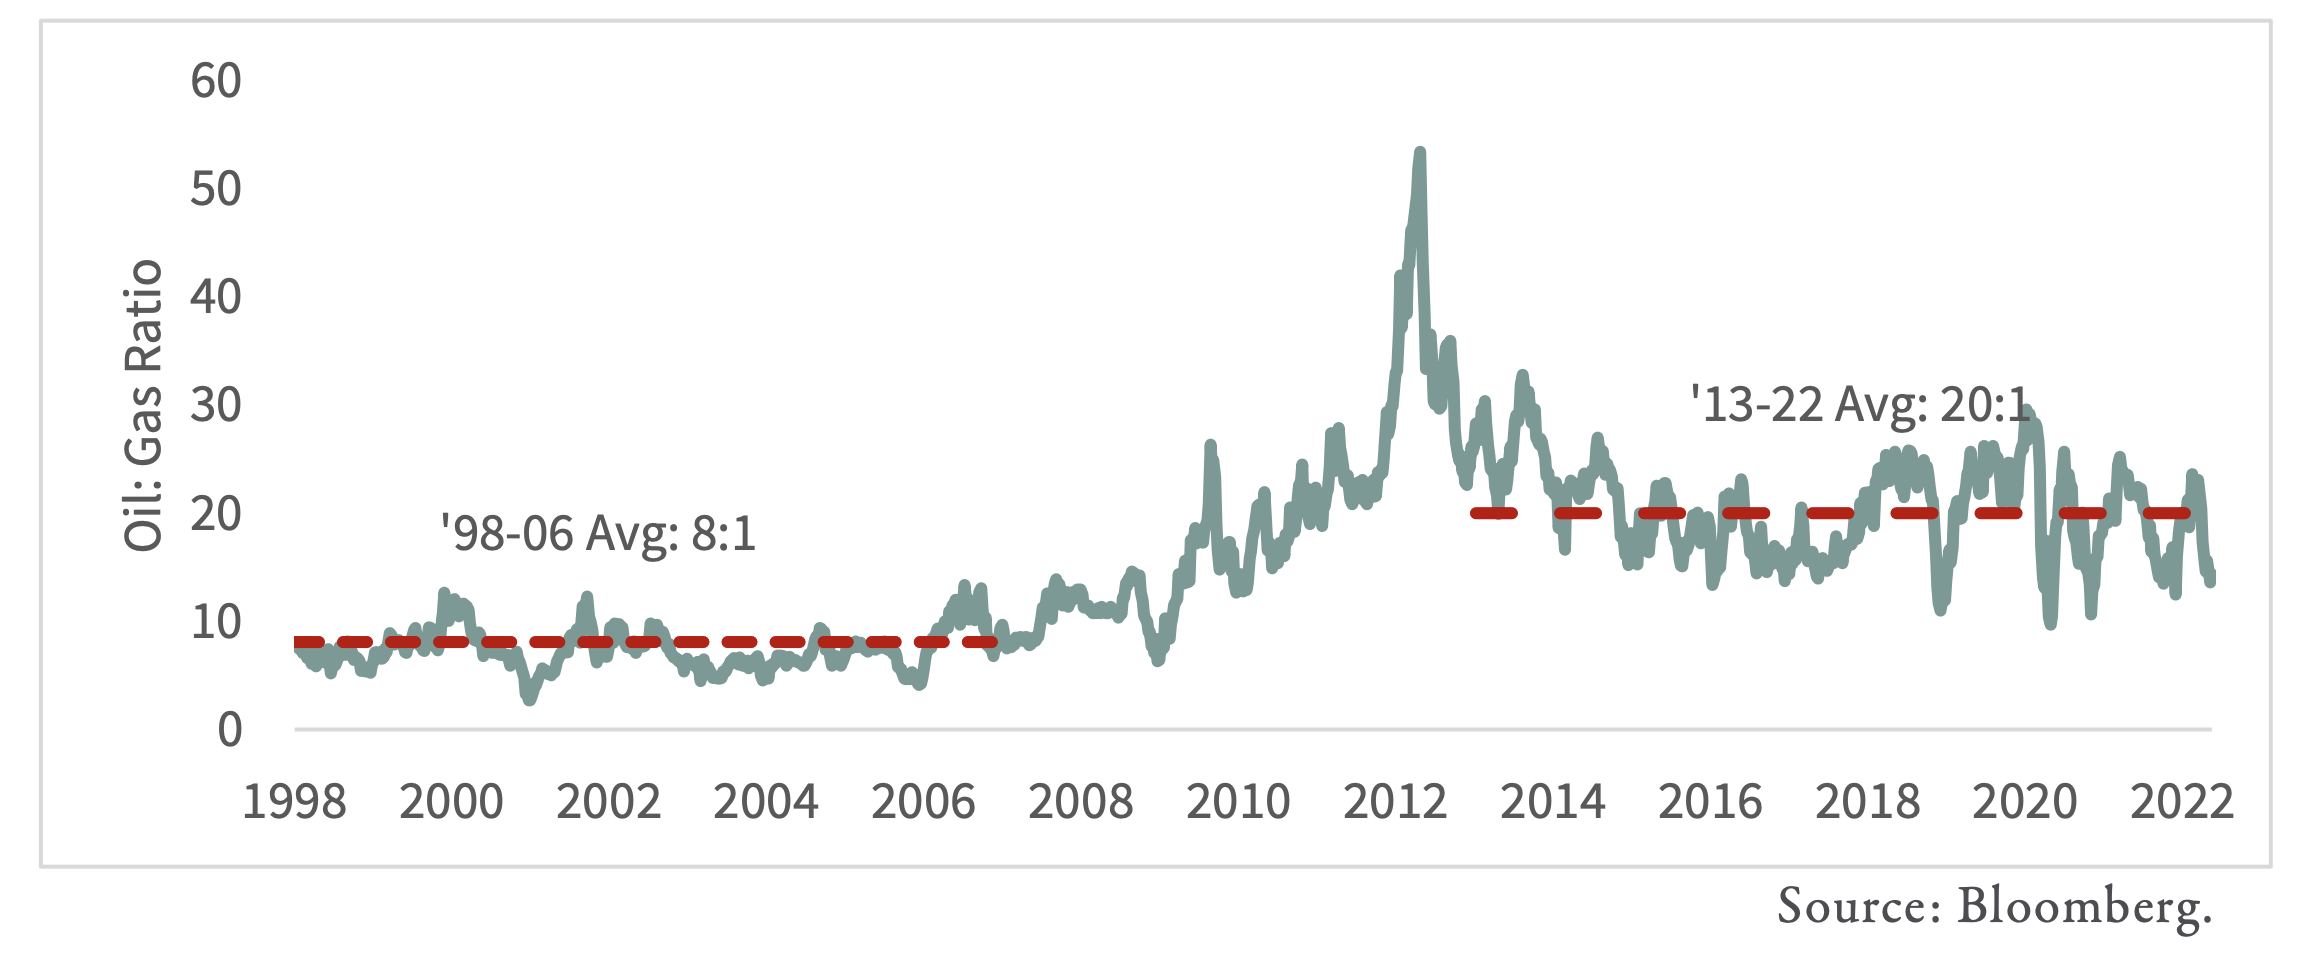
- Before shale took off oil to gas prices averaged 8 to 1 – close to their energy equivalence ratio.
- Since 2013 this ratio has averaged 20 to 1.
- Outside of North America the ratio is 3 to 1.
- “In other words, US gas is priced at an energy-equivalent discount of 56% to world oil and a 77% discount to world gas. In our 35 years investing in global energy markets, we have never seen such a wide disparity.“
- Source (including arguments on why it might revert).
Realtor Numbers
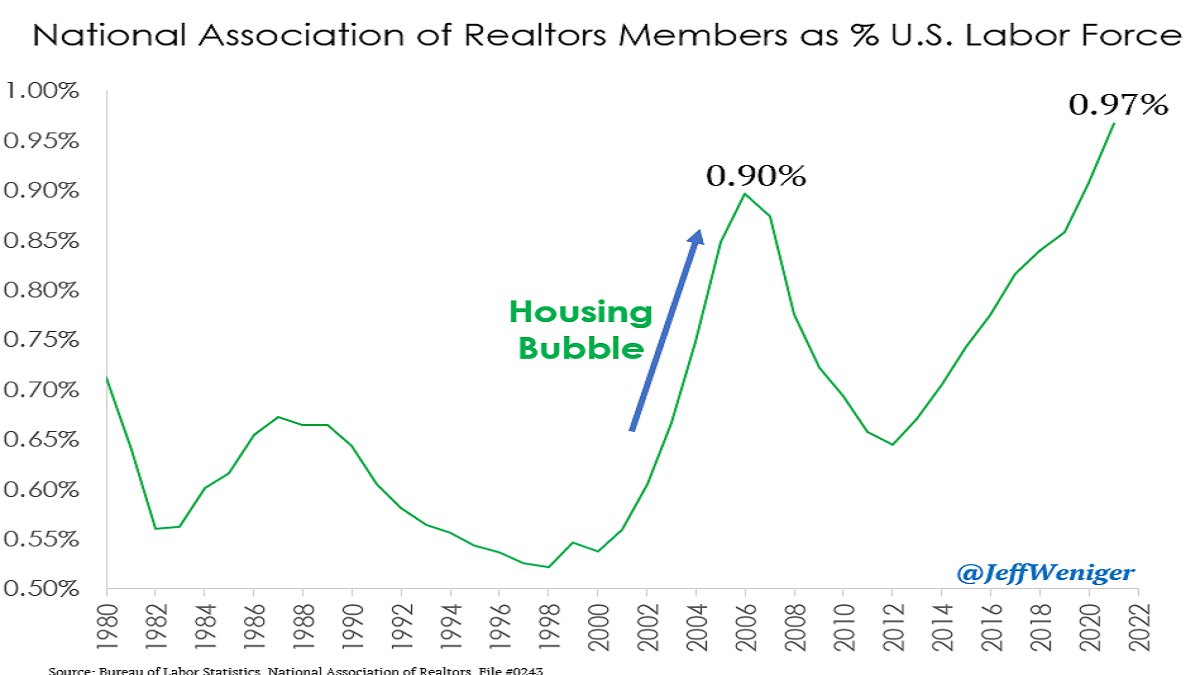
- Number of realtors working in the US has surpassed the housing bubble peak.
- Source.
Macro Trading
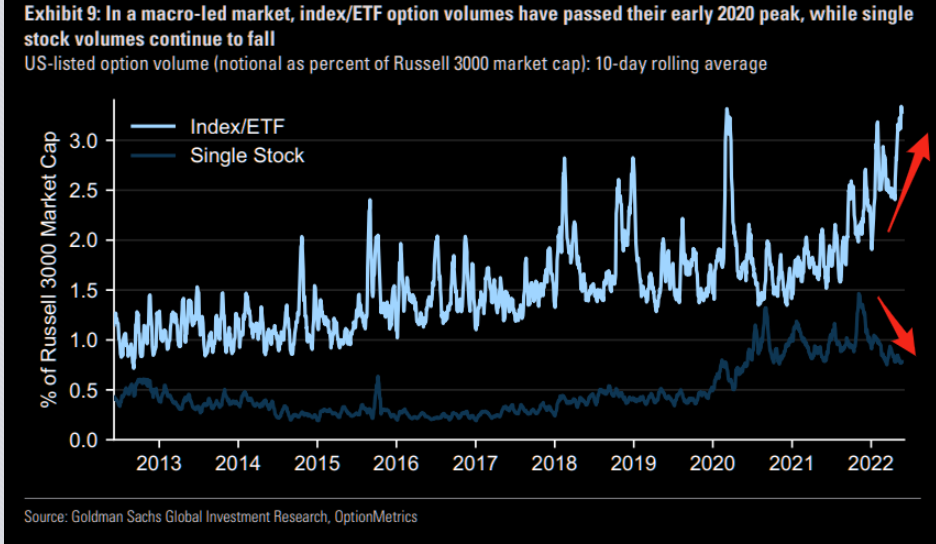
- Interesting divergence – volume in options on index/ETFs is rising while that for single-stocks is falling.
- This is a sign of a macro trading market.
Secretary of Energy
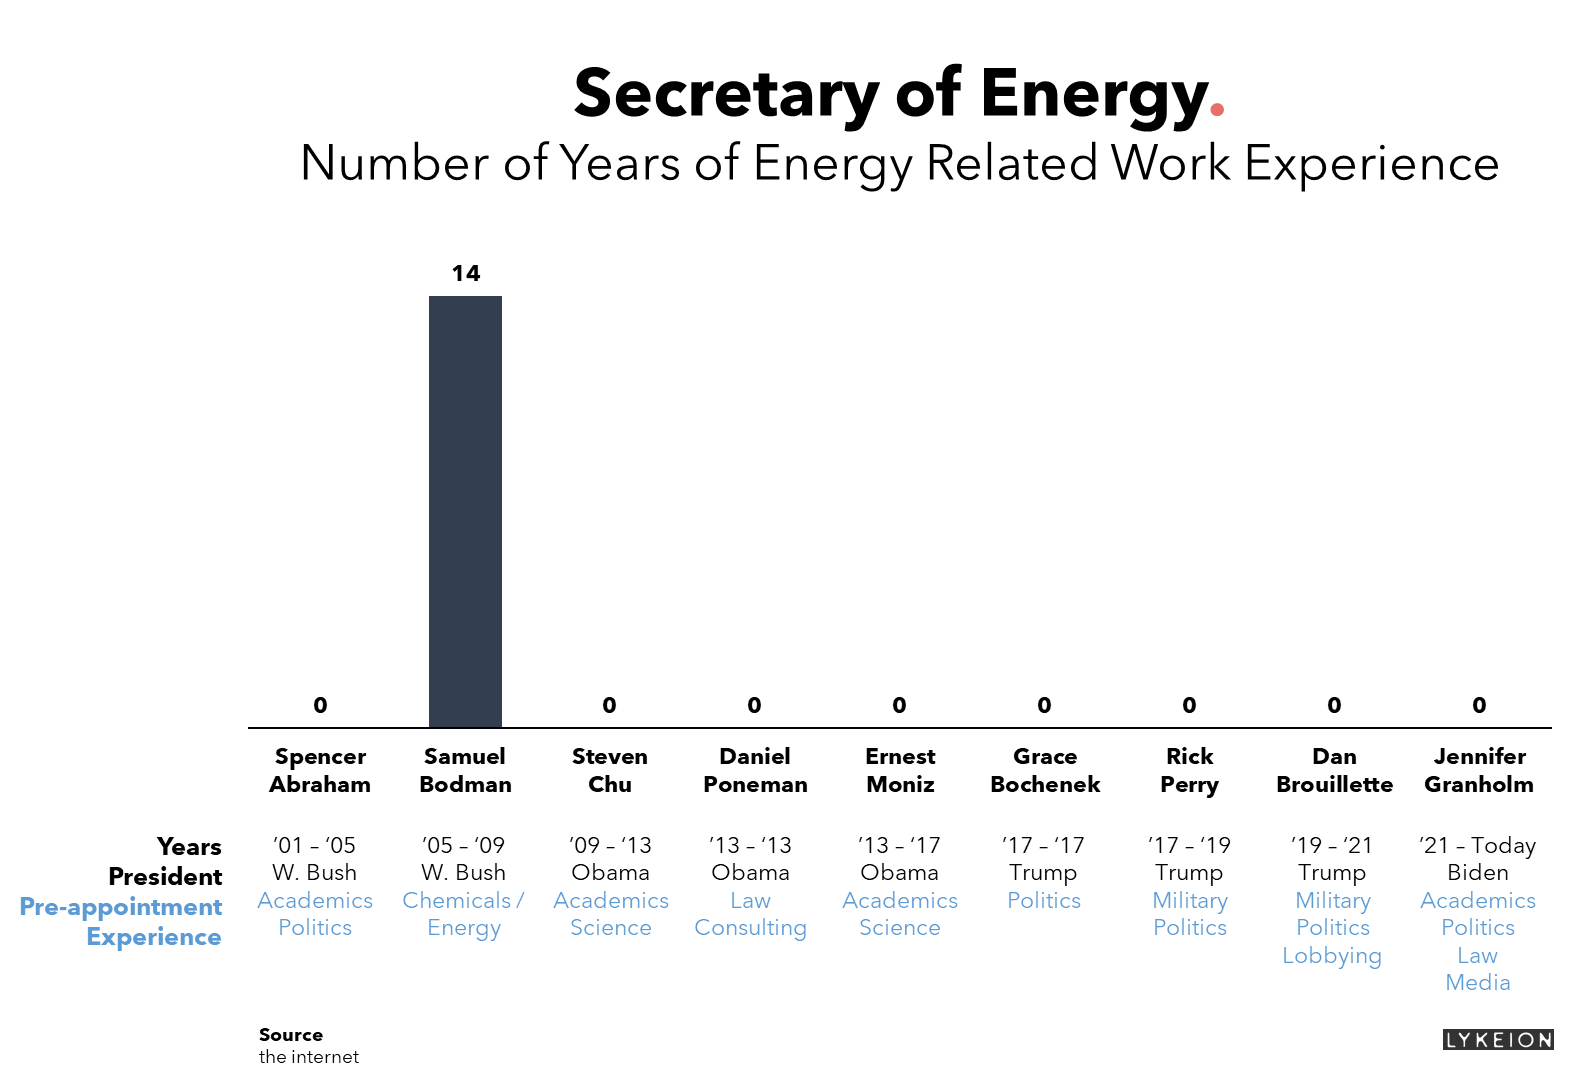
- “Over the last 20 years, across four Presidents (two Republicans and two Democrats) we have had exactly one energy secretary with any real-world energy experience before they were brought into the President’s cabinet.“
- Source: Lykeion.
Energy Misunderstood
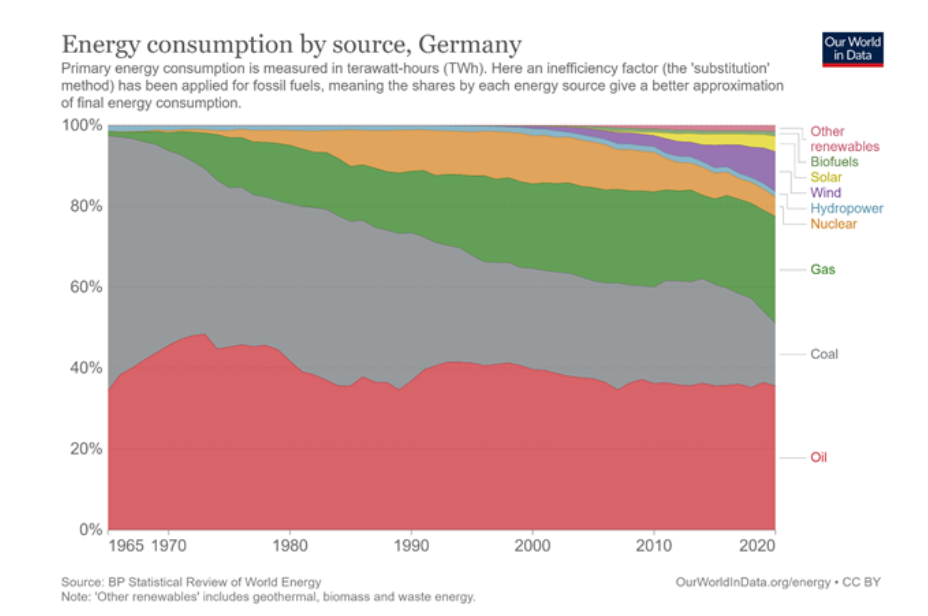
- “85% of energy usage comes from burning things” and “human civilisation is powered by combustion“
- So starts this excellent post on the current state of affairs and how they are described by politicians and the media.
- The first big point is electricity does not equal energy. Electricity is only roughly 20% of world energy use.
- Therefore, renewables, a minor part of electricity generation, are only a slither of the much bigger energy pie.
- This chart “hammers” the point home.
- As does this – from individuals in the know – “a net-zero policy, actually implemented “would certainly be the most significant act of mass murder since the killings of one hundred million people by communist regimes in the twentieth century—and it would likely be far greater.”“
- Tough reading.
Wage Price Spirals
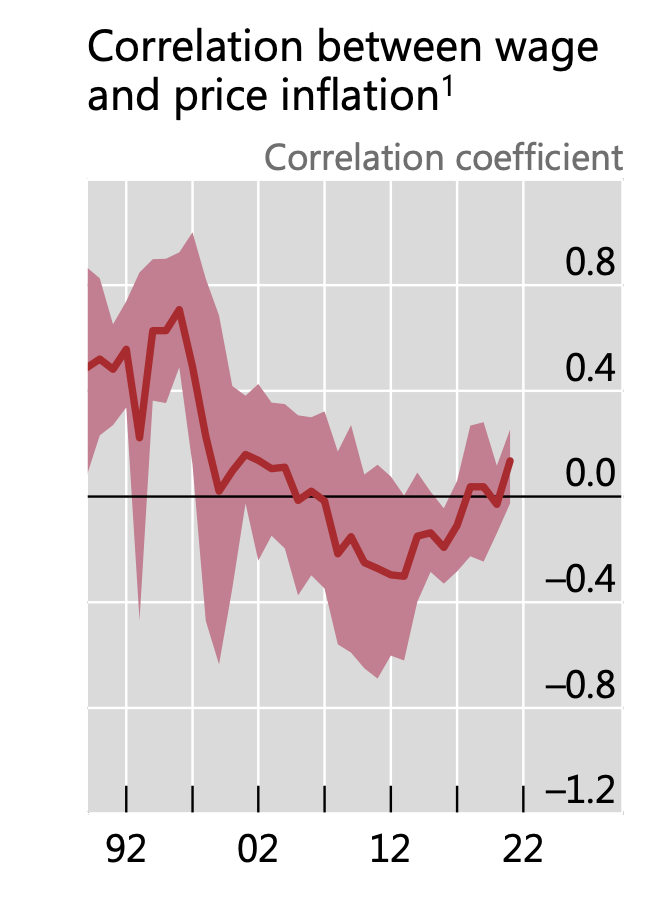
- “The correlation between wage growth and inflation has declined over the recent decades and is currently near historic lows. It is notable, however, that this correlation has ticked up recently“
- Source.
Wage Growth
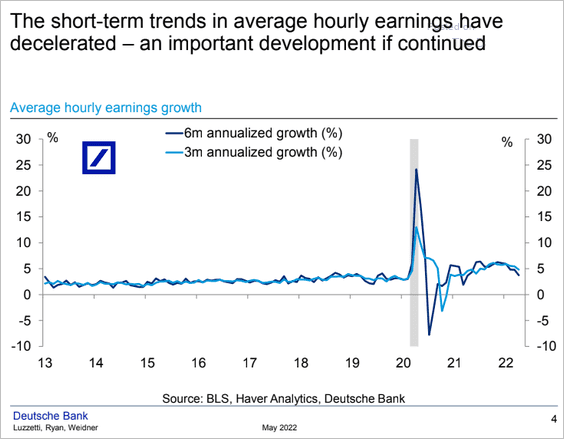
- Interesting to see wage growth rolling over. An important chart for long-term inflation.
- Source: DB.
Inflation Expectations
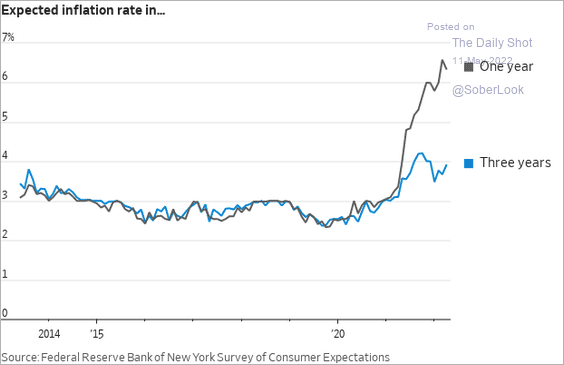
- Economists often focus on inflation expectations as the key driver of inflation – as expectations ingrain they feed inflation.
- Although recent work has, as usual, thrown shade on these ideas, they are still important to watch.
- Chart h/t Daily Shot.
The Best Strategies for Inflationary Times
- Most investors, including me, have limited experience of inflationary risk.
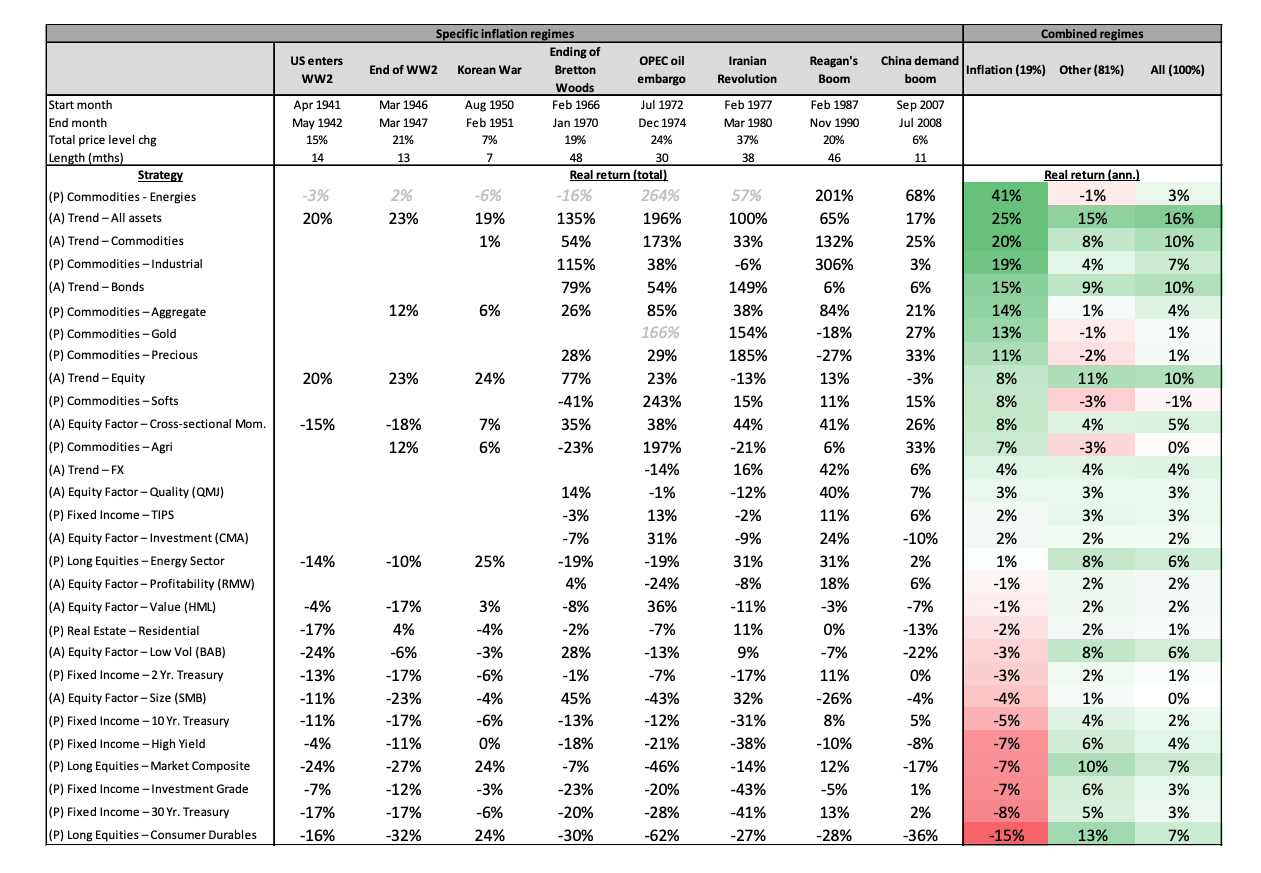
- This paper, from 2021, is an excellent guide – looking at passive/active strategies across asset classes over the past 95 years.
- As we have seen it is tough – unexpected inflation is bad for traditional assets (bonds, equities). Commodities do well but depends which ones. Trend following and active equity are the best protection.
Google Search Philips Curve
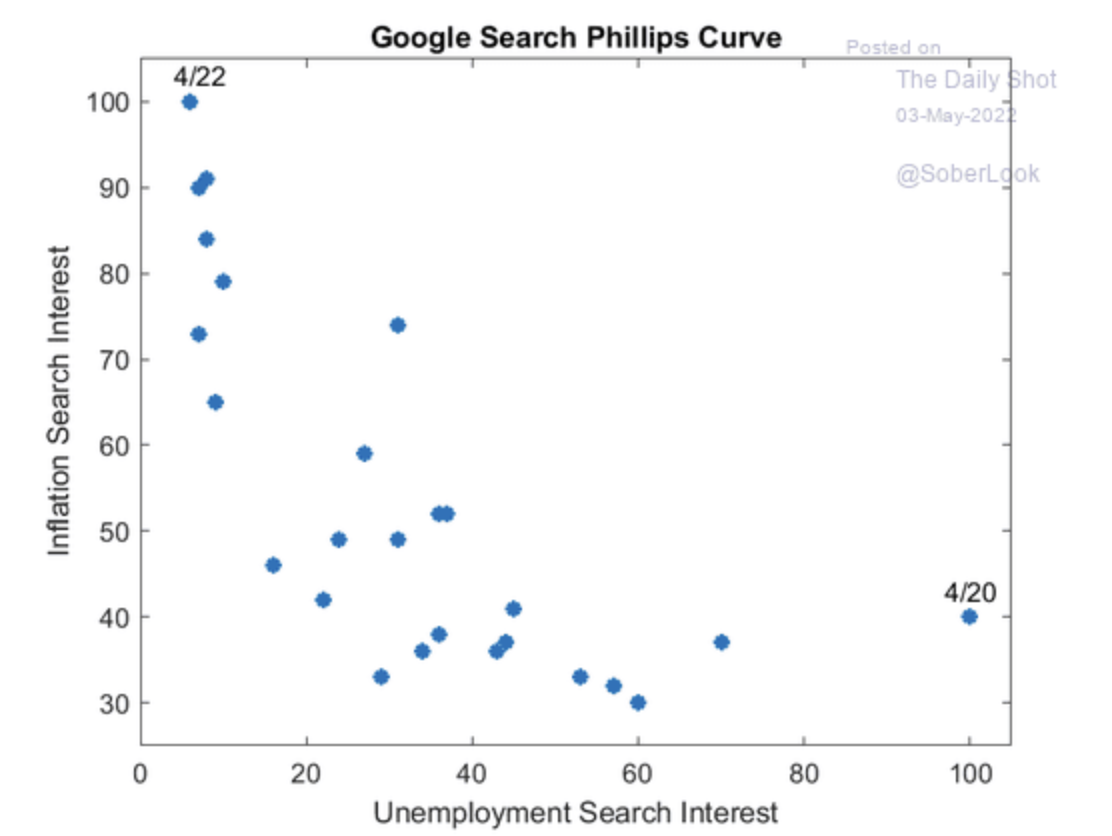
- Nice twist of the famous Philips curve using Google search data.
- Source.
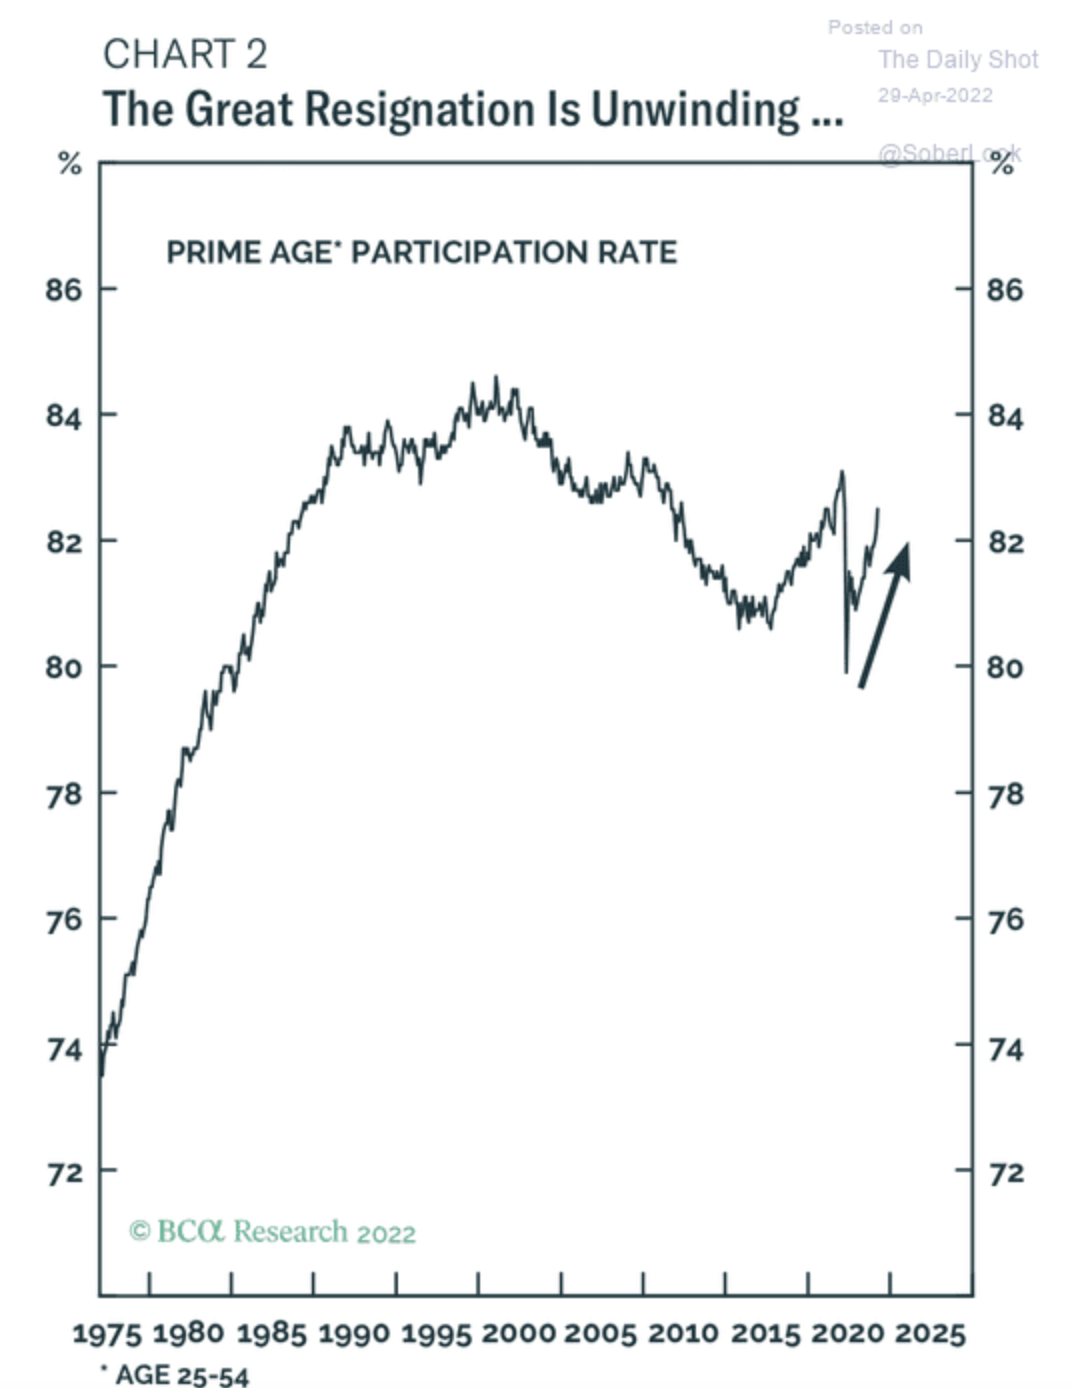
Participation Rate
- Interestingly the US labour force participation rate is reversing.
- Is the great resignation ending?
- Source: BCA Research (h/t The Daily Shot).
Jim Grant Interview
- Jim Grant has been publishing the Interest Rate Observer since 1983 (that is nearly 40 years!).
- He is a noted contrarian, who has witnessed market booms and busts and all manner of human folly in-between. Always armed with a sharp mind, a wonderful network and a skilled pen.
- This was a nice recent interview with him on his views especially on the impact of rising interest rates.
- “That’s what we try to do at Grant’s. We try to imagine how a hardened consensuses of opinion could change—how people think that there’s no alternative but the way things are, and how that could change. So yes, there will be trouble ahead, but also a lot of interesting things to do.“
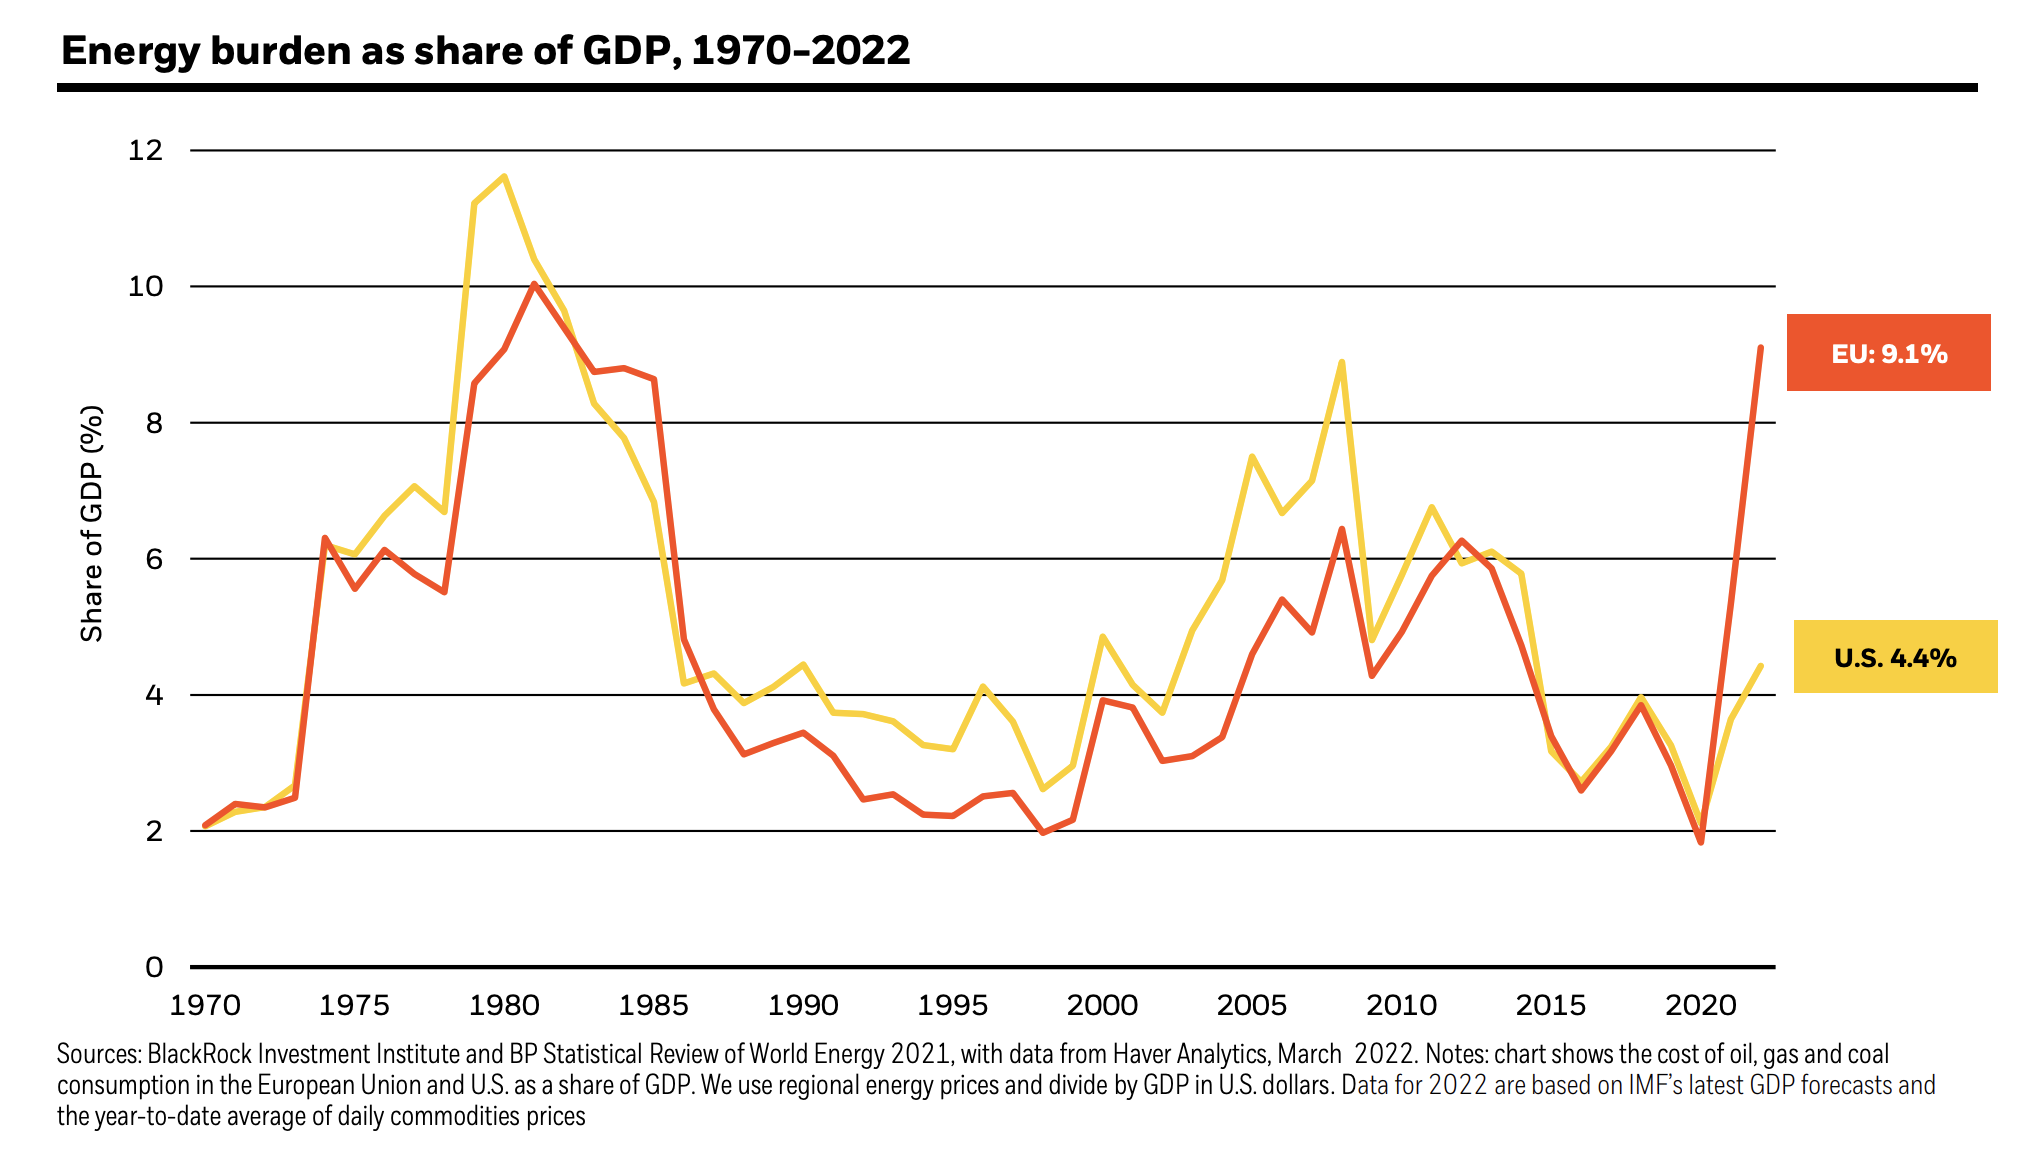
Poor Europe
- Europe always seems to end up looking worse.
- Europe currently has almost twice the energy burden of the US.
- Source: Blackrock.
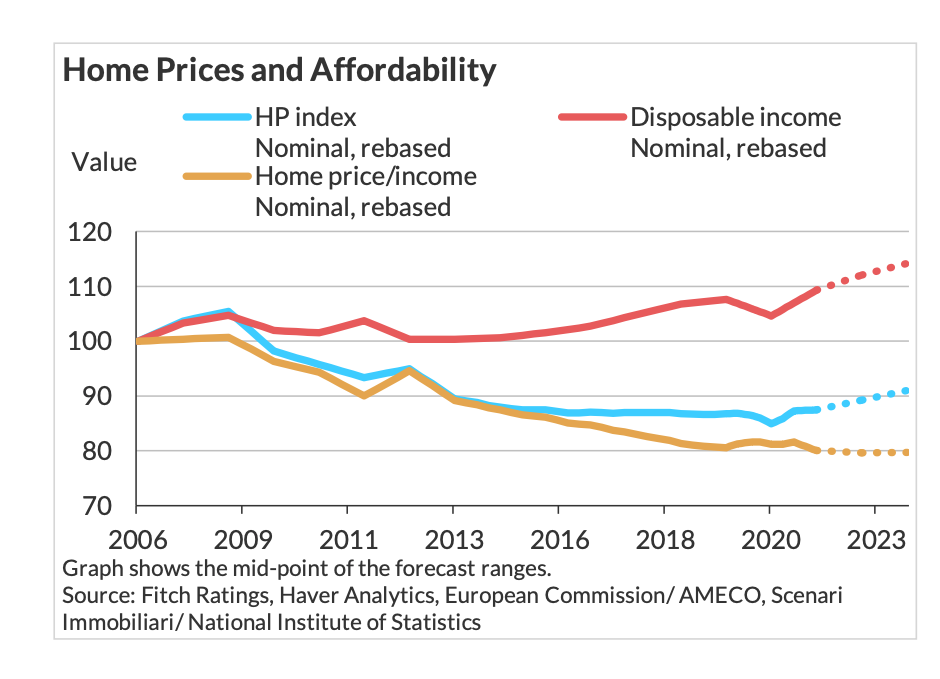
Italian House Prices
- Almost uniquely in Europe Italian house prices have been very weak in the last several years.
- This has meant, that despite only moderately increasing income, affordability has improved a lot.
- Source: Fitch.
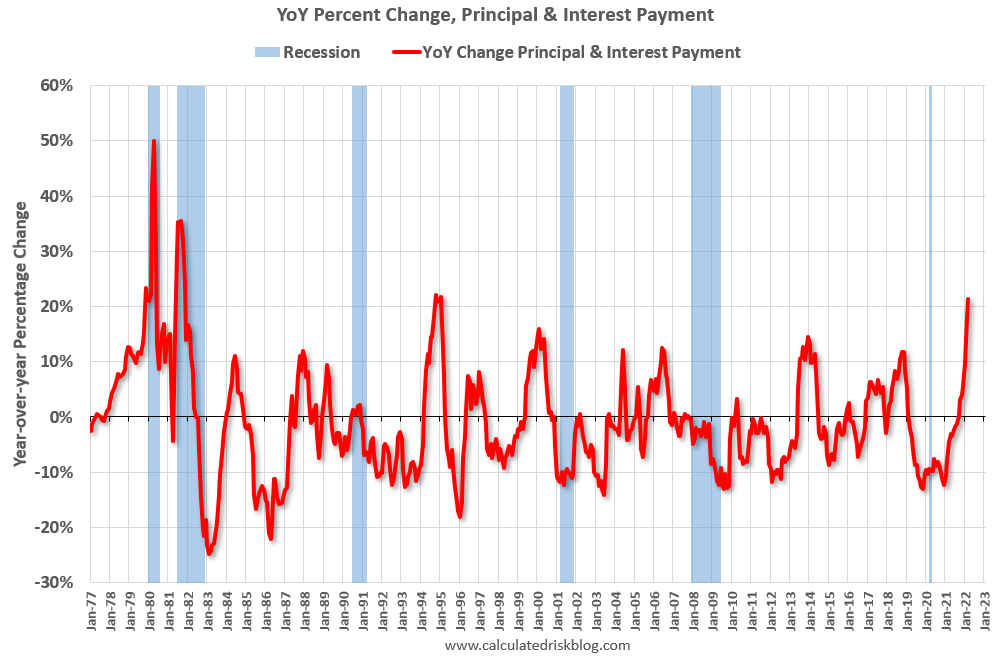
Mortgage Payments
- Interest rates are hitting mortgage payments hard.
- “The following graph shows the year-over-year change in principal & interest (P&I) assuming a fixed loan amount since 1977. “
- “Currently P&I is up about 21% year-over-year for a fixed amount (this doesn’t take into account the change in house prices).“
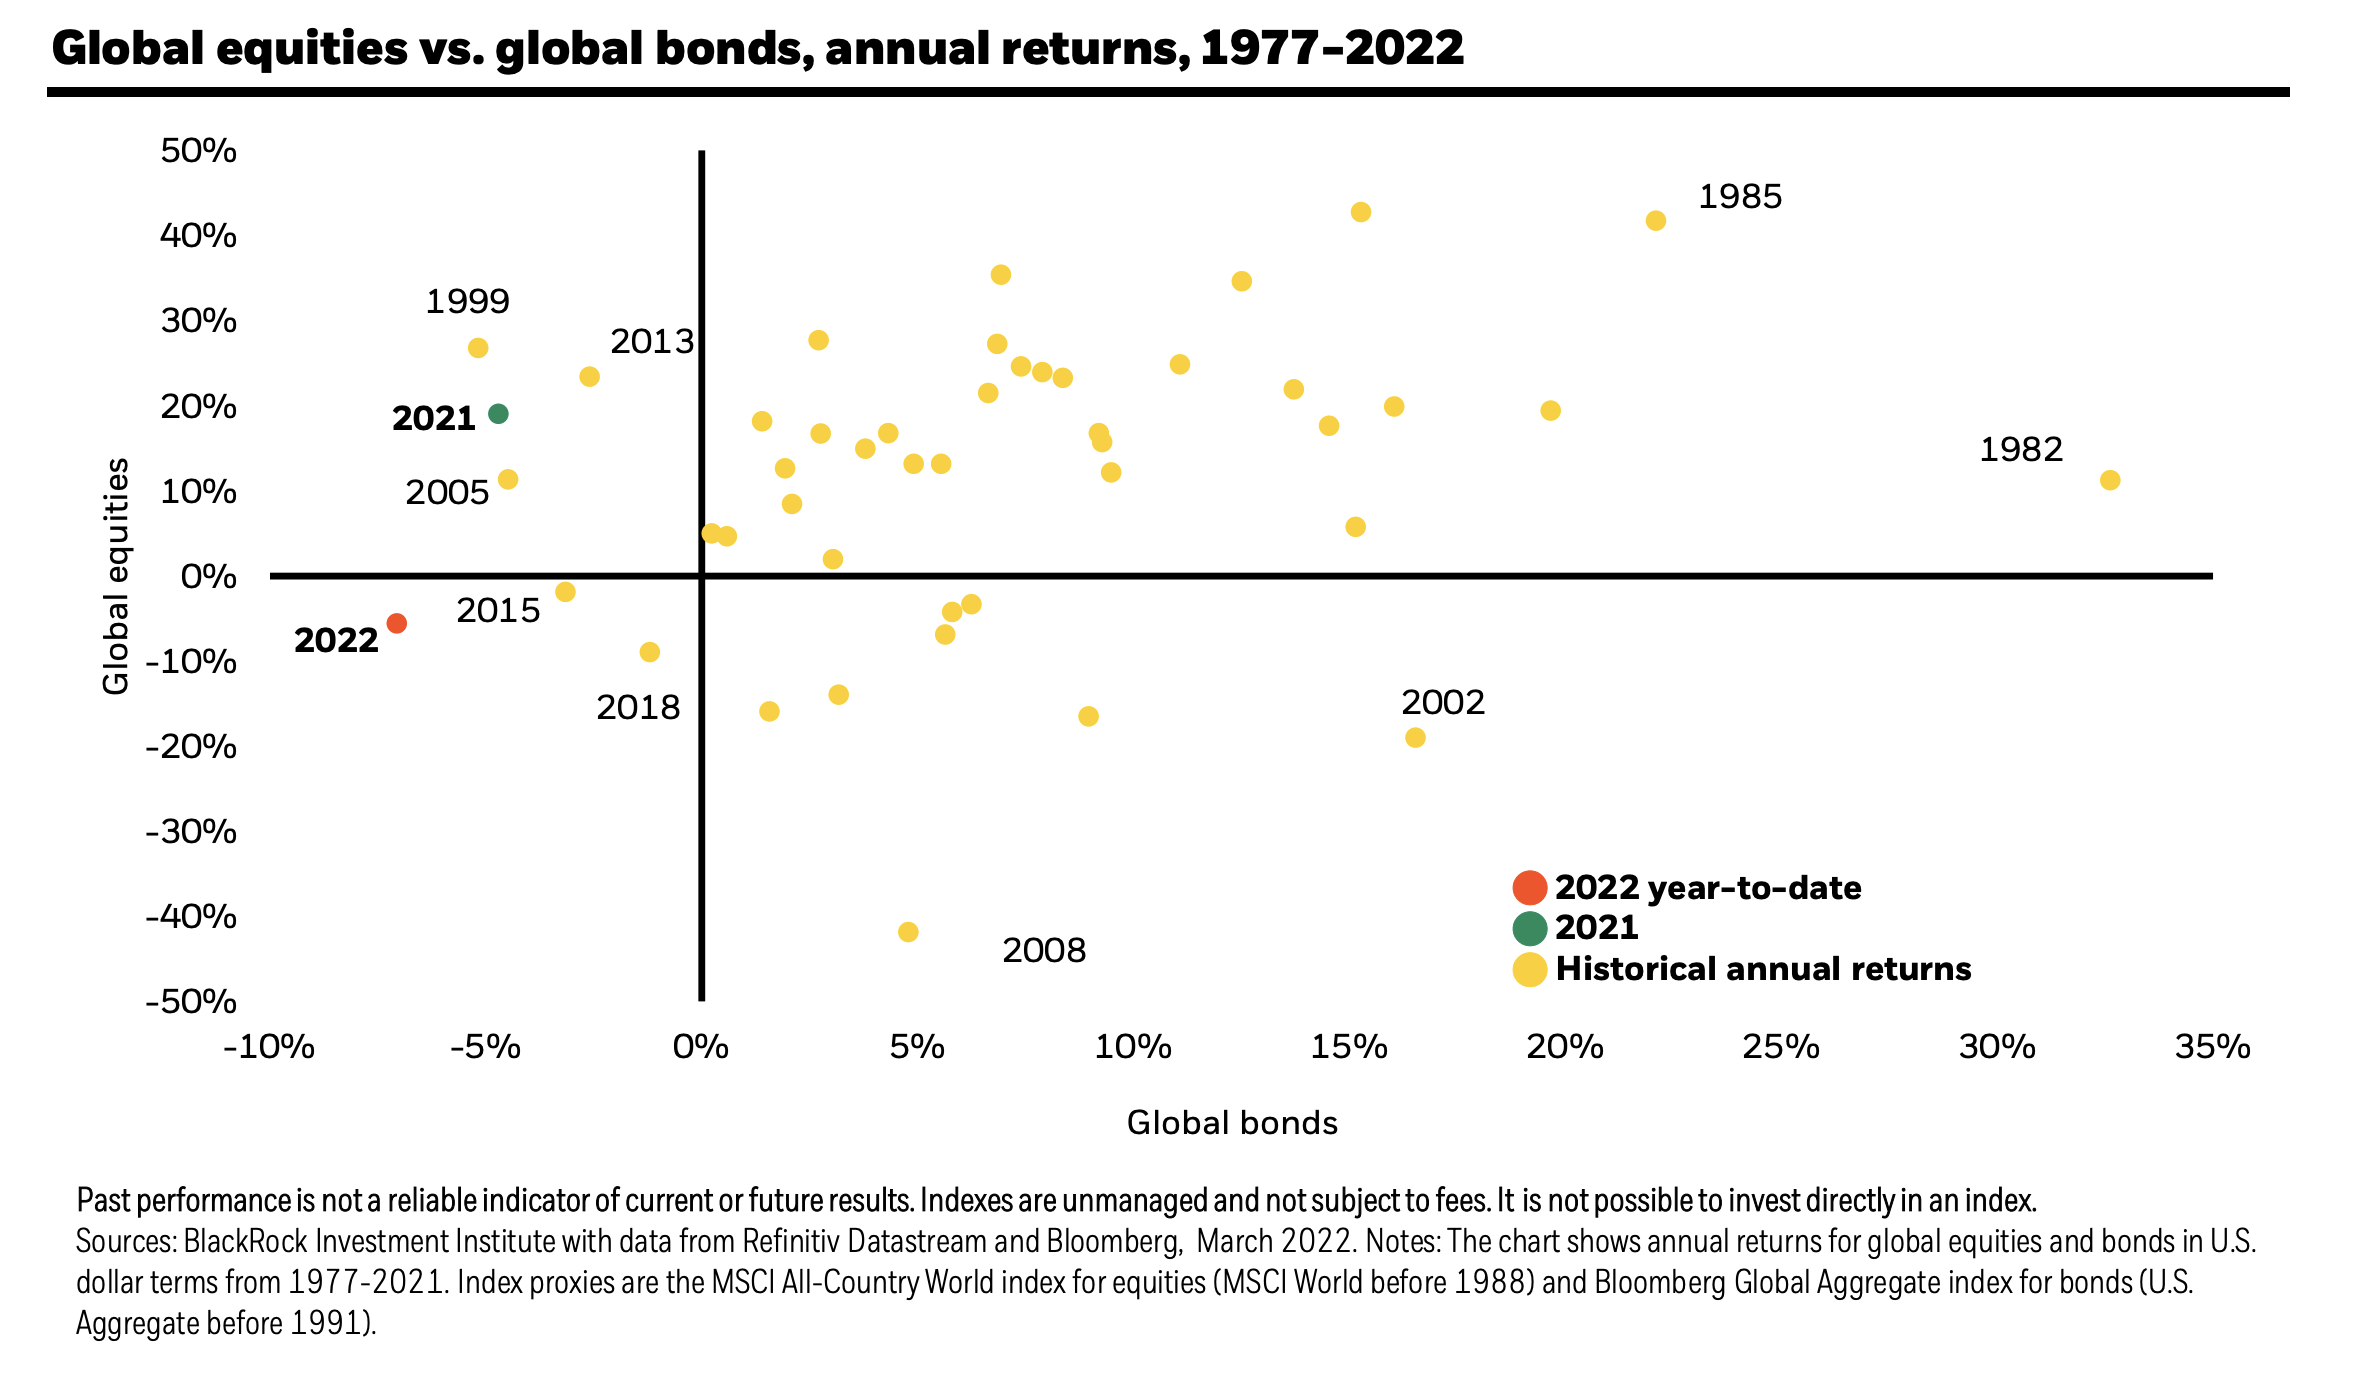
Equity and Bond Performance
- 2022 really does stand out …
- Source: Blackrock.
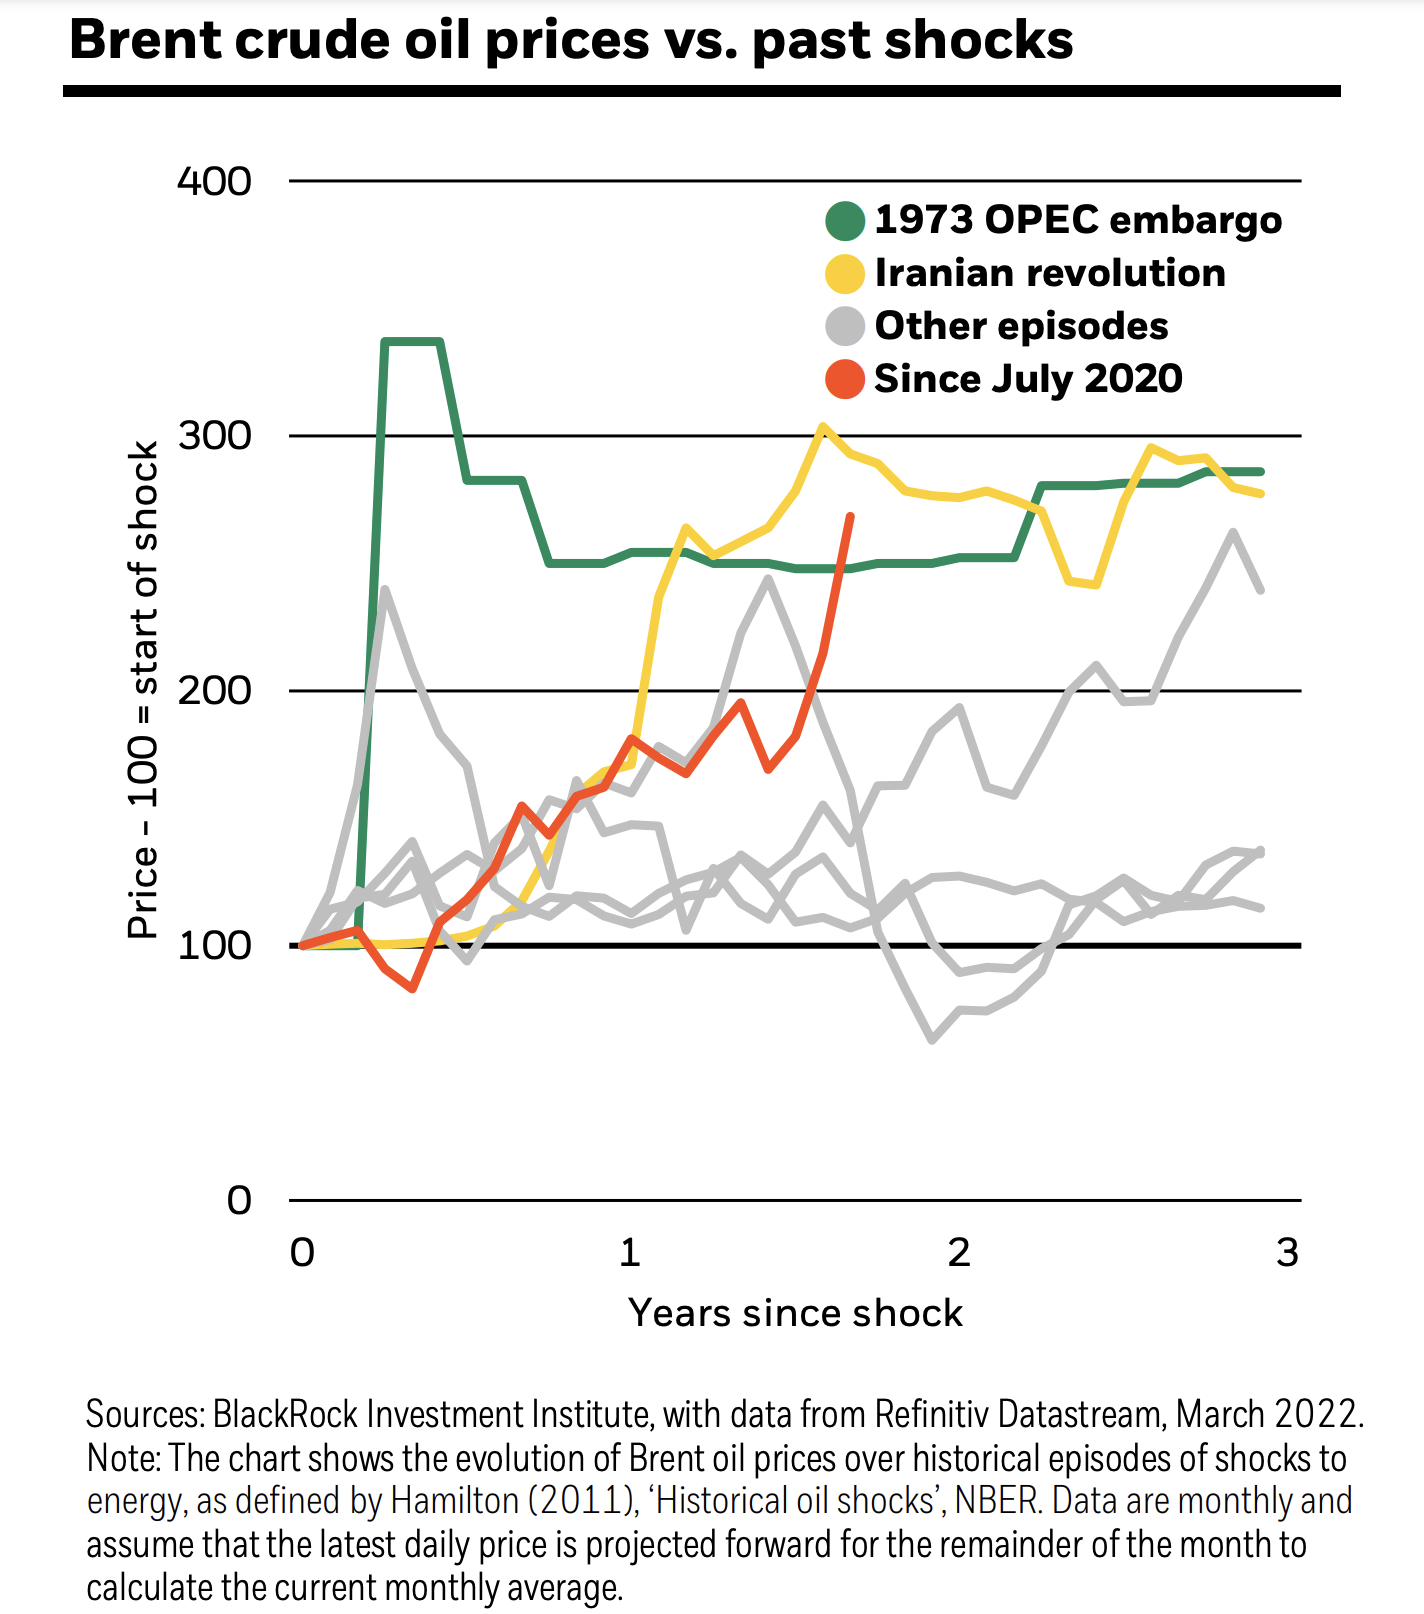
Oil Shocks
- Recent oil price shock is now almost the same magnitude as the worst historic shocks.
- Is the worst behind us?
- Source: Blackrock.


